Since I had the new data, I thought I’d update the following graphic that I made a few years ago, which only covered up to 2019.
Figure 1. The 2019 version of energy consumption.
When I put that out, people were saying things like “You don’t understand. Solar and wind are growing exponentially! Just wait a few years and you’ll see!”
So, having now waited a few years, here’s the 2022 version. This time I’ve split out fossil fuels as a separate line. I’ve also added a line for traditional biomass. All the data is from the BP spreadsheet linked above except traditional biomass, which is from Our World In Data.
Figure 2. The 2022 version, including traditional biomass and fossil fuels as separate lines.
There are some very interesting things about this graphic. First, all the solar and wind in the world combined doesn’t provide even a third of the energy we get from wood and dung.
Next, I can hear some people thinking “Wait a minute, what about all the nuclear and the hydroelectric? I’ve seen charts where they are much larger! Why is the violet line so near to the red line?”
Well, the simplest answer is … we’re being lied to. Those charts you’re thinking about only show the actual energy for fossil fuels. For fossil fuels alone, they report the real energy we use to heat our houses, cook our food, power our cars and factories, and all the rest.
But regarding all the other sources except fossil fuels, the nuclear, hydro, various renewables, and the rest, in every case the true energy numbers have all been multiplied by about two and a half.
Why? Well, here’s the explanation from the BP folks:
Figure 3. The explanation from BP about the “input-equivalent” method used to make nuclear and everything else but fossil fuels look bigger than they are.
But that “two and a half times reality” is just imaginary energy. You can’t use it to heat your house or run a factory. My graphics above show the actual energy consumed. And the truth is, nuclear provides less than 2% of our global energy needs, as does wind. And solar provides less than 1%.
Don’t believe me? Here’s Our World In Data on the subject.
Figure 4. Percentage of energy consumption by source. DATA SOURCE.
It’s worth noting that traditional biomass is second only to fossil fuels in providing us with our daily energy, and that fossil plus traditional biomass provide us with ~ 93% of all the energy we use.
(A word in passing—if you’d prefer to deal with real energy numbers rather than imaginary “input-equivalent” figures, look for the word “Consumption” in the description of the data. That’s the amount of energy that is actually consumed, not the “input-equivalent” fantasy figures that the alarmists like to quote.) [Section removed, commenters pointed out that too many sources don’t follow that convention]
Here’s the rude reality. There’s no way we will get off of fossil fuels for decades and decades. And until we have a market-ready equally inexpensive replacement for fossil fuels, all that fighting against them will do is increase energy costs, and that will assuredly screw the poor today …
And while screwing the poor today in the false hope of helping them in the year 2050 isn’t a crime … perhaps it should be. Because here’s the direction the lunacy is going.
Figure 5. Investment in solar energy and fossil fuels, 2013 and 2023
The IEA people are celebrating this, thinking it’s a big win for renewables … but here is the 2023 investment in fossil fuels and solar per 2023 kilowatt-hour of energy consumed from each source:
Figure 6. 2023 investment in fossil fuels and solar energy, per kilowatt-hour (kWh) of energy consumed by each source.
We’re spending far more on solar than the real-world sale price … “cheapest form of energy”, my okole …
Here’s another way to consider the insanity. According to the Manhattan Institute, we’ve spent $5 trillion on wind, solar, and biofuels in the last two decades. That works out to $0.18 per kilowatt-hour (kWh) of wind + solar + biofuel energy consumed …
That subsidy alone is more than the US electricity sales price, which itself is jacked up by useless renewable sources. Many US states that run on coal and gas charge about $0.11 per kWh for electricity. Here in California, with lots of renewables, I pay $0.28 per kWh … grrrr.
Conclusion? We’re paying through the nose for useless, intermittent, unreliable renewable energy. After spending literally trillions of dollars on solar and wind, their combined contribution to the world energy situation is under two percent.
Under. Two. Percent.
Trivially small. Meaningless. Makes no difference. Lost in the noise.
But instead of admitting that and stopping the foolishness, politicians continue shoveling further billions of your and my money down a rathole and accomplishing … well …nothing.
Think of all the good we could actually have done with those five trillion dollars spent over two decades on meaningless renewables. That works out to six hundred and eighty million dollars per day, or two hundred fifty billion per year … the number of pressing real-world problems we could have solved with that amount of money is incalculable.
If you want a list of what the money could be spent on, you couldn’t do better than the Copenhagen Consensus’s list of 12 of the best investments we could make.
The 12 best investments for the world
The 12 best policies, our experts have identified, cover a wide range of areas: tuberculosis, education, maternal and newborn health, agricultural research and development, malaria, e-procurement, nutrition, land tenure security, chronic diseases, trade, child immunization and skilled migration.
These have both costs and benefits. The annual costs, as shown in the figure below, rise from $30 billion to almost $50 billion by the end of the decade, for an average cost of $41 billion per year. The 2030 cutoff just denotes the end of the SDG era — these policies would also be phenomenally efficient in the years and decades after. Indeed, for some of them, the researchers estimated the costs and benefits far beyond 2030, as indicated in the individual analyses.
These have both costs and benefits. The annual costs, as shown in the graph above, rise from $30 billion to almost $50 billion by the end of the decade, for an average cost of $41 billion per year. The 2030 cutoff just denotes the end of the SDG era — these policies would also be phenomenally efficient in the years and decades after. Indeed, for some of them, the researchers estimated the costs and benefits far beyond 2030, as indicated in the individual chapters.
That’s just one look at the difference $280 billion could make if spent wisely over the next seven years. 4.2 million lives saved, $1.1 trillion in economic benefits.
Instead, here’s all the difference the $250 billion dollars per year spent on solar, wind, and biofuels over the last two decades made to atmospheric CO2 levels, the CO2 “problem” that the trillions of wasted dollars are supposed to be solving.
Like I said … grrrr.
[UPDATE] Over at his substack, Dr. Roger Pielke Jr. has discussed the new BP data as follows:
The figure below shows that in 2022, more than 18% of total energy consumption came from non-fossil sources. That’s the highest it has been in my lifetime.
Over the past decade, carbon-free energy consumption has increased as a proportion of total consumption from less than 14% to above 18%.
However, he’s totally misrepresenting the situation. First, he’s not including traditional biomass, which is larger than all his “non-fossil” sources together.
Next, his “non-fossil sources” (hydro, nuclear, wind, biofuels, solar, geothermal, other) only total 7.5% of total energy, not 18%. See Figure 4 above for confirmation. He’s showing you the “input-adjusted” fake data.
Once we include traditional biomass (another “non-fossil source”) and use actual consumption figures rather than the “input-adjusted” nonsense, the trend in non-fossil sources looks like this:
I can’t comment on his substack because you have to be a subscriber, but I invite him to come here and discuss this question. If anyone knows him, could you please pass this invitation on to him?
On a related subject, since I had the new BP data in front of me, I thought I’d take a look at the capacity factor for solar installations in various countries. The “capacity factor” is the ratio of the actual energy generation from a power source to the “nameplate” amount it generates at full power. For fossil and nuclear, this is on the order of 90% plus, meaning it generates full power about 90% of the time. Here are the capacity factors for grid-scale solar power by country.
Figure 5. Solar capacity factors by country.
Enjoy.
Here, it’s Sunday, my day off from house maintenance and endless mowing. Went to the coast this morning with the Gorgeous Ex-Fiancée. The Pacific was pacific indeed today—no waves, hardly a breath of wind. And as soon as I wrap up this post, gonna watch some béisbol, Giants vs. Mets. Life is good.
With wishes that you all have a life full of wonder,
I checked Dr. Roger Pielke Jr’s site. He only takes comments from paying subscribers, so I comment it just here.
He use the data that is multiplied with 2.5 for non-fossil sources.
One can argue whether it is correct or not to use such a conversion factor between electricity and fossil energy, but at least you must be consistent, and you should inform about it.
When he calculates how many windmills or nuclear reactors we need to build to replace all fossil souces he forget the multiplication factor.
Like most people (other than Willis) Dr. Pielke, Jr. appears to not know that he was siting sources that did not make plain their data was adjusted arbitrarily. Ugly stuff to support an ideological position (not facts) on their part.
DMA
July 3, 2023 2:29 pm
Willis
DO you have any idea how the “biomass” used is estimated? If so do you think it is reasonably accurate?
Thanks
Even my Mark I eyeball can see that at the peak, renewables were providing about 18,000 MW and gas was providing about 4,000. That’s only 82%, not the 95% they claim.
That was on a mild, sunny spring day and you can still see the damage caused by solar generation. Ramping gas is expensive and import and export markets are unreliable in the long term.
Summer peaks cause unavoidable damage to the electric power system through the dominance of solar; see the Duck Curve issue writeups. The State regulators are warning of the likelihood of blackouts this summer.
Curious about the negative import (export) how much was California PAYING adjacent states to TAKE our surplus ruinable generation?
Dave Rutledge
July 3, 2023 2:57 pm
Willis,
“The explanation from BP about the “input-equivalent” method used to make nuclear and everything else but fossil fuels look bigger than they are.”
The distinction between the primary input energy and secondary output energy, usually electricity, is old. I have the Statistical Review workbooks back to 2003, when there was no solar or wind electricity to speak of, and it is used in all of them.
The primary input energy in a hydroelectric plant or nuclear power plant is larger than the output electricity generated, but it is not known, in contrast to the situation in a coal power plant, where the heat content of the coal is known. There are times when one wants to emphasize the electricity outputs and there are times when one wants to emphasize the energy inputs. The BP approach of using a uniform conversion factor is a common convention and it has the advantage of indicating how much coal a nuclear plant or hydroelectric plant would displace.
There are similar conversion issues that arise in comparing electric heat pumps with gas furnaces and electric vehicles with gasoline powered cars.
This is not a controversial concept among people who write about energy, regardless of their perspective on climate or fossil fuel supplies.
Dave, I know the input-substitution method has been around for a while. Inter alia, it says so in the BP methodology I quoted in the head post.
And I know it has uses.
However, its main use seems to be to mislead people as to how well non-fossil sources are coming along. Sure, if you multiply them all by 2.5 it looks great … but that’s not real energy. It’s imaginary energy.
It’s also bogus because it ignores the fact that the thermal efficiency of a nuclear power plant is no greater than that of a fossil power plant … so why is one artificially increased because of thermal efficiency and not the other?
Next, it’s bogus because solar and wind sources do not “displace” fossil fuels. We still need the fossil fuel generators as running backup, and inefficient running backup at that.
Finally, it’s bogus because it only applies to electricity, but it’s used all the time to compare to the total energy used for industry, mining, ships, airplanes, and the like.
In short, it’s far too deceptive to be given to the general public without a HUGE sign that says “CAUTION: IMAGINARY ENERGY AHEAD!!”
Imaginary is too strong a word for me. Solar panels and wind turbines have conversion efficiencies that are not too different from a steam plant. We are just not metering the inputs. In a nuclear power plant, similarly, the input energy (again, un-metered) would be comparable to the heat content of the coal used in a competing power plant. Hydro is in a different efficiency league altogether.
The late David MacKay, in his book “Sustainable Energy,” followed your philosophy. But, in doing so, he realized that he had to discuss the conversion issues, and he did. Switching from a natural gas furnace to an electric heat pump reduces the home energy consumption but the natural gas consumption at the power plant rises comparably.
I support your conclusion that the alternatives share of world energy production is not growing fast enough to reduce fossil fuel production. There is a related issue that the electricity share, where alternatives are necessarily concentrated, is not growing fast enough to reduce the non-electricity energy production where fossil fuels are concentrated.
Even the IEA, whilst cheer leading for unreliables, acknowledges
“From 80% today -a level consistent for decades – fossil fuels fall to 75% by 2030 and just over 60% by 2050” (IEA World Energy Outlook 2022)
By the way the just published ‘Statistical Review of World Energy 2023’ (formerly collated by BP now by the Energy Institute) says fossil fuels provide 82% of primary energy.
I just thought I’d chime in to say ‘arrgh’, as in ‘arrgh, not another deceptive or misleading statistics practice that I wasn’t even aware of”.
One fact of life that I’ve long been aware of, but which I sometimes find surprisingly difficult to communicate to people, is the fact that thermal based electrical generators, (i.e., all fossil fueled and nuclear generators) have a very limited energy conversion efficiency (an efficiency which is thermodynamically set by the limits of practical furnace temperature vs available cooling temperature). As some indication of the efficiency possible, say, if you just look up “Steam-electric power station” on Wikipedia, they give a very broad range of 33% to 48% possible efficiency. However the upper number there is very unlikely for any really practical or economical power station. So, as you indicate, 40 percent is about the practical limit of efficiency for a thermal station boiling water to generate power from steam, meaning that you have to put *in* 2.5 times the energy that you expect to get *out* of a generating station. Now, line losses in delivering electric power to you or me are sure to cut the overall delivery efficiency to something *less* than 40 percent, but, never mind. Just try explaining to someone that that 60 percent (or more) of ‘burned’ heat has to just go to waste in the environment — I mean, just try to explain that sometimes, why we only ever get to use 40 percent of the heat produced by either burning or ‘nuking’ atoms from one form to another!
One place this comes up is in discussing the actual efficiency of electric vehicles, which lots of people naively assume are more energy efficient than regular internal combustion vehicles. If you point out that the scalable energy on the grid almost always comes from burning fossil fuels, giving EV’s only 40 percent efficiency to *start* (an efficiency which then must be reduced further by whatever factor is relevant for the EV drive train), why then, you may have an argument on your hands, despite the fact that this is almost always literally true
(as a possible exception, if you are charging during off peak hours and you happen to live near a hydro dam, say, that might work — also, if you live in a grid system that draws power from a nuclear station, then maybe the 40 percent limit isn’t so directly relevant there either). For purposes of promoting EV’s, you’d perhaps be happy to just call the waste heat from a nuclear reactor ‘free’, in the sense that we’re not getting CO2 emissions from that.
In any case, when producing charts of electric energy production, isn’t it obvious that waste heat to the environment, at the power station level at least, does not constitute actual energy production? There is nothing useful being thrown out there, nothing you can use to charge your car or do anything else with?
I don’t care if it’s Pielke, or anyone else that is pounding the energy stats this way, multiplying nuclear production by a 2.5x waste heat factor is clearly deceptive, dishonest, incompetent, etc.
Dave Fair
July 3, 2023 4:04 pm
Willis, Dr. Pielke, Jr.’s graph says “consumption.” I assume that is an error on the part of the source.
lesonline3@gmail.com
July 3, 2023 5:27 pm
But think of all the jobs the $5 trillion created; all the scientists spared from a life living on the dole…
Industries have to be invented to keep The System turning over…
EVs ! Do you even think about their small, limited future ? But the jobs created !!
The Devil finds work (Revolution) for idle hands, and we cant allow that !!
JamesB_684
July 3, 2023 5:45 pm
The real purpose of the “Green Energy” spending is to create cash flow that enables vast quantities of siphoning off monies into the pockets of politicians.
“We know that they are lying, they know that they are lying, they even know that we know they are lying, we also know that they know we know they are lying too, they of course know that we certainly know they know we know they are lying too as well, yet they still lie.”Aleksandr Solzhenitsyn
I’m confused. I no longer know if I’m lying or if I’m not supposed to.
andymc
July 4, 2023 2:17 am
Willis,
I also noticed the input equivalent thing. It isn’t quite as bad as you made out. The exaggeration is about twofold. Not all renewables are used for electricity generation, so things like biofuels for cars haven’t been divided by 0.407 (the assumed efficiency of an average power generator) You can take the electrical energy outputs of nuclear, hydro, etc, add them together, divide by 0.407 and subtract from the total input equivalent energy from all non-fossil sources and assume the remainder left over was not used for electricity generation. When you convert back to actual energy, leave the remainder unchanged but multiply nuclear, hydro etc by 0.407.
What I found most interesting was looking at the UK and Germany, with their abundance of ‘cheap’ renewables. Sure, more of the electricity is from renewables, but the percentage of energy used as electricity was no different from the global average in the case of Germany and is actually lower in the UK. If it made economic sense to switch to electricity, this would have been done ages ago, since both countries have had extensive networks for the better part of a century. Still, it’s nice to see that the input equivalent energy from biofuels has skyrocketed since the last assessment;
nyeevknoit
July 4, 2023 5:31 am
Thank you Willis, always great perspectives and visualizations!
(I use “Perspectives” as helping create understanding of an issue by being accessible to customers, taxpayers, citizens, legislators, regulators..).
Academic criticism should be limited to generally right or wrong direction. No precision or absolutes needed. Wasted words and space.
In that regard, the best chart is the “2023 Investment vs consumption“! It
hits the customer and legislator right in the heart of our national priorities:
1. The cost to customers of what the policies create–both as users and taxpayers.
2. Priorites differences of taxpayers and policy makers.
Voters have to choose.
Another perspective that needs to be shown in a chart all the time.. the generator Capacity available vs Customer Demand at all the peak times for both the PJM-type wide area source/grid and the local distribution peaks.
A more refined chart would add the cost of facilities needed for energy availability, reliability, and stability at transmission and distribution locations…with and without solar, wind. Necessary modifications in switching, communications, regulation are likely NOT included in the investment or operations costs, except as cost/kWhr costs to customer.
And let’s not forget that wind and solar are not truly fossil-fuel-free energy sources. Take away the fossils fuels for exploration, mining, refining, manufacturing, transporting, installing, maintaining, decommissioning and as feed stocks for all the fossil-fuels derived materials and there would be this much wind and solar electrical generation: zero kwh.
viejecita
July 4, 2023 11:29 am
Hello Willis
Just to say I have not been able to comment, for quite a while, as the WUWT page rejected me telling me there was a Viejecita already. And asking me to chose another name and register anew. I have asked for my youngest son’s help, and he has changed me from Safari to Firefox and, at least for this afternoon I am able to say I never miss one of your papers and just love them. Even when I have trouble understanding all the charts. So
¡ Un abrazo !
Kit, without providing a single scrap of evidence, you claim that:
Replacing fossil fuels is easy. What Willis is saying is he does not know how.
Hogwash. Replacing fossil fuels is NOT easy. Try flying an airplane from LA to Sydney without fossil fuels. Try running a Panamax container ship from LA to Sydney without fossil fuels.
If it were “easy”, as you falsely claim, it would have been done long ago. But to date, we have no market-ready substitute for fossil fuels, and in a number of cases, no possible substitute, market-ready or not.
Interesting perspective. Now post that comment again without touching a device that uses fossil fuels.
I will wait patiently.
ferdberple
July 4, 2023 2:33 pm
Why does the “input-equivalent” method lump all fossil fuel together at 38%, without a similar correction for other types of fuel or within different types of fossil fuel
Then there are storage and transmission losses. Different efficiencies for coal, oil gas and the technology available to extract the energy.
In the end, it is apples to apples energy consumption as measured in units of energy that matters. Everything else is politics.
Good question, Ferd. Modern combined-cycle gas plants are 60% efficient, but nooo, that doesn’t fit the desired message …
w.
Hivemind
July 4, 2023 5:59 pm
Your graph is great, but the bottom three lines shouldn’t be labelled ‘consumption‘, but ‘production‘. Just my two cents worth.
WILLIAM TOWNSEND REEVES
July 4, 2023 9:56 pm
Mr. Eschenbach:
First of all: I love what you do on Wuwt.
Second, in your piece “The Myth of Replacing Fossil Fuels” you advise us: “if you’d prefer to deal with real energy numbers rather than imaginary “input-equivalent” figures, look for the word “Consumption” in the description of the data”. Well below is an EIA link that is billed as energy consumption ata that claims us energy consumption is 21% renewable.
How are they mistaken? How would you rebut/expose their deception?
Yeah, they’re not the only one. I’m gonna take that part out of the head post, because I find people calling it both “consumption” and “generation”.
In any case, they’re using the “input-equivalent” dodge. Here are the real values:
Note that per their graph there’s another ~1% or so of wood energy, but I can’t find figures on that.
w.
PS—As confirmation that they’re multiplying the non-fossil sources by 2.5, if you increase 9.6% of a total by multiplying it by 2.5, it becomes 21% of the new larger total … and 21% is the number that they give for the non-fossil percentage.
ferdberple
July 5, 2023 4:18 am
gas plants are 60% efficient
==========
Hi Willis
We could probably do the same with the ICE. Something like 90% of the waste heat generated in an ICE goes out the tailpipe. Otherwise cars would need huge radiators.
Like a 60% efficiency gas plant the first stage turbine is something like 35% efficient, similar to current ICE technology.
It is the waste heat from the first stage that drives the second stage steam engine that adds the additional 25% to bring the 2 stage generator up to 60%.
Adding a steam engine or similar to an ICE could possibly add another 25% for a lot less cost and weight than a battery.
The point being that the current ICE still has room to almost double fuel efficiency and any such breakthru would cast serious doubts on current EV technology.
KVS Marshall - Manicbeancounter
July 8, 2023 6:19 am
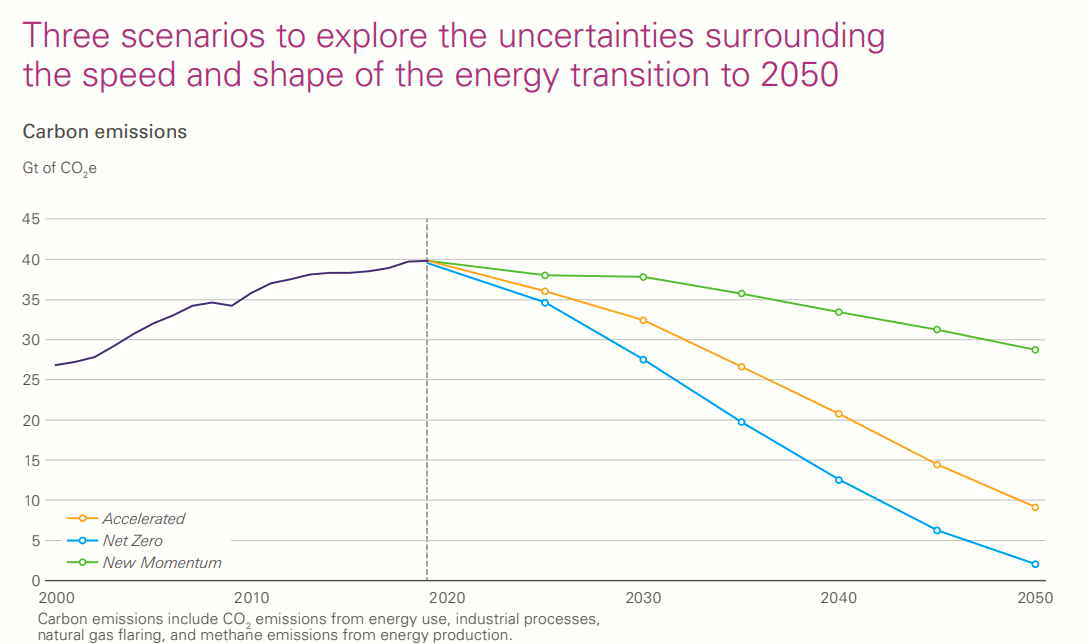
The statistics are part of the BP Energy Outlook 2023. The work of a “pro-climate” institute can be seen in the main scenarios thru 2050 that form the main purpose of the report. The reason for this bias is the least onerous scenario “New Momentum”, is new policy initiatives to be undertaken. One would reasonably expect the scenarios to include the current policy scenario, as laid out in the annual UNEP Gap Reports. The 2022 version predicts that emissions will not have peaked by 2030. So, although the Energy Outlook covers a wide range of policy scenarios, the “business as usual” is not included.
story tip


I checked Dr. Roger Pielke Jr’s site. He only takes comments from paying subscribers, so I comment it just here.
He use the data that is multiplied with 2.5 for non-fossil sources.
One can argue whether it is correct or not to use such a conversion factor between electricity and fossil energy, but at least you must be consistent, and you should inform about it.
When he calculates how many windmills or nuclear reactors we need to build to replace all fossil souces he forget the multiplication factor.
His article is not very consistent then.
/Jan
Like most people (other than Willis) Dr. Pielke, Jr. appears to not know that he was siting sources that did not make plain their data was adjusted arbitrarily. Ugly stuff to support an ideological position (not facts) on their part.
Willis
DO you have any idea how the “biomass” used is estimated? If so do you think it is reasonably accurate?
Thanks
Thank you bringing some reality to the topic.
Sadly, many of the folks here in California believe headlines like this:
“California just hit 95% renewable energy. Will other states come along for the ride?”
https://www.latimes.com/environment/newsletter/2021-04-29/solar-power-water-canals-california-climate-change-boiling-point
The magnitude of the lies propagated by the progressives is truly outrageous.
Even their lies are lies. Here’s the graphic:
Even my Mark I eyeball can see that at the peak, renewables were providing about 18,000 MW and gas was providing about 4,000. That’s only 82%, not the 95% they claim.
w.
That was on a mild, sunny spring day and you can still see the damage caused by solar generation. Ramping gas is expensive and import and export markets are unreliable in the long term.
Summer peaks cause unavoidable damage to the electric power system through the dominance of solar; see the Duck Curve issue writeups. The State regulators are warning of the likelihood of blackouts this summer.
Curious about the negative import (export) how much was California PAYING adjacent states to TAKE our surplus ruinable generation?
Willis,
“The explanation from BP about the “input-equivalent” method used to make nuclear and everything else but fossil fuels look bigger than they are.”
The distinction between the primary input energy and secondary output energy, usually electricity, is old. I have the Statistical Review workbooks back to 2003, when there was no solar or wind electricity to speak of, and it is used in all of them.
The primary input energy in a hydroelectric plant or nuclear power plant is larger than the output electricity generated, but it is not known, in contrast to the situation in a coal power plant, where the heat content of the coal is known. There are times when one wants to emphasize the electricity outputs and there are times when one wants to emphasize the energy inputs. The BP approach of using a uniform conversion factor is a common convention and it has the advantage of indicating how much coal a nuclear plant or hydroelectric plant would displace.
There are similar conversion issues that arise in comparing electric heat pumps with gas furnaces and electric vehicles with gasoline powered cars.
This is not a controversial concept among people who write about energy, regardless of their perspective on climate or fossil fuel supplies.
Dave, I know the input-substitution method has been around for a while. Inter alia, it says so in the BP methodology I quoted in the head post.
And I know it has uses.
However, its main use seems to be to mislead people as to how well non-fossil sources are coming along. Sure, if you multiply them all by 2.5 it looks great … but that’s not real energy. It’s imaginary energy.
It’s also bogus because it ignores the fact that the thermal efficiency of a nuclear power plant is no greater than that of a fossil power plant … so why is one artificially increased because of thermal efficiency and not the other?
Next, it’s bogus because solar and wind sources do not “displace” fossil fuels. We still need the fossil fuel generators as running backup, and inefficient running backup at that.
Finally, it’s bogus because it only applies to electricity, but it’s used all the time to compare to the total energy used for industry, mining, ships, airplanes, and the like.
In short, it’s far too deceptive to be given to the general public without a HUGE sign that says “CAUTION: IMAGINARY ENERGY AHEAD!!”
Regards,
w.
Willis,
“CAUTION: IMAGINARY ENERGY AHEAD!!”
Imaginary is too strong a word for me. Solar panels and wind turbines have conversion efficiencies that are not too different from a steam plant. We are just not metering the inputs. In a nuclear power plant, similarly, the input energy (again, un-metered) would be comparable to the heat content of the coal used in a competing power plant. Hydro is in a different efficiency league altogether.
The late David MacKay, in his book “Sustainable Energy,” followed your philosophy. But, in doing so, he realized that he had to discuss the conversion issues, and he did. Switching from a natural gas furnace to an electric heat pump reduces the home energy consumption but the natural gas consumption at the power plant rises comparably.
I support your conclusion that the alternatives share of world energy production is not growing fast enough to reduce fossil fuel production. There is a related issue that the electricity share, where alternatives are necessarily concentrated, is not growing fast enough to reduce the non-electricity energy production where fossil fuels are concentrated.
Even the IEA, whilst cheer leading for unreliables, acknowledges
“From 80% today -a level consistent for decades – fossil fuels fall to 75% by 2030 and just over 60% by 2050” (IEA World Energy Outlook 2022)
By the way the just published ‘Statistical Review of World Energy 2023’ (formerly collated by BP now by the Energy Institute) says fossil fuels provide 82% of primary energy.
I just thought I’d chime in to say ‘arrgh’, as in ‘arrgh, not another deceptive or misleading statistics practice that I wasn’t even aware of”.
One fact of life that I’ve long been aware of, but which I sometimes find surprisingly difficult to communicate to people, is the fact that thermal based electrical generators, (i.e., all fossil fueled and nuclear generators) have a very limited energy conversion efficiency (an efficiency which is thermodynamically set by the limits of practical furnace temperature vs available cooling temperature). As some indication of the efficiency possible, say, if you just look up “Steam-electric power station” on Wikipedia, they give a very broad range of 33% to 48% possible efficiency. However the upper number there is very unlikely for any really practical or economical power station. So, as you indicate, 40 percent is about the practical limit of efficiency for a thermal station boiling water to generate power from steam, meaning that you have to put *in* 2.5 times the energy that you expect to get *out* of a generating station. Now, line losses in delivering electric power to you or me are sure to cut the overall delivery efficiency to something *less* than 40 percent, but, never mind. Just try explaining to someone that that 60 percent (or more) of ‘burned’ heat has to just go to waste in the environment — I mean, just try to explain that sometimes, why we only ever get to use 40 percent of the heat produced by either burning or ‘nuking’ atoms from one form to another!
One place this comes up is in discussing the actual efficiency of electric vehicles, which lots of people naively assume are more energy efficient than regular internal combustion vehicles. If you point out that the scalable energy on the grid almost always comes from burning fossil fuels, giving EV’s only 40 percent efficiency to *start* (an efficiency which then must be reduced further by whatever factor is relevant for the EV drive train), why then, you may have an argument on your hands, despite the fact that this is almost always literally true
(as a possible exception, if you are charging during off peak hours and you happen to live near a hydro dam, say, that might work — also, if you live in a grid system that draws power from a nuclear station, then maybe the 40 percent limit isn’t so directly relevant there either). For purposes of promoting EV’s, you’d perhaps be happy to just call the waste heat from a nuclear reactor ‘free’, in the sense that we’re not getting CO2 emissions from that.
In any case, when producing charts of electric energy production, isn’t it obvious that waste heat to the environment, at the power station level at least, does not constitute actual energy production? There is nothing useful being thrown out there, nothing you can use to charge your car or do anything else with?
I don’t care if it’s Pielke, or anyone else that is pounding the energy stats this way, multiplying nuclear production by a 2.5x waste heat factor is clearly deceptive, dishonest, incompetent, etc.
Willis, Dr. Pielke, Jr.’s graph says “consumption.” I assume that is an error on the part of the source.
But think of all the jobs the $5 trillion created; all the scientists spared from a life living on the dole…
Industries have to be invented to keep The System turning over…
EVs ! Do you even think about their small, limited future ? But the jobs created !!
The Devil finds work (Revolution) for idle hands, and we cant allow that !!
The real purpose of the “Green Energy” spending is to create cash flow that enables vast quantities of siphoning off monies into the pockets of politicians.
_______________________________________
“We know that they are lying, they know that they are lying,
they even know that we know they are lying, we also know
that they know we know they are lying too, they of course
know that we certainly know they know we know they are
lying too as well, yet they still lie.” Aleksandr Solzhenitsyn
I’m confused. I no longer know if I’m lying or if I’m not supposed to.
Willis,
I also noticed the input equivalent thing. It isn’t quite as bad as you made out. The exaggeration is about twofold. Not all renewables are used for electricity generation, so things like biofuels for cars haven’t been divided by 0.407 (the assumed efficiency of an average power generator) You can take the electrical energy outputs of nuclear, hydro, etc, add them together, divide by 0.407 and subtract from the total input equivalent energy from all non-fossil sources and assume the remainder left over was not used for electricity generation. When you convert back to actual energy, leave the remainder unchanged but multiply nuclear, hydro etc by 0.407.
What I found most interesting was looking at the UK and Germany, with their abundance of ‘cheap’ renewables. Sure, more of the electricity is from renewables, but the percentage of energy used as electricity was no different from the global average in the case of Germany and is actually lower in the UK. If it made economic sense to switch to electricity, this would have been done ages ago, since both countries have had extensive networks for the better part of a century. Still, it’s nice to see that the input equivalent energy from biofuels has skyrocketed since the last assessment;
Thank you Willis, always great perspectives and visualizations!
(I use “Perspectives” as helping create understanding of an issue by being accessible to customers, taxpayers, citizens, legislators, regulators..).
Academic criticism should be limited to generally right or wrong direction. No precision or absolutes needed. Wasted words and space.
In that regard, the best chart is the “2023 Investment vs consumption“! It
hits the customer and legislator right in the heart of our national priorities:
1. The cost to customers of what the policies create–both as users and taxpayers.
2. Priorites differences of taxpayers and policy makers.
Voters have to choose.
Another perspective that needs to be shown in a chart all the time.. the generator Capacity available vs Customer Demand at all the peak times for both the PJM-type wide area source/grid and the local distribution peaks.
A more refined chart would add the cost of facilities needed for energy availability, reliability, and stability at transmission and distribution locations…with and without solar, wind.
Necessary modifications in switching, communications, regulation are likely NOT included in the investment or operations costs, except as cost/kWhr costs to customer.
And let’s not forget that wind and solar are not truly fossil-fuel-free energy sources. Take away the fossils fuels for exploration, mining, refining, manufacturing, transporting, installing, maintaining, decommissioning and as feed stocks for all the fossil-fuels derived materials and there would be this much wind and solar electrical generation: zero kwh.
Hello Willis
Just to say I have not been able to comment, for quite a while, as the WUWT page rejected me telling me there was a Viejecita already. And asking me to chose another name and register anew. I have asked for my youngest son’s help, and he has changed me from Safari to Firefox and, at least for this afternoon I am able to say I never miss one of your papers and just love them. Even when I have trouble understanding all the charts. So
¡ Un abrazo !
¡Ay, Jovencita, estoy muy feliz de verte otra vez! Abrazos a ti tambien.
w.
Fantastic! Thank you for this!
“You can’t use it to heat your house or run a factory.”
A great application for electricity. Electricity is very good at doing work with machines.
Replacing fossil fuels is easy. What Willis is saying is he does not know how.
I do know how but I also do not have a problem with fossil fuels.
In our industrial age our needs for food, clean water, and shelter leaving time for the idle rich to invent problems.
Coal is bad because …… Natural gas is bad because ……. Factory farms are bad because ……
Being retired from the nuclear industry I have heard all the invented reasons why nuclear is bad. This not to say bad things have not happened.
No matter what you do somebody is against it because they, like Willis, do not know how to do it.
It is like this, 30 years ago I was anti-coal. But that part of the energy industry improved how they did things.
Kit, without providing a single scrap of evidence, you claim that:
Hogwash. Replacing fossil fuels is NOT easy. Try flying an airplane from LA to Sydney without fossil fuels. Try running a Panamax container ship from LA to Sydney without fossil fuels.
If it were “easy”, as you falsely claim, it would have been done long ago. But to date, we have no market-ready substitute for fossil fuels, and in a number of cases, no possible substitute, market-ready or not.
w.
Interesting perspective. Now post that comment again without touching a device that uses fossil fuels.
I will wait patiently.
Why does the “input-equivalent” method lump all fossil fuel together at 38%, without a similar correction for other types of fuel or within different types of fossil fuel
Then there are storage and transmission losses. Different efficiencies for coal, oil gas and the technology available to extract the energy.
In the end, it is apples to apples energy consumption as measured in units of energy that matters. Everything else is politics.
Good question, Ferd. Modern combined-cycle gas plants are 60% efficient, but nooo, that doesn’t fit the desired message …
w.
Your graph is great, but the bottom three lines shouldn’t be labelled ‘consumption‘, but ‘production‘. Just my two cents worth.
Mr. Eschenbach:
First of all: I love what you do on Wuwt.
Second, in your piece “The Myth of Replacing Fossil Fuels” you advise us: “if you’d prefer to deal with real energy numbers rather than imaginary “input-equivalent” figures, look for the word “Consumption” in the description of the data”. Well below is an EIA link that is billed as energy consumption ata that claims us energy consumption is 21% renewable.
How are they mistaken? How would you rebut/expose their deception?
https://www.eia.gov/todayinenergy/detail.php?id=56980
Once again, thank you for your critical contribution to sanity.
Bill Reeves
Yeah, they’re not the only one. I’m gonna take that part out of the head post, because I find people calling it both “consumption” and “generation”.
In any case, they’re using the “input-equivalent” dodge. Here are the real values:
Note that per their graph there’s another ~1% or so of wood energy, but I can’t find figures on that.
w.
PS—As confirmation that they’re multiplying the non-fossil sources by 2.5, if you increase 9.6% of a total by multiplying it by 2.5, it becomes 21% of the new larger total … and 21% is the number that they give for the non-fossil percentage.
gas plants are 60% efficient
==========
Hi Willis
We could probably do the same with the ICE. Something like 90% of the waste heat generated in an ICE goes out the tailpipe. Otherwise cars would need huge radiators.
Like a 60% efficiency gas plant the first stage turbine is something like 35% efficient, similar to current ICE technology.
It is the waste heat from the first stage that drives the second stage steam engine that adds the additional 25% to bring the 2 stage generator up to 60%.
Adding a steam engine or similar to an ICE could possibly add another 25% for a lot less cost and weight than a battery.
The point being that the current ICE still has room to almost double fuel efficiency and any such breakthru would cast serious doubts on current EV technology.
The statistics are part of the BP Energy Outlook 2023. The work of a “pro-climate” institute can be seen in the main scenarios thru 2050 that form the main purpose of the report. The reason for this bias is the least onerous scenario “New Momentum”, is new policy initiatives to be undertaken. One would reasonably expect the scenarios to include the current policy scenario, as laid out in the annual UNEP Gap Reports. The 2022 version predicts that emissions will not have peaked by 2030. So, although the Energy Outlook covers a wide range of policy scenarios, the “business as usual” is not included.
story tip