Operation Hymn-Sheet: identifying points on which skeptics agree
By Christopher Monckton of Brenchley
The restless and eternal search for objective scientific truth is of its essence skeptical, not consensual (e.g., Aristotle, Refutations of the Sophists; Popper: Logik der Forschung). While the totalitarians responsible for originating and maintaining the climate-change scam and the consequent targeted economic destruction of the hated West all parrot the same Party Line, which they rebrand as an imagined “consensus” of supposed “experts”, skeptics do not usually sing from the same hymn-sheet, for we are no less skeptical of our own arguments than of the totalitarians’ arguments.
Welcome, then, to Operation Hymn-Sheet. The purpose is to identify a series of perhaps one or two dozen powerful and irrefutable climatological, economic or pragmatic propositions on which we can all or nearly all agree, so that in our interactions with governments hitherto deceived by the totalitarians we can speak as far as possible with one voice.

The following are the suggested criteria for including a proposition in our Hymn-Sheet:
First, each proposition should be of sufficient importance that, if it were generally known about and understood, it would materially influence the climate-change debate.
Secondly, each proposition should be clear enough and simple enough to be expressed, explained and justified in not more than 100 words. Complex theories have no place here.
Thirdly, for the sake of argument each proposition should be based on mainstream, midrange data and generally-accepted methods as far as possible.
Fourthly, though each proposition should be simple and clear, it should be sufficiently rigorous to be unimpugnable by any legitimate method.
This is where you come in, gentle reader. In comments, please put forward, explain and justify each proposition that should, in your opinion, stand part of Operation Hymn-Sheet.
Once the Hymn-Sheet has been compiled, we can all draw upon it in briefing our governments, so that they will no longer hear only the hysterical, endlessly-chanted mantras of the totalitarian enemies of the West and the host of useful idiots they have fooled.
Here are some sample propositions for the Hymn-Sheet.
If it’s consensus it’s not science: if it’s science it’s not consensus
The imagined “consensus” that recent warming is chiefly anthropogenic was fabricated. Police investigated and concluded that the report by Cook et al. (2013) of a 97.1% consensus constituted a “deception”. In reality, Cook had marked only 0.5% of the 12,000 papers on his list as having stated that recent warming was chiefly anthropogenic. In any event, his consensus proposition does not say global warming is dangerous. Moreover, argument from consensus conflates the two shop-worn logical fallacies of mere headcount and of appeal to the imagined authority of supposed experts. Argument from consensus has no place in science.
Wind and solar power cannot get us anywhere near net zero
Unreliables are the currently-favored method of trying to reach net zero emissions. However, weather-dependent renewables must be backed up at all times by thermal generation capable of supplying the entire demand on a grid. Wind and solar are, therefore, a deadweight capital and operating cost. They also increase thermal-generation operating cost because spinning-reserve backup is inefficient. In any event, installing nameplate capacity of wind and solar power in excess of mean hourly grid demand cannot further reduce emissions: yet most Western nations’ installed renewables’ capacity already exceeds the demand limit.
Warming since 1990 is less than half the then midrange prediction
In 1990 IPCC presented four emissions scenarios. Scenario B predicted that the effect of annual emissions would remain constant at 1990 levels until 2025. Scenarios C-D predicted the effect would decline. Instead, emissions have increased by more than half since 1990. Thus Scenario A, the business-as-usual scenario, has proven closest to reality. It predicted 0.3 C/decade midrange warming over the 21st century, but only 0.13 C/decade, or 45% of the midrange prediction, has been measured in the 33 years since 1990.
Even worldwide net zero would cut 2050 temperature by less than 0.1 C
Our influence on temperature has increased at 1/30th unit/year since 1990, with another 0.9 units by 2050 on business as usual. If all nations went straight to net zero by 2050, 0.45 units would thus be prevented. Unit warming is the ratio 0.46 C per unit of 1.8 C midrange transient 21st-century doubled-CO2 warming to 3.93 units midrange doubled-CO2 forcing. Finally, adjust for the ratio 0.45 C/C of 0.136 K/decade real-world warming to the predicted 0.3 K/decade warming since 1990. Then worldwide net zero would abate <0.463 C: that is, less than 0.1 C.
Individual nations would contribute infinitesimally to cutting warming
Since even worldwide net zero would reduce global warming by less than 1/10 C, individual regions’ or nations’ contributions to that minuscule reduction in global temperature would be infinitesimal. Chinese net zero would prevent only 1/30 C warming; Western net zero would also prevent only 1/30 C; US net zero would prevent 1/70 C; UK net zero would prevent 1/1000 C; Chilean net zero would prevent 1/10,000 C.
Each $1 billion spent would prevent one ten-millionth C warming
The UK’s grid authority estimates that net-zeroing the grid will, on its own, cost $3.6 trillion. Electricity generation accounts for only a fifth of total UK generation. On this basis, UK net zero would cost $18 trillion and global net zero would cost $1800 trillion. McKinsey Consulting reckon the capital cost of global net zero at $275 trillion. Opex, at least twice capex, would raise the total cost to $900 trillion. Using the lesser estimate, each $1 billion spent on emissions abatement would prevent future warming of only one ten-millionth C – the worst value for money in history.
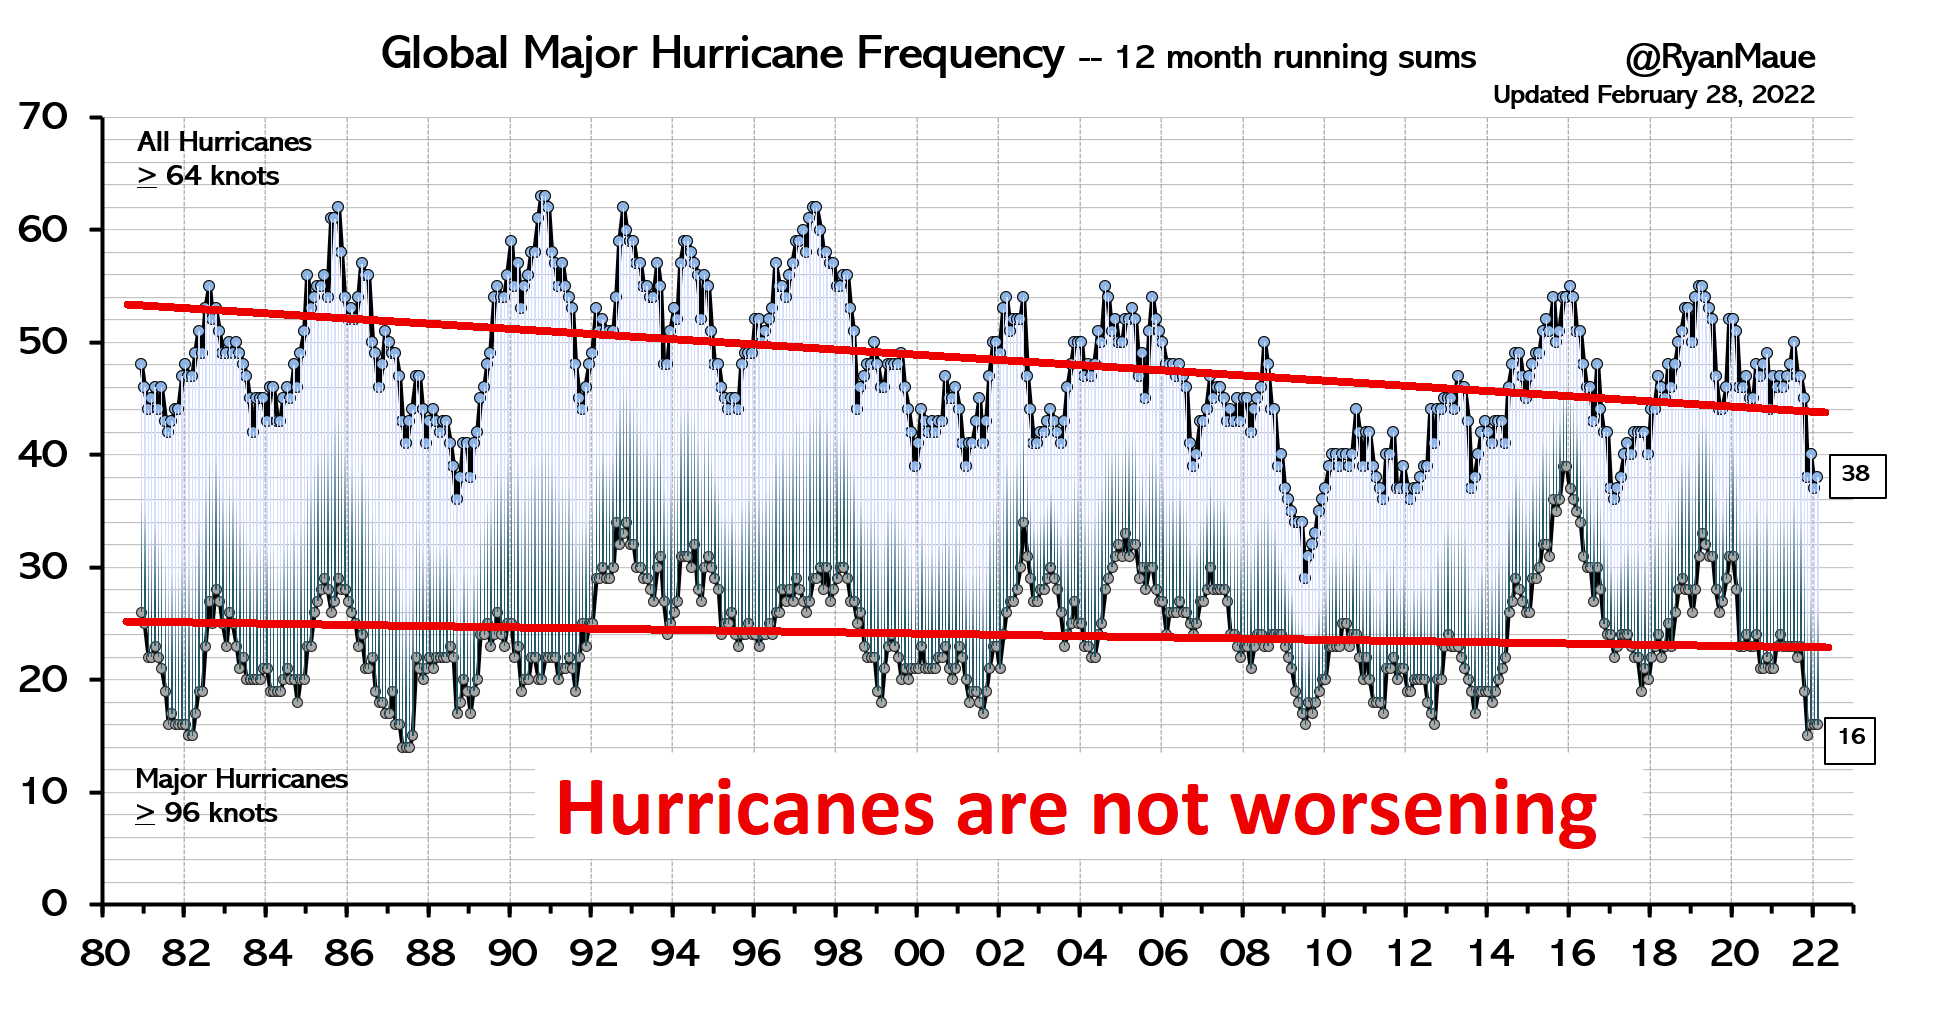
Weather-related disasters are not increasing as predicted
Hurricanes, tropical cyclones, tropical storms and tornadoes show no trend in combined frequency, intensity or duration. The frequency and extent of forest fires and the frequency of record-breaking temperatures have declined since they peaked in the 1930s. The global land area under drought has decreased for several decades. Floods have not increased in frequency, intensity or duration. Global rainfall has risen beneficially: the world’s longest record (UK Met Office), shows an uptrend of just 2 inches in 250 years. Sea level is rising at only 4 to 8 inches/century.
More CO2 and warmer weather have benefits
Benefits of emitting CO2 and warming the planet include recent planetary greening by >15% and increases in global crop yields by CO2 fertilization; a 96% decline over a century in weather-related deaths; and a reduction in deaths from cold exceeding any increase in deaths from heat by an order of magnitude, both globally and in each region. In Africa, there are 40 times more deaths from cold than deaths from heat. Such benefits are widely unreported.
Exaggerated predictions arose from an error of physics
Climate feedbacks respond not only to 8 K natural and 1 K anthropogenic direct greenhouse warming but also to the dominant 260 K emission temperature. In 1850, final warming per 1 K direct warming was not 28 / 8 = 3.5 K/K but (260 + 28) / (260 + 8) < 1.1 K/K. But only a 10% increase in feedback strength since 1850 would hike 21st-century warming from 1.3 K to 3 K, since the difference between feedback strengths for 2 K and 5 K final warming is only 0.03 units per degree. Thus, feedback analysis cannot reliably predict warming.
Observational methods suggest only 1.4 C warming this century
Climate scientists had thought they could omit the 260 K emission temperature in their feedback calculations because in control theory the base signal is usually omitted because it is tiny and the feedback-response signal is orders of magnitude larger. In climate, though, it is the other way about: the 260 K base signal exceeds the feedback-response signal by orders of magnitude. That is why feedback analysis cannot reliably predict warming. Yet IPCC (2021) mentions “feedback” >2500 times. Warming since 1990 is only 1.4 C/century equivalent. The energy-budget method, not dependent on feedback analysis, shows a similar value.
Models’ predictions of global warming are purely speculative
An elementary error of statistics in the interpretation of climate models’ outputs led climatologists to assume that dangerous warming was very likely when, on correction, all predictions based on the outputs of models are proven to be no better than guesswork. Climate scientists had not realized that propagation of uncertainty in models running hourly time-steps over decades implies that any global-warming prediction falling between –12 and +12 C (as all do) is statistically insignificant and thus speculative. The paper by Dr Patrick Frank establishing this fact was published in 2019 and has not been refuted in any learned journal since.
Selectively targeting the West increases global emissions
Climate treaties are selectively targeted against the West on the specious pretext of purported “climate debt”. Therefore, manufacturing – particularly if it is energy-intensive – is being priced out to chiefly Communist-led nations that are greatly expanding inexpensive and affordable coal-fired generation. The unintended consequence of the West’s economic hara-kiri is to transfer manufacturing to nations with far higher emissions per unit of production than the West, increasing global emissions – precisely the opposite of what was intended.
.o0O0o.
Now, gentle reader, it is your turn. What are the main points that every schoolboy would know about global warming if it were not for the outright censorship now inflicted upon nearly all media by the hate-filled, totalitarian far Left?
And have courage! The very fact that the Left now find it essential to spend so much time and effort on silencing all debate on climate (their number one topic) and on a growing range of other topics shows that the Left themselves know that if free speech were once again permitted they would lose the debate, and lose it comprehensively.
Recall that the execution by Robespierre of a dozen pious, habited nuns, who chanted hymns of praise and joy as the guillotine fell and the normally noisy crowd of sans-culottes stood utterly silent, led to the execution of Robespierre himself scarcely two weeks later, ending the Reign of Terror. Perhaps, then, the climate nonsense – and, as the above instances show, it is obvious, arrant nonsense – is the last gasp of totalitarianism. Perhaps, as it dies, so will die with it the notion that free speech should be curtailed so that Communism may continue to advance, slaughter and destroy. Forsan et haec olim meminisse iuvabit!
The lead picture seems to be enthusiastic about wind power.
A warning of what net zero will take some of us back to. (Others will simply perish.)
Maybe, we should start naming the net-zero acolytes as the troglodytes
I like the term – “Useful Idiots” for the climate alarmists
There is nothing more exhilarating than working the wind in a sail boat.
As close to communing with nature as one can get.
Watching wind turbines whoosh their way to inefficient, unaffordable electricity generation and raptor mangling – not so much.
The Clippers were impressive. Their time ended in the 1860s. What fun it will be to revert to those wonderful years.
Yes Pamir which operated commercially till 1949
Pamir length length 114.5 m 3000tonnes, average speed 9knots, crew abt 80
Maersk E Class length 399.2 m, 55000 tonnes, crew 14 cruising speed 16knots
Probably explains a great deal
How well does that boat work when it is in the doldrums ?
Or do they have ICE /fossil fuel back-up ?
They are beautiful. But the death rate was appalling. Fishing, for example, a dangerous occupation at the best of times. But under sail, the Gloucester (Mass) Helsman memorial is to more than 10,000 who lost their lives at sea.
There is an account by Eric Newby of going round Cape Horn in a big steel square rigger, the so-called Grain Races. They first renewed all the rigging and checked all the sails, patched and replaced as needed. The Captain then had a small shelter erected on deck by the steering wheel which served as his shelter day and night for as long as they were in the danger area, never going below. It was possible, and happened, for an entire watch to be swept overboard. There is an account of how the ship almost got away from them going over the crest of a wave, the captain and the helmsman and another crew member struggling right at the limit of their physical strength to hold the rudder to stop the ship from broaching (turning side on, and getting rolled by the immense waves).
And imagine, the way you reefed those sails was by sending the crew up the masts. They then made their way out on the yards with their feet on a thick rope and holding on as best they could grappled with those huge canvases in the high wind. If you fell, that was it, even if you fell into the sea, there was no turning back.
The wind was free. At what cost?
Perhaps you should volunteer to work as a deckhand on a clipper. Changing sails in a storm is fun, I’ve heard.
That was more than a century ago, Nick.
Where the scientific standards of the AGW superstition continue to languish.
It is marginally better than rowing
“The lead picture seems to be enthusiastic about wind power.”
Until something better came along.
(Burning stuff for power.)
Modern-day sailing ships have diesel engines for when the wind doesn’t blow.
They easily transported goods for half a billion people. Let’s go back to that?
At least seven sheets to the wind!
I would point out that the warming since 1850 is within the error range of household thermometers.
Next, I would note the Little Ice Age was an era of plague, famine, and war. It is very unclear if the current temperature is as warm as it was before the LIA, as in some areas, like Greenland, it clearly is not.
I have three short 100-word summaries of studies published at http://www.bomwatch.com.au that show nothing is happening.
From: https://www.bomwatch.com.au/wp-content/uploads/2023/03/HallsCreekbackstory_FINAL-18-Mar-2023.pdf:
The climate at Halls Creek, Western Australia, and that of the 23 sites used to homogenise maximum temperature at Halls Creek (Tmax), has not changed or warmed due to CO2 coalmining, electricity generation or anything else. It is not possible for homogenisation to cool the past, without compromising the physically deterministic relationship with local rainfall. As goodness of fit is consistently less than raw Tmax ~ rainfall, and homogenised residuals embed step-changes that the process aimed to correct, homogenised data do not reflect the climate of Halls Creek and the wider east Kimberley Region.
From: https://www.bomwatch.com.au/bureau-of-meteorology/trends-in-sea-level-at-cooktown-great-barrier-reef/.
The claim that sea level is increasing rapidly in the northern sector of the Great Barrier Reef is not substantiated by mean sea level data for the tide gauge at Cooktown, Queensland, since January 1996, or time-series of aerial photographs. Dredging following Tropical Cyclone Justin in 1997, wind and heavy seas resulting from TC Ellie (30 January to 4 February 2009) and TC Hamish (4 to 11 March 2009), dredging in 2014 and refurbishment of the wharf in 2015 caused the tide gauge to settle 109 mm into the bed of the harbour thereby causing MSL to apparently increase.
From: https://www.bomwatch.com.au/bureau-of-meteorology/trends-in-sea-surface-temperature-at-townsville-great-barrier-reef/.
In November 1871 astronomers from Melbourne and Sydney sailed to Cape Sidmouth near the top of Cape York to observe the total eclipse of the sun. Sea surface temperature measured between Port Stephens and Cape Sidmouth, and on their return in December was not different to that derived from 27 AIMS datalogger datasets for those times. As solar radiation increases in summer, SST north of Latitude -13.5o is cooled by the monsoon and remains in the range of 29oC to 30oC. There is no evidence of warming or that the process has broken-down or is likely to break down in the future.
All the best,
Dr Bill Johnston
scientist@bomwatch.com.au
Dr Johnson’s points are all useful, and it may be that a separate section should be devoted to regional and local data, which are often very revealing in the manner he has described.
Johnston please!
b.
Mea culpa: my eyesight is not what it was and I am awaiting an operation.
“dredging in 2014 and refurbishment of the wharf in 2015 caused the tide gauge to settle 109 mm into the bed of the harbour thereby causing MSL to apparently increase.”
Some averaging techniques would smooth that step change across many years (and locations).
Thanks KevinM,
The most usual scenario is that people ignore processes generating the data, fit a trend line using Excel and don’t check for residual signals that indicate the ‘trend’ is actually spurious. I can think of no reasons that sea level should rise perceptively over a period of 30-years. Also they can’t rise at Cooktown, and not show evidence in aerial photographs on the coastal side of the headland.
I use a form of covariance analysis to fully explain the data, and with covariates and step-changes accounted for, I check for residual trend that could be due to something else.
For most tide-gauge datasets, metadata is almost totally lacking, so to link those problems I mentioned, I used general internet searches and aerial photographs.
(I also examined tide-gauge data for Townsville and found similar problems (https://www.bomwatch.com.au/bureau-of-meteorology/trends-in-sea-level-at-townsville-great-barrier-reef/)).
All the best,
Dr. Bill Johnston.
Mr Halla’s point about the warming since 1850 falling within the error range of a household heating thermostat is an excellent one, and worthy of inclusion.
As to his point about the medieval warm period, one of the simplest ways to demonstrate that the MWP was warmer than the present is to reconstruct sea-level rise over the past 1000 years. Sure enough, sea level was 8 inches higher in the MWP than today, and 8 inches lower in the Little Ice Age than today. That point should certainly be added to the list.
For reasons unconnected I looked up the average height of UK skeletons: there was a reduction in height after the Roman warm period which was corrected at the mediaeval warm period and then fell at the end of that, recovering slightly post Black Death when population levels fell dramatically, and then rising dramatically over the last 150 years as the little ice age ended and industrialisation improved nutrition levels.
Warm means better lives in the temperate latitudes.
Too many variables to attribute anything to anything else.
Not so. The evidence that warmer weather is better for life on Earth is substantial. It is no accident that 90% of the world’s living species thrive in the tropics and less than 1% at the Poles. Furthermore, repeated studies in the medico-scientific journals show that far more people die from cold than from heat in all regions of the world.
My oft-repeated refrain on this hymn is that expansion of wind and solar are the antithesis of net zero: either or both require an expansion of the use of “fossil fuels,” and cannot be accomplished without an increase in emissions.
DK,
yes in deed but to compound it the powers that be are adding more demand on the grid with evs and heat pumps.
DK is in part correct. However, if one were really concerned about emissions from coal, oil and gas combustion, one would replace such thermal stations with nuclear stations, as the French did half a century ago. In that event, though, there would be no need for wind and solar power at all, since at no greater cost the grid could be stabilized without any CO2 emissions other than those arising from the production of concrete for the nuclear stations.
Concrete needs heat . That doesn’t have to be carbon. It could be hot gas from a gas cooled reactor. Or electrical heat.
The heat produces almost pure carbon dioxide( CaCO3=>CaO +CO2).
Pure carbon dioxide is extremely valuable as a feedstock for organic synthesis. Electrolytically made hydrogen can be reacted with it to form water and basic hydrocarbon fuel.
Hydrogen and atmospheric nitrogen can be used to make ammonia – the basic feedstock of fertiliser and a big consumer of natural gas.
Cement as it sets absorbs carbon dioxide from the air.
It is amazing that in fact paths to a genuine net zero and zero fossil fuel usage exist, but none of them are being explored by governments. Only those that impose onerous burdens on their citizens and increase political control are
Monckton,
Thanks again, and you are indeed correct regarding the prohibitive costs of operation.
I am more focused on the 1-5 megaton consumption of fossil fuels as material for each land-sited wind turbine. USGS estimated in 2008 that the cost of finished (but not installed) materials at ~350 kilotons per 2 MW nameplate capacity for a single turbine’s life cycle. Besides the cost of construction, also not included in that estimate is the cost of fuels for infrastructure (access, cabling, water pumping or storage), site development, and excavation. Nor did USGS count on end-of-service-life demolition and disposal fuel and materials costs, which will begin to add up nicely over the next several years.
Wind and solar facility production is somehow exempt from the carbon footprint accounting levied on the rest of us by the wind and solar generation industries.
Our hymn then is sung in a round, or to the old vaudeville yankee punchline “ya cahn’t git theyah from heyah.” The carbon cost of decarbonizing is more fossil fuels pumped, refined, and expended than we’ve ever used before. at a higher price. The Pollock production capacity-to-load limit for unreliables nicely defines the point of diminishing returns for their deployment.
To misquote one of your former colleagues, it will all be fine until they run out of our money.
We are living in The Ice Age
For the last several million years, the climate on earth has been dominated by glaciers. Miles thick glaciers have covered earth as far south as New York, Chicago, Minneapolis, Ireland, Moscow and more. A number of brief ‘Interglacials’ (time between glaciers), like the one we are living in now, each lasting about 20,000 years or less, have been present only about 20% of these millions of years. The present Interglacial too, is likely to end, as it has before. Human civilization did not flourish until the 3 or 4 degrees C global warming in this latest interglacial. Another 1 or 2 can do no harm. It might even delay the return of ice.
The modern interglacial is now terminating. As the surface of the oceans in the NH warm up to reach maximum surface temperature in August or early September they put more moisture into the atmosphere ahead of land north of 40N reaching freezing temperature. That results in more snowfall.
Only Greenland and Iceland are gaining more ice extent but the rest of the NH land mass will follow. The process of ice accumulation has only just begun. THe permafrost on the large land masses is still advancing northward but they will change within 200 years.
Snowfall records will be a feature of weather reporting for the next 10,000 years.
The climate modellers are just beginning to realise that there is more snowfall. They are probably 30 years behind recognising that the modern interglacial is terminating; repeating what has happened 4 times in the last 400k years in the same orbital circumstances as now exists.
“That results in more snowfall.“
https://ktla.com/news/local-news/mammoth-mountain-sees-record-snowfall-after-series-of-atmospheric-rivers/
. . . and the weather cooperates.
Mr Johnson’s point is an excellent one. Many people are surprised that we are still more in an ice age than in an interglacial warm period.
A few years ago, on WUWT I was corrected by using the term Interglacial when talking about Glacial Periods and Hothouse Periods. Yes, an Interglacial period is in fact saying that we are living within a warming epoch called the Holocene Interglacial of the latest Glacial Maximum, because the temperature mean between Glacial Maximum averages and Hothouse Maximum averages is still below the historical mean of 17C as shown in the graph provided that is widely accepted by many. Glacial Maximums are actually anomalies of cold periods between Hothouse Maximum Periods that last much longer at higher temperatures that are closer to what the global average of earth temperature would be by duration in each Hothouse Period in comparison to those of Glaciers Maximum Periods. For decades graphs showed the mean temperature of the Holocene as 15C until lately it is shown as 0.0C on graphs and the Holocene Climate Optimum as the hottest climate never got to 17C or 3C above 0.0C in later graphs.
To build a chart starting back before written language, one must accept some data as correct and toss out other data as incorrect based on ?
There is actually very little known about earth’s history and the further back you go, the more we don’t know and can only speculate best guestimates from fossils, sedimentary rocks and seabed’s, geology and ice cores studies. This has always been the problem with those advocating making political changes to somehow do things to prevent “Global Warming” or “Climate Change” based upon ignorance of what did or didn’t occur in the past and only starting their predictions of doom and gloom from the mid 1800s when there are written history going back thousands of years telling what it was like. The scholars of the scientific communities of our past used to believe things proven untrue now, the “Flat Earthers.” or the “Earth is hollow” or “the sun revolves around the earth” but some people still believe in those. There are a lot of things that are accepted science that have a lot of evidence that doesn’t support it, that different studies from different sources were collected to create the graph with the best guesstimates available for what the temperature probably was, and the carbon dioxide probably was, is how science works.
2nd posted comment.
The Holocene Interglacial epoch graph shows that the HCO being the hottest and the LIA as the coldest gives a down-trending in climates suggesting the earth is more likely to cool than get warmer in the future.
https://tse4.mm.bing.net/th?id=OIP.JOT1FIdXfA-igpivnEFSbwAAAA&pid=Api&P=0
Here are 14 nominees, mostly from my page here:
https://sealevel.info/learnmore.html
1-3 & 7-19. CO2 emissions, from burning fossil fuels and making concrete, increase the amount of CO2 in the atmosphere, which has a slight warming effect.
● https://sealevel.info/learnmore.html?0=physics#intros
12-16. The amount of additional warming which is in prospect from anthropogenic GHG emissions is modest and benign. In fact, it is so slight that it is unnoticeable under most circumstances.
● https://sealevel.info/learnmore.html?0=temperature#temperature
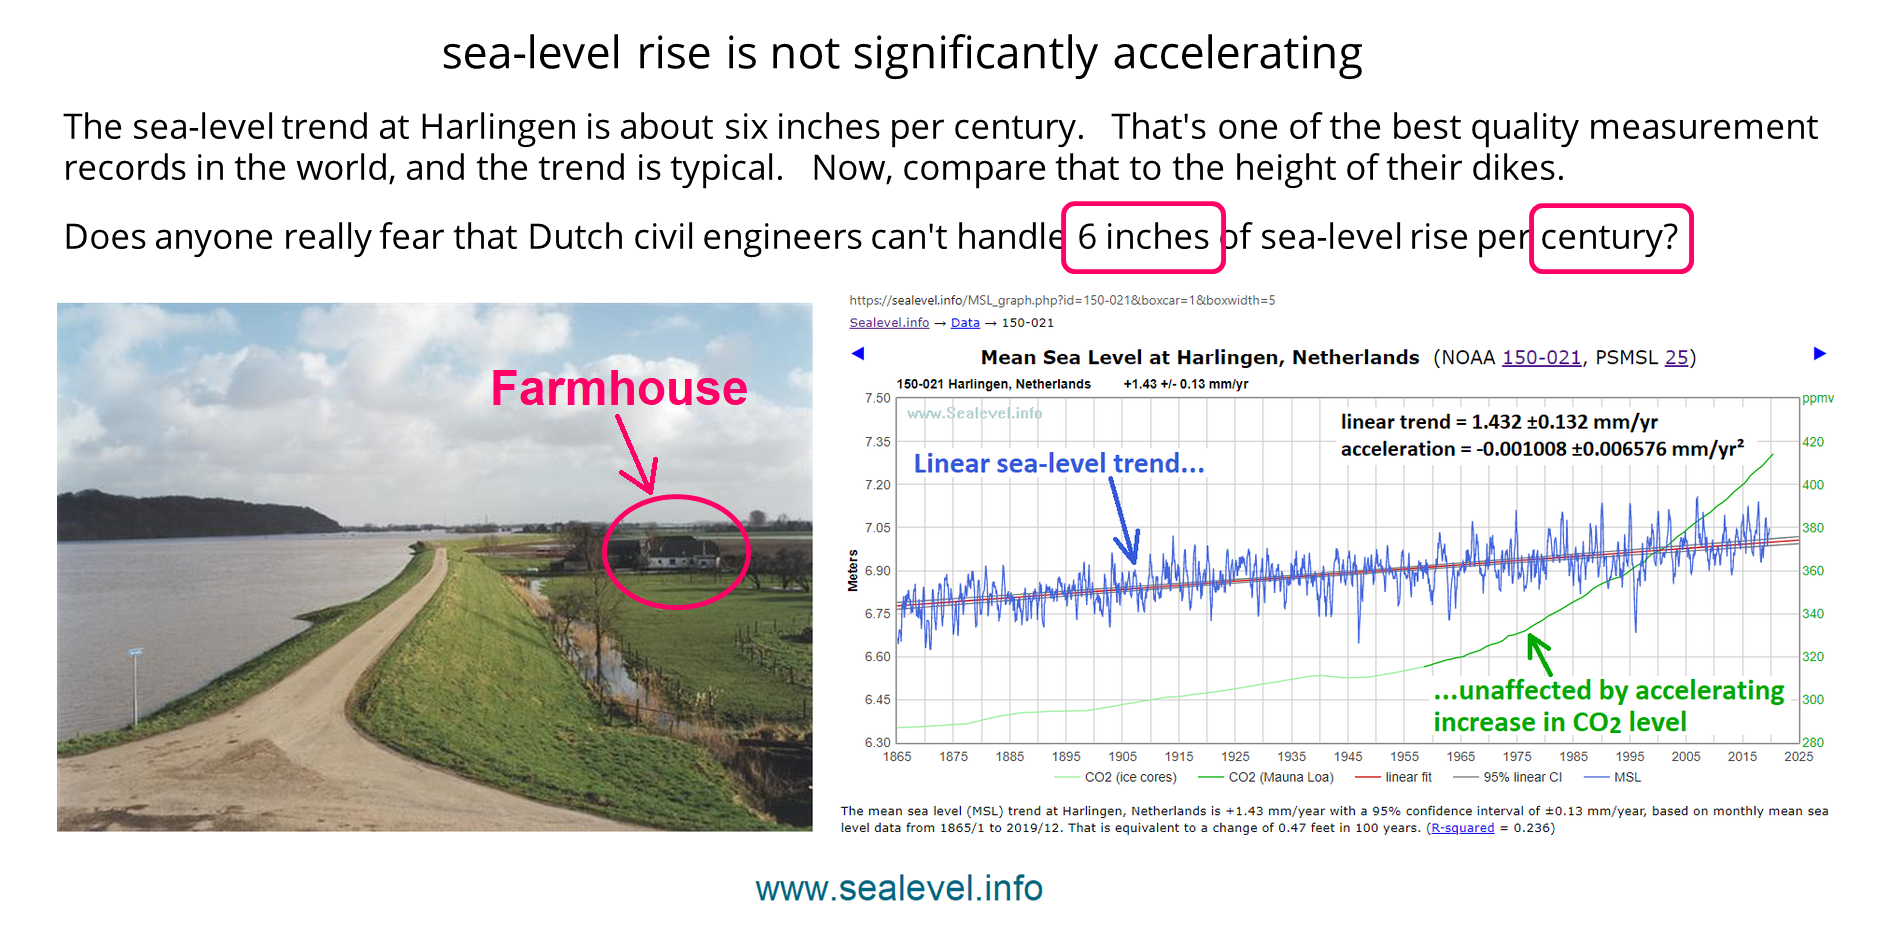
17-19. Sea-level rise is not accelerating significantly — certainly not enough to be worrisome.
● https://sealevel.info/learnmore.html?0=sealevel#sealevel
● https://twitter.com/ncdave4life/status/1643731917311819782
(And blaming things which are not significantly worsening on “change” is irrational.)
20-22. Hurricanes, nor’easters & tropical cyclones are not worsening, either.
● https://sealevel.info/learnmore.html?0=hurricanes#hurricanes
(And blaming things which are not worsening on “change” is irrational.)
23-25. Tornadoes are not worsening.
● https://sealevel.info/learnmore.html?0=tornadoes#tornadoes
(And blaming things which are not worsening on “change” is irrational.)
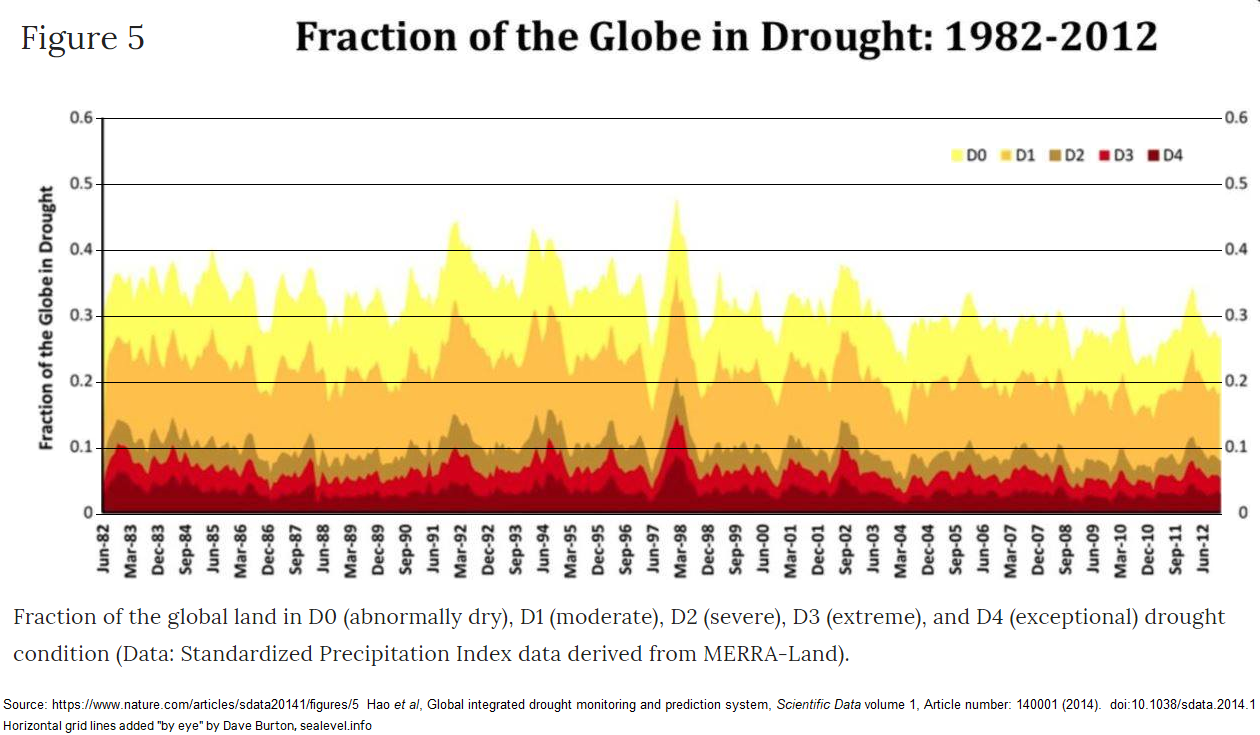
26-27. Droughts are not worsening, and rising CO2 levels help mitigate drought impacts, by making plants more water-efficient and drought-resistant.
● https://sealevel.info/learnmore.html?0=droughts#droughts
● https://twitter.com/ncdave4life/status/1567921739941789699
28-30. Climate change is not worsening forest fires.
● https://sealevel.info/learnmore.html?0=fires#fires
(And blaming things which are not worsening on “change” is irrational.)
31. Current temperatures are not unprecedented.
● https://sealevel.info/learnmore.html?0=temperatures#temperatures
32. Recent warming has not been unusually or worrisomely rapid. Past natural warming episodes have been at least an order of magnitude more rapid than recent warming. Fortunately, those very large, abrupt temperature changes apparently did not cause mass extinctions. Mankind, polar bears, pikas, coral, and nearly every other existing species of animal and plant all survived those sharp climate changes. That suggests we needn’t fear that the current (comparatively slight) warming trend could be catastrophic for them.
● https://sealevel.info/learnmore.html?0=rateofwarming#rateofwarming
34. The claimed “97% consensus” of scientists for climate alarmism is a prime example of the “Big Lie.” Surveys of scientists show that the only consensus about climate change is that emissions of so-called “greenhouse gases” (GHGs) help warm the Earth. There’s no consensus that it’s harmful. In fact, warmer climate is generally beneficial, which is why scientists call periods of warm climate “climate optimums.”
● https://sealevel.info/learnmore.html?0=consensus#consensus
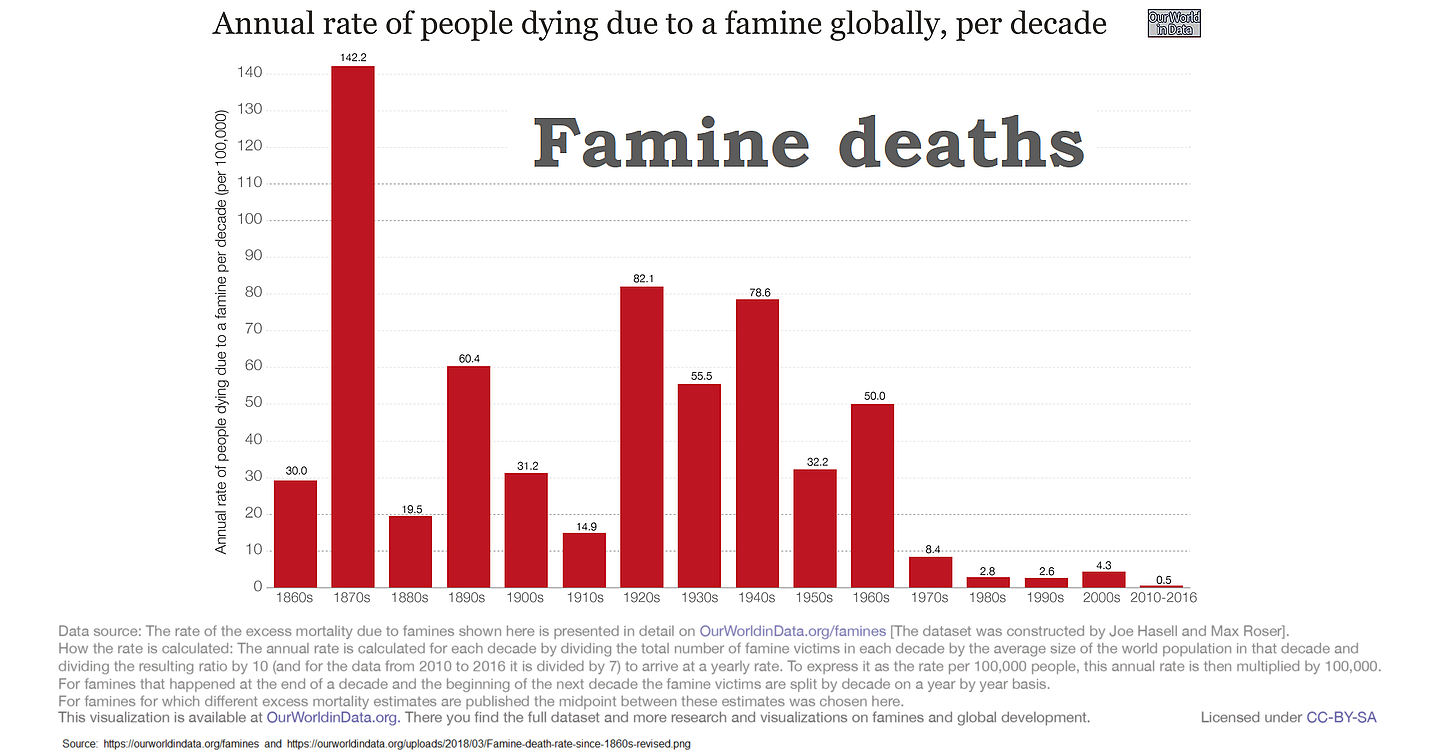
35. The additional CO2 which mankind is adding to the atmosphere has major beneficial effects. It is greening the Earth, especially in arid regions. It is improving agricultural yields, and thereby freeing up land for reforestation. It is improving global food security by helping to mitigate drought impacts, which has helped to drastically reduce the frequency and severity of famines.
● https://sealevel.info/learnmore.html?0=benefits#benefits
● https://sealevel.info/negative_social_cost_of_carbon.html
● http://co2science.org/data/plant_growth/plantgrowth.php
“There is no convincing scientific evidence that human release of carbon dioxide, methane, or other greenhouse gases is causing or will, in the foreseeable future, cause catastrophic heating of the Earth’s atmosphere and disruption of the Earth’s climate. Moreover, there is substantial scientific evidence that increases in atmospheric carbon dioxide produce many beneficial effects upon the natural plant and animal environments of the Earth.” —The Global Warming Petition, signed by 31,487 American Scientists
● http://www.petitionproject.org/
● https://www.quora.com/Did-30-000-scientists-declare-that-climate-change-is-a-hoax/answer/Dave-Burton-2
“Future generations will wonder in bemused amazement that the early 21st century’s developed world went into hysterical panic over a globally averaged temperature increase of a few tenths of a degree and, on the basis of gross exaggerations of highly exaggerated computer predictions combined into implausible chains of inference, proceeded to contemplate a rollback of the industrial age.” —Prof. Richard Lindzen
● https://www.azquotes.com/quote/605897
“’One dollar can save a life’ [so] the opposite must also be true. ‘Poverty is a death sentence.’ … Today’s decisions should be based on all the information we can get, not on hiding the decline.” —The Climategate whistleblower
● https://sealevel.info/FOIA/README.txt.html
Sea level rise:
The alarm over sea level rise caused by anthropogenic CO2 rise.
First, sea level rise began in or around 1863 according to this nature paper: https://www.nature.com/articles/s41467-022-28564-6
Sea level rise of course is the result of many factors, including terrestrial ice melt, ground water removal, and thermosteric sea level rise (sea water expansion). However, UN IPCC AR5 reports anthropogenic CO2 rise doesn’t begin until around 1950, 87 years after the beginning of sea level rise.
We apparently out of the data, someone can tease 0.01mm/yr/yr acceleration in sea level rise beginning around 1950. However, our tide gauges measure with accuracy of only +/-3.4cm. So I’m not sure how you get 10 microns out of a data set which is +/-34,000 microns in accuracy.
Therefore, the future doesn’t cause the past. I propose that sea level rise cannot be caused by anthropogenic CO2 rise.
First, a question, Michael: What’s the source for that “accuracy of only +/-3.4cm” claim?
I think you ought to be able to do better than that by simply reading the markings on a tide pole, in a stilling well, on a schedule synchronized with the tides, like they did 200 years ago.
The key thing to recognize about that “0.01mm/yr/yr acceleration” (reported by Hogarth, 2014) is that, for practical purposes, it is negligible.
The best studies of coastal (tide gauge) sea-level measurements vary only slightly. Some, including Hogarth (2014), show negligible acceleration in sea-level trend over the last century. Others show none at all. Houston (2021) summarized ten of those studies:
The largest acceleration reported by any of those ten studies was only 0.0128 ±0.0064 mm/yr². 0.0128 mm/yr² acceleration continued for 150 years would add just 5.7 inches to global (average) sea-level.
Without huge acceleration, the supposed sea-level threat disappears. The current trend is so miniscule that in many places it’s dwarfed by local factors, like erosion, sedimentation, or vertical land motion. Greta’s hometown of Stockholm is one such:
https://sealevel.info/MSL_graph.php?id=stockholm
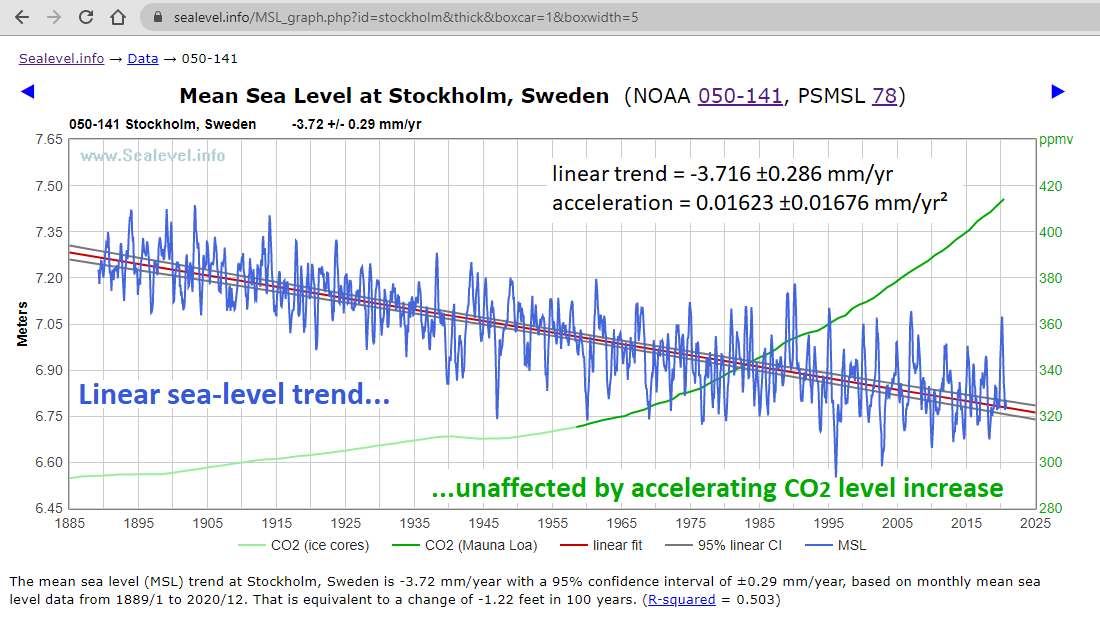
The bottom line is that the sea-level scare, like the rest of the climate scare, is much ado about almost nothing.
Dave,
Using Stockholm as an example, (as I’m sure you know) is not good for the ignorant, because Stockholm is rising due to isostatic uplift, due to a mile or so of ice on top of it having melted in the last 20,000 years.
It would have been better to use a more typical record.
Sydney’s fort Denison for example..
Over the last 100 years Ft. Denison has experienced a fairly typical sea-level trend:
linear trend = 1.331 ±0.137 mm/yr
acceleration = 0.00716 ±0.01052 mm/yr²
(Before that, the graph looks a bit odd; I don’t know why.)
A linear trend of 1.331 mm/yr, continued for another 100 years, would add about five inches to Sydney’s sea-level.
The acceleration over the last 100 years is not statistically significant, but 0.00716 mm/yr², continued for 150 years, would add an additional three inches to Sydney’s sea-level.
Here’s the graph:
https://sealevel.info/MSL_graph.php?id=Denison&datasource=all&c_date=1923/1-2024/12
Disputin, as I wrote, Stockholm is an example of a place where the miniscule global sea-level trend is “dwarfed by local factors, like erosion, sedimentation, or vertical land motion.” This is the sentence which provided the context for the graph:
“The current trend is so miniscule that in many places it’s dwarfed by local factors, like erosion, sedimentation, or vertical land motion. Greta’s hometown of Stockholm is one such:”
OTOH, Honolulu is an example of a place where such there’s little or no vertical land motion, and a very typical sea-level trend:
https://sealevel.info/MSL_graph.php?id=Honolulu
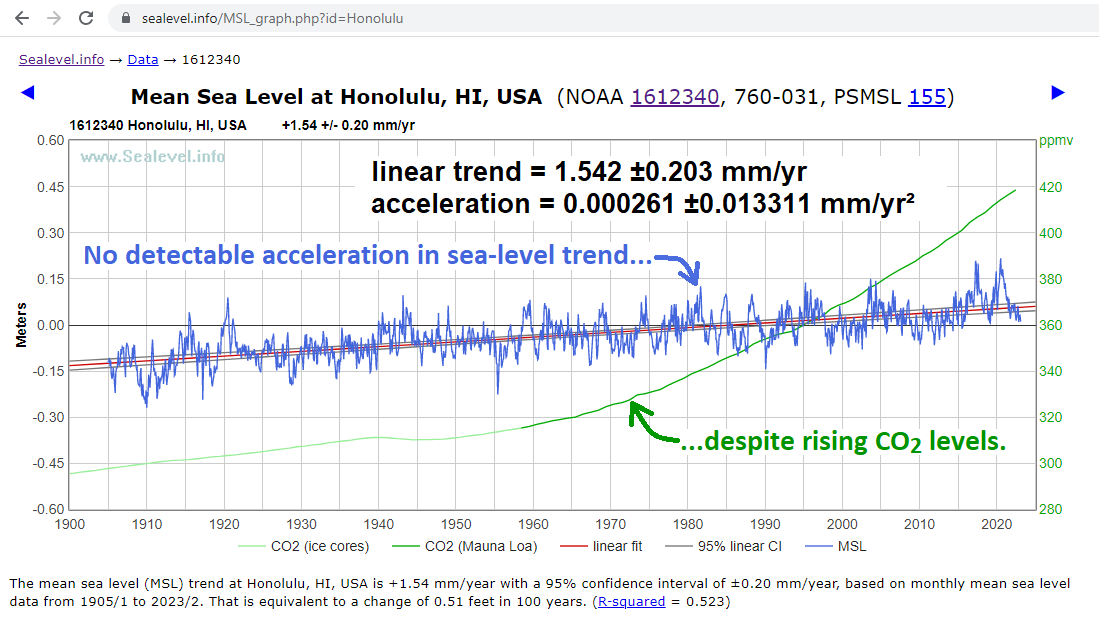
That’s only about six inches per century.
(Oahu experiences little or no vertical land motion. However, it does move horizontally, to the NW, at a rate of about 3″/year!)
There’s never been an ice sheet near Oahu, so it is unaffected by Post-Glacial Rebound (PGR), which greatly affects sea-level trends in places like Stockholm.
Honolulu’s long distance from Greenland also immunizes it from potential distorting effects of Greenland’s evolving ice sheet on the Earth’s gravity field (the “Greenland Gravity Effect”).
https://sealevel.info/resources.html#icegravity
Here’s an explanation of the Greenland Gravity Effect:
https://www.youtube.com/watch?v=XZqtXf0ieTc
Peltier’s ICE-6G(VM5a) estimate is that Honolulu is experiencing just 0.10 mm/yr uplift.
SONEL’s analysis, from GPS data, indicates that Honolulu is subsiding (rather than rising), but at only 0.26 ±0.18 mm/yr:

http://www.sonel.org/spip.php?page=gps&idStation=693
Screenshot:
The CORS plot is flat as a pancake:
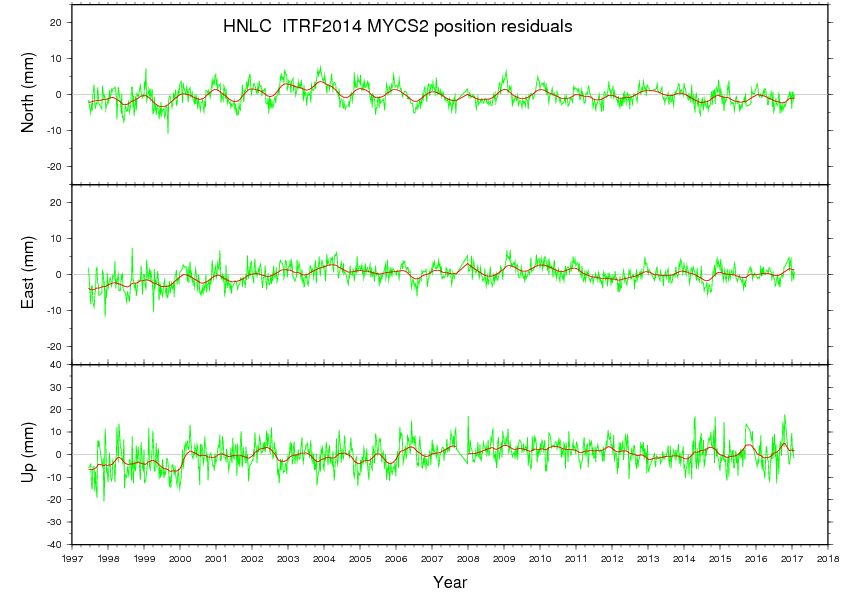
https://geodesy.noaa.gov/cgi-cors/CorsSidebarSelect.prl?site=hnlc&option=Time%20Series%20(long-term)
Screenshot:
Those VLM numbers are small: +0.10 and -0.26 are opposite sign but close together. In other words, Peltier’s model & SONEL’s measurements agree that Oahu experiences little vertical land motion.
To put things into context, there is much hand waving, hollering, and hair pulling about 2 or 3mm/yr. The motion of tectonic plates is from 10-160mm/yr, with a likely modal value of about 25mm/year. That is, tectonic plates are moving about an order of magnitude faster than the claimed sea level rise, and nobody gets very excited about that — unless they are currently experiencing an earthquake.
Pay more attention to climate history than climate models.
I’m happy for climate nerds to keep on working their spreadsheets to construct a poofteenth of a degree increase in the weather in 100 years time, but stay in their lane.
But they know sweet f. all about utility scale electrical power generation, storage, distribution or economics, so stay out of that lane, and leave it to the experienced engineers.
I’d suggest two one-liners, explanations unnecessary:
1) An average of measurements is not a measurement!
2) A single number (average temperature) tells you nothing useful about “climate”
Hiskorr’s points are correct, but they are more rhetorical than scientifically substantial. Taking an average and drawing conclusions therefrom is a respectable technique in statistics. One could, however, show that the increase in global mean surface temperature has been so small as to be harmless and net-beneficial.
Basically every facet of human existence has increased during that period of slight warming
Life expectation and quality, health, wealth etc etc etc
And the CO2 superstition looks to destroy that all. !
“Life expectation“: not a good metric for anything
If you think that the change from CAGW to CACC was not a “substantial” and unscientific error, then you have not been paying attention.
At no point have I stated what Hiskorr says. I have stated that trying to found an argument against the Party Line on climate by saying there is no such thing as global mean temperature or there is no value in such an average will achieve little or nothing.
I believe this is much more than just a rhetorical debating point—that global average air temperature is not a physical quantity is not even disputed by the climate science trendologists (they choose to ignore this inconvenient truth, of course). It is not the single number that tells everything about climate or even climate changes, yet this is how these calculations are employed. GAT is the very basis of the “1.5C to prevent climate-ageddon” mantra that is applied to every appeal for the net zero nonsense, but it is not a measurable quantity.
Global mean temperature is derived directly from measurements at stations all over the world. Therefore, trying to attack the Party Line on the basis that there is no such thing as a global average temperature will be bound to fail.
“[I]dentifying points on which skeptics agree” is the perspective I was using. It of course possible to calculate these values so I’m not saying they don’t exist. The point is they are a very poor representation of the climate because many details are lost through averaging, and the only ones who dispute the issue are those of the Stokes Tribe (stealing his own vernacular).
But you are probably right, they are so ubiquitous that most people can never see it.
Please! I expect much more accuracy from you than that. Historical GAT was calculated from temperature measurements taken at a relatively few, non-uniform stations with much infilling and WAGs about what happened elsewhere and elsewhen. The first-order data (actual measurements) are usually Tmax (pm) and Tmin (am). These can be taken as a reasonably accurate measure of one of many variables of that day’s weather at that location. As soon as those data are combined to calculate Tavg, most weather information from the data is lost. Even your phone gives you an estimate of Tmax and Tmin (as well as clouds, precipitation, winds and other weather (climate) parameters) when describing upcoming weather. Every “skeptic” worth his salt should understand that, even if “global climate” is a useful concept, GAT is not a useful proxy for it, whatever it is.
“There are lies, damlies, and statistics.” Every “skeptic” should likewise understand that statistics are most useful when dealing directly with measured data. Every statistical operation on a data set (average, median, trend, etc.) sometimes produces interesting information about the data set, but at the cost of the loss of much information contained within the set. That’s why it’s useful to remember that “The average of measurements is not a measurement” By the time you have calculated the trend of the anomaly of the global average of the annual average of the daily measurements of Tmax and Tmin (“accurate” to within 0.01K), please remember that the actual measurements of Tmax and Tmin, on any time of day, any time of year, someplace on Earth vary between 233K and 313K. What changes occurred within the data set to produce that trend is left as an exercise for a more competent scientist. And you can bet someone survived to take those readings at those locations.
So-called global warming isn’t global. There has been no warming at the South Pole since continuous record keeping began there in 1958.
An average global warming of 1.0 degree C since 1850 hides little to no warming and cooling across most of the globe. Most warming has been in the poorly sampled and badly station-sited Arctic. I’m dubious of warming claimed there, except in settlements.
Two more:
#15》 Reliance on wind and solar energy means freezing in the dark on windless winter nights.
Even Bill Gates understands that:
https://www.youtube.com/watch?v=9xe3BWPsBTU
#16》 The claim that wind and solar energy are now less expensive than electricity from dispatchable sources like fossil fuels is false.
It’s a product of either economic illiteracy, or deliberate deception by the renewable energy marketers, because it indefensibly conflates price with total cost.
The reason wind and solar average energy prices are falling is not that they are becoming more affordable. Rather, it is because they tend to produce power when it is not needed, and power produced when it isn’t needed fetches low prices.
Worse, they often do not produce power when it is needed. That is a BIG problem.
The two inevitable consequences of increasing reliance on “renewable” wind and solar energy are higher electricity prices and lower grid reliability.
Both of Mr Burton’s points are good ones. The simplest approach to wind and solar is to say that if people wish to install them they can do so but that the State will no longer subsidize them in any way at taxpayers’ expense, and will no longer give them priority in the generation merit order, and will no longer allow them to be erected at locations that damage the natural beauty of the landscape or threaten birds, bees and bats.
“…damage the natural beauty of the landscape or threaten birds, bees and bats.”
But what about the whales, my lord!
“ the State … will no longer allow them to be erected at locations that damage the natural beauty.”
Scary thought, I hope not.
Good job with these!
“Many people have a vested financial and/or professional interest in perpetuating the global warming scare.”
BallBounces is correct that vested interests are at work. It would be interesting to compile a list of the ideological, national, regional, corporate, journalistic and rent-seeking vested interests benefiting from this scam. The list is a long one.
The restless and eternal search for objective scientific truth is of its essence skeptical, not consensual
nope. skepticism is the position that no objective truth exists, or that we can have no certain knowledge of it.
the search for knowledge is not skeptical, or contrarian
Mosh wouldn’t have a clue about scientific truth, fact …
… or anything to do with science at all, actually !
Even his words are garbled nonsense. !
PolicyWelcome to my home on the Internet. Everyone who visits here is welcome to post, but please treat your visit like you would a visit to a private home or office. Most people wouldn’t be rude, loud, or insulting in somebody’s home or office, I ask for the same level of civility and courtesy here.
There is no ‘scientific truth’
Ther are only theories, that haven’t been debunked (yet)
‘Global Warning’, as it is portrayed, has been debunked.
is it true that “its been debunked?
“nope. skepticism is the position that no objective truth exists, or that we can have no certain knowledge of it.”
Uh, nope. Skepticism is more along the lines of admitting, “I don’t know everything and neither does anybody else. So lets keep checking and learning.”
Skepticism is more along the lines of admitting, “I don’t know everything and neither does anybody else. So lets keep checking and learning.”
ah nope. Sextus Empiricus.
look you people have no idea about the rich tradition of skeptics going backthrough descartes to Sextus Empiricus and back to the acedemic skeptics of Platos
academy. you USE their tools, but have never learned the rest of the story
A skeptic doubts accepted opinions. You could look it up.
close. i imagine you had to google academic skeptics
“skepticism is the position that no objective truth exists, or that we can have no certain knowledge of it”
absurd! that’s not how most skeptics think- if you paid attention you’d know this- not being skeptical is for lower life forms, not humans
as for certain knowledge- we have no certain knowledge of anything- if we had certain knowledge of anything we could leverage that into certain knowledge of everything
if we had certain knowledge of anything we could leverage that into certain knowledge of everything
nope. say hello to mr godel
Hypocrite.
i’m certain you have no idea what you’re talking about.
I’m certain that 2+2 = 4. that the conjunction of two true propositions is true
that the disjunction of a true and false proposition is true.
if we had certain knowledge of anything we could leverage that into certain knowledge of everything
can you even explain what that means? “leverage?
absurd! that’s not how most skeptics think- if you paid attention you’d know this- not being skeptical is for lower life forms, not humans
skeptics dont practice Skepticism
Every day, I drive into work (unafraid of viruses) where I have to trust people I’ve never seen or heard.
no you dont. im skeptical. you probably dont even have a car
President Reagan distilled the essence of healthy skepticism, in his approach to negotiating agreements (notably the INF Treaty) with the USSR:
“Trust, but verify.”
There’s a lot of wisdom in those three words:
“Trust” — be charitable. Just because someone disagrees with you, that doesn’t necessarily mean he’s an evil enemy. Start with the assumption that he at least believes what he’s telling you. Knee-jerk dismissal of what he has to say is not skepticism, it is closemindedness.
“But verify” — check for yourself. Do your due diligence. You should not just assume that what someone tells you is the truth, even if you are charitable, because information from someone can be wrong for any of several reasons:
● One reason is that the source is simply dishonest. Sadly, there’s a lot of that, these days.
● Another is that the source is careless with the truth. Many people really don’t care much whether what they say or believe is accurate, e.g., because the assignment desk has given them two more stories to do today, and they want to leave at 5pm.
● Another is that the source is nuts. There’s a lot of that, too — on both sides of the climate debate.
● Another is that the source, even if neither dishonest nor nuts, and despite not being especially sloppy, is nevertheless mistaken. Nobody is infallible.
A shortage of healthy skepticism is one of the causes of the replication crisis — which, unlike the “climate crisis,” is real.
The bottom line is that you need to do your best to check the claims that people make — and even your own assumptions and conclusions — rather than uncritically accepting them.
That healthy habit is especially important in science, and it’s why so many of the best and brightest scientists are skeptical of climate alarmism. They didn’t just trust information based solely on the source, they checked for themselves… and they found things like this:
and this:
and this:
and this:
Dave Burton:
Interesting graphs, but they end at 2012.
Any data available on droughts 2020-2022?
sorry Dave this doesnt respond to a single point.
Another is that the source, even if neither dishonest nor nuts, and despite not being especially sloppy, is nevertheless mistaken. Nobody is infallible.
including Dave
seriously
Nobody is infallible..
should i trust you on that?
how do i verify that?
now i cant trust or verify that everyoe is fallible.
Mr Mosher is, as always, wrong. It is a tedious totalitarian trope that there is no such thing as objective truth. The reason why totalitarians say there is no such thing as objective truth is that the Party Line to which they adhere is nearly always contrary to the objective truth in many material respects. Since the likes of Mr Mosher recognize no truth outside the Party Line, they must deny the existence of objective truth. But in doing so they tellingly reveal their intellectual bankruptcy.
Skepticism is the position that objective truth exists and that, therefore, where an assertion cannot be proven true, no mere consensus will assist in deciding whether or not it is true.
Skepticism is the position that objective truth exists and that, therefore, where an assertion cannot be proven true, no mere consensus will assist in deciding whether or not it is true.
nope: see Σέξτος Ἐμπειρικός
see ANY of the greek skeptics. I may not be a Lord, but i did have to read and understand all forms of ancient greek skepticism.
edious totalitarian trope ????
please miss me with your amatuer alliteration attempts **sswipe
tropes? name the tropes of greek scepticism you i cant
Mr Mosher is, as always, wrong. It is a tedious totalitarian trope that there is no such thing as objective truth.
MY argument is that Skepticism ARGUES that there is no objective truth.
thats not my position because im not a skeptic.
you totally misunderstand the ROLE of doubt in science.
doubt isnt the essence of science. knowledge is. knowledge attained through the systematic application of doubt.
its outrageous that i have o explain the classical origins of skepticism to anyone here.
mosh is in meltdown mode.
However, weather-dependent renewables must be backed up at all times by thermal generation capable of supplying the entire demand on a grid.
nope.
Mosh.. wrong again…
RELIABLE generation with the ability to supply the whole grid, has to be on stand-by at all times.
Winds can disappear, clouds can stop solar.
However, weather-dependent renewables must be backed up at all times by thermal generation capable of supplying the entire demand on a grid.
nope.
thermal back up is ONE solution!!!!! so im skeptical of the word “must”
mosh doesn’t know what “thermal generation” means, heh.
now we add the weasel words
you should have thermal backup if you want CHEAP RELIABLE electricity.
you see how far we are from the FALSE claim that
“you MUST have thermal back up.
here is a hint boys. when OP makes a sweeping claim with no nuance, no evidence
the BEST takedown is one word. why waste words on someone unable to see
objections to their hyperbolic rhetoric that is only fit for religion
Again a reverse ferret. IF you have hydro you don’t need the thermal. But only a few nations have the hydro.
And of course you only need backup 95% of te time, not all the time.
Or you can so saturate the world with windmills that are hardley ever used, that it drops to 50% of the time.
Remember ArtStudents™ think in Boolean logic only. Man powered flight has been achieved. Solar powered flight has been achieved. For one hour a decade all you need is windmills and solar panels. THEREFORE it CAN ALL be done. ALL THE TIME.
“Again a reverse ferret. IF you have hydro you don’t need the thermal. But only a few nations have the hydro.”
And now in America the enviros are pushing to end hydro.
And, in a schizophrenic sense, pushing to re-introduce beavers.
weird. person X uses the word MUST and me pointing out the obvious flaw in that logic is a reverse ferret. nope, its called skepticism.
Boolean logic only? nope. modal logic
look the word MUST was used. that implies necessity. so we are talking
modal logic.
you. you will have to google that.because you are a skeptic who cant argue without adhominum
heres a hint: even art students know more modal logic than you.
A classic one-word mosh drive-by.
All he has is lies.
“However, weather-dependent renewables must be backed up at all times by thermal generation capable of supplying the entire demand on a grid.”
Mosh says, “nope.”
He’s right. But Green power doesn’t have to have backup. But if it doesn’t, hope you like regular brownouts and blackouts!
PS If they want to claim hydro as “Green” energy, why are they trying to remove dams and not build more?
Mr Mosher is not a serious figure. He is entirely incapable of arguing beyond the kindergarten yah-boo. But he provides a revealing example of those whom Lenin called “useful idiots”.
If one wants to keep the lights on and not to collapse the Western economies altogether, then 100% thermal backup must be available at all times in case the wind dies and the Sun sets. It is as simple as that. Therefore, there is no need for wind and solar power on the grid at all: electricity prices would be far, far smaller without it and the grid would be far, far more reliable and stable.
well the good Lord does not dare to meet me on a level playing field but instead hides behind the skirts of moderators,
The moderators are allowing you to post, more hypocrisy.
He’s right. But Green power doesn’t have to have backup. But if it doesn’t, hope you like regular brownouts and blackouts!
hes right!!!!
you see how EFFECTIVE one word drive bys are. that one word made him think for himself
“YOU MUST have thermal bback up.”
nope!. you COULD have it. you SHOULD have it.
now look, behind that one word NOPE. is a whole list of skeptical arguments
If anthropogenic warming is real– and I have my doubts– solutions to it will be engineering solutions. Engineering takes money. Wealth is produced by healthy economies. Healthy economies use energy. Hamstringing powerhouse first-world economies by throttling their energy sources will foreclose on vast areas of research and production that could provide answers. Let markets operate so that climate issues are addressed when and if it makes economic sense to do so. This is the quickest and surest means of obtaining real solutions.
Accelerating technology plus increasing longevity equals revolutionary technology neglected by a market that still likes to an older old way.
So Trenberth and his compatriots have successfully framed this technical issue as Radiation from the Sky to the Surface. That is plausible to some fraction of the Great Unwashed, But does not represent reality. The Sky cannot heat the Surface, nor can the Atmosphere heat itself.
The issue is not Flux, which means Watts/MeterSquared. The issue is energy retained in the atmosphere. As CO2 ppm rises, the altitude at which the Atmosphere becomes opaque to LWIR increases, thus decreasing the Temperature at which the Atmosphere is freely able to radiate to Space, thus lowering energy transfer to Space.
But no one can calculate the magnitude of this from First Principles.
Lord Monckton I keep telling you this, but this is not your training. Go find a good Mechanical Engineer who knows how heat is and is not transferred, ask him or her. My professors at the world-famous U of Michigan would laugh at this ludicrous debate, except Libtards have taken over there, so it would cost them their tenured jobs. Professor Smith, Professor Wang, all of them know the truth, not interested in this ludicrous controversy.
Moon
And if you did not know this, Mechanical Engineers are hired when Fuel is bought and burned, oil, gas, coal, to assure that no Fuel is Wasted, which is a very expensive thing to do. I did work on a small Wind Turbine in my first job out of the U of M, gave us 25% of nameplate in the windiest spot in Texas, the Sabine Pass. I also worked on the first Gas Turbine Combined Cycle powerplant in the USA. I know whereof I speak.
Moon
If you are interested, it was an 110 MegaWatt machine from Westinghouse, at that time the biggest one in the world. 1981, Gulf States Utilities in Beaumont TX, look it up. They located it in our Lake Charles LA powerplant.
I am waiting for a contradiction from someone who passed Thermo 2 and Heat Transfer from a good engineering school. Money is spent on this, if you are arguing with people who have not been paid in this field they know nothing.
And it is a whole lot of money, consider the electric utilities, the oil companies, the gas companies, the coal companies. Keeping the lights on for many decades now. And the Donald C. Cook Nuclear Center…
Really? We know nothing about this, or we are all lying?
Sure, the wind turbines and the solar cells and the non-existent grid-scale batteries to keep the lights on for two or three cloudy windless weeks will be built in the next few months…
Moon
and, once again
Lord Monckton.
You have made the mistake of letting them dictate the terms of the game, which has no basis in Physics. Find a good smart ME. We are the ones who make sure no money is wasted when Fuel is used…..
Moon
There are a lot of them in Scotland, maybe a relative of James Watt?
Mr Moon makes the elementary mistake, in Logic 101, of believing that accepting most of an interlocutor’s points ad argumentum is the same as accepting them simpliciter.
For your info not only is it necessary to know classical physics but also quantum physics to understand all of the issues involved in the atmospheric greenhouse effect.
Be careful to preserve the illusion of anonymity.
Mr Moon is by no means as expert as he thinks himself to be. The influence of changes in the greenhouse-gas burden in the atmosphere is not, as he imagines, a “flux”, which would be measured in Watts. It is flux density, which is measured in Watts per square meter of the emitting surface of a celestial body.
The characteristic emission surface of the Earth is in the mid- to upper troposphere. Any change in the net down-minus-up radiative flux density at the characteristic-emission altitude will cause that altitude to rise. Since the temperature lapse rate with altitude in atmosphere remains approximately consant, the effect of that increase in the mean altitude of the characteristic-emission level is to increase the temperature at all points in the troposphere, all the way down to the surface.
The clearest explanations of this mechanism are to be found in the papers of Professor Lindzen.
Furthermore, Mr Moon, being unfamiliar with formal logic and its power to make even the most intransigent true-believers admit they got things wrong, continues to show no understanding of the fact that one is far more likely to succeed in an argument if one accepts – albeit solely for the purposes of argument – that all points put forward by one’s interlocutor that one cannot demonstrate to be false are true.
Accordingly, my team accepts, for the sake of argument, that our enrichment of the atmosphere with greenhouse gases will cause direct warming at approximately the 1.2 K-per-CO2-doubling midrange rate found widely in the climatological literature. For that rate of warming, on its own, is manifestly insufficient to cause any sort of “climate emergency”.
To make the warming catastrophic, the climatologists say that the direct warming by greenhouse gases must be multiplied by 3 or 4 or 5 or more to allow for temperature-feedback response. It is here that we are able to prove that climatologists have perpetrated a serious error of physics.
A mere knowledge of mechanical engineering, therefore, is manifestly insufficient to persuade the climate Communists that their position is scientifically untenable. But a knowledge of control theory in engineering physics is enough to show that they screwed up.
Christopher,
Correct use of terms is a problem that is always with us. During the course of my education at college I received red ink criticism for my use of pleonasms. My view still remains that because technical conflict sometimes arises because of issues of definition, I tend to veer to the side of repetition to ensure clarity.
Michael
You may find this still growing compendium of terms useful:
Measurement & Dimensionality 01Nov18
Philip
An flux is not the same thing as a flux density. Adding the word “density” is not a pleonasm. The units of flux are Watts (i.e., a flow in Joules per second). The units of flux density are Watts per square meter of the emitting surface (i.e., a flux density in Joules per second per Watt per square meter).
In your second paragraph fist you say it is not about flux then everything you describe is about flux.
“Libtards have taken over there, so it would cost them their tenured jobs”
I thought tenured jobs were for life. Or is it just that even with tenure, they don’t want a bad reputation if the zeitgeist goes against them?
Even with tenure, there are ways to get rid of an academic if the administrators set their mind to it. Not the least of which is to just make life so miserable that one would not want to stay there.
Michael Moon wrote, “The Sky cannot heat the Surface,”
Sigh. We’ve been over this, Michael. You’ve been saying it since at least 2019. It was wrong then, and it is wrong now.
Downwelling infrared “back radiation” from GHGs and clouds in the atmosphere is real, and measurable, and when it is absorbed by the surface it thereby “warms” the surface (which is to say, it makes the surface warmer than it otherwise would have been).
Invest to finish the development of modern, modular nuclear reactors, the stabile, reliable energy source of the near future.
DWM is right: nuclear power, in all its forms, should be regulated in a more intelligent and less pointlessly intrusive, costly and time-consuming fashion. It would frankly be best to leave the choice of generating systems to the free market, rather than interfering to promote one method or another in the specious name of Saving The Planet.
“the stabile, reliable energy source of the near future.”
So thought many in 1950.
1 It would help if the points were numbered or, better perhaps, had simple Ids for reference.
2. I have doubts about whether the ‘feedback’ points meet the stated criteria. Feedbacks are very difficult to identify and quantify, and CM’s arguments use numbers and formulae unfamiliar to most people. We all know that feedbacks are a major weakness in the CAGW case, but it is difficult to address them within the stated criteria.
3. I do think that there is scope for a more basic point on the models’ reliability than CM’s “Models’ predictions of global warming are purely speculative“. Something like the following, which overlaps CM’s point but targets it differently. Maybe there are two separate points here?
All climate predictions use climate models. Weather models are far more sophisticated than climate models, yet they struggle to predict weather more than about five days ahead. Climate models have the same structural basis as weather models, and they use the same rules of physics, but they have a lot less detail. There is no way that a climate model can successfully predict anything even five days ahead, let alone for years or decades ahead. As Steven Koonin demonstrates repeatedly in his book Unsettled, the climate models are not fit for purpose.
(92 words)
In response to Mr Jonas, we are not at this stage concerned with the precise modalities of presentation. We want to agree upon the list of main points first. To me, the strongest are the 0.1 K reduction in global temperature that is all that worldwide net zero would achieve at crippling cost, the fact that in most western countries adding any more renewables to the grid cannot and will not reduce emissions one jot, and the fact that in any event there is no need to do anything about global warming because the notion of warming large enough to be potentially catastrophic was rooted in an elementary error of physics.
Mr Jonas objects to the inclusion of climatology’s error of feedback analysis on the ground that individual feedbacks are impossible to measure or otherwise to quantify. However, the beauty of our method is that it requires no knowledge of individual feedback strengths at all. Instead, we derive the overall corrected feedback strength in Watts per square meter per Kelvin of the entire reference temperature including the dominant 260 K emission temperature omitted from feedback calculations by the usual suspects. For each 1 K of equilibrium sensitivity, the implicit additional total feedback strength works out at 0.01 Watts per square meter per Kelvin of the entire reference temperature. It is precisely because that value is so very small that feedback analysis cannot be – but is at present – used to derive predictions of global warming. The fact that the entire case for climate panic was founded on strikingly elementary a scientific error is very powerful. And, as shown in the head posting, the idea can be summarized in 100 words. Or, in a single sentence: “They forgot the Sun was shining”.
For similar reasons, Pat Frank’s proof that the models’ predictions are, statistically speaking, no better than guesswork is very powerful. The list of main points in opposition to the Party Line is not solely or even chiefly a public relations exercise. Therefore, where there are key points at which climate scientists have simply gotten the science wrong, we should not be frightened to say so.
Finally, though Mr Jonas’ point about the weather forecasts getting things wrong five days ahead is a good debating point, the usual suspects tend to answer it by saying that it is easier to predict climate than weather because climate is long-term-averaged weather. That answer is not entirely without merit. It is for this reason that we are trying to avoid debating points for the purpose of this exercise, so as to concentrate on points of science or economics that the climate Communists cannot easily or credibly refute, if at all.
Well, good luck with getting your analysis of feedbacks into “our interactions with governments” (preamble) and “generally known about and understood” (first criterion). I suggest that government understanding would collapse totally just at the letter K, and that the public would lose interest a few words later.
If you concentrate on ideas that are within the grasp of governments and the public, then you are looking at developing the points like
Wind and solar power cannot get us anywhere near net zero
More CO2 and warmer weather have benefits
Selectively targeting the West increases global emissions
Your electricity costs more because EVs are sucking power out of the system
and shifting the scientific/technical stuff into the appendices.
OK, so the last point above isn’t one of yours, but it’s one the public can understand easily.
To my mind, the major obstacles that your approach faces is that the interests of government and the public are often diametrically opposed and neither of them have any interest in “mainstream, midrange data and generally-accepted methods” (third criterion). Winning the ear of both will be difficult.
Mr Jonas has correctly noticed that I did not state how the information gathered in this exercise would be deployed so that governments had to take notice of it.
In fact, we are proposing to approach friendly senior legislators in various Western countries to invite them to put forward to their governments’ advisors a paper containing those of the key arguments that seem to be most powerful and most relevant and most irrefutable.
It will then be for the governments’ advisors to report back to them answering in detail the scientific, economic and pragmatic points raised in the document. When it becomes apparent to the legislators that their climate-change advisors cannot provide substantial or compelling refutations of the points made, we are hoping to invite them to approach IPCC directly and invite it to refute the key arguments.
When it becomes apparent to the governments concerned that even IPCC cannot answer the key arguments – specifically including the feedback argument, which is rigorously and completely set forth in a fully-references four-page paper – and that, therefore, the current global warming policies are based on climatologists’ error of physics, one or two of them will break ranks, resign from the various climate-Communist treaties and cease all energy-market interferences and subsidies.
The first Western nation to wake up and smell the coffee will reap a fortune as industries now collapsing at record rates cling on in the hope of seeing affordable electricity once again in a year or two’s time.
This is not, repeat not, primarily an exercise in public relations. It is a method by which governments themselves, by asking their advisors and the IPCC to refute the principal skeptical conclusions, will realize that the points are indeed as unanswerable as we have found them to be. For instance, it is directly in the interest of Britain’s ruling Conservative Party to abandon the whole climate claptrap, build a dozen coal-fired power stations, permit fracking and get the electricity price down sharply, conquering inflation on the way. If the Conservatives are the only party willing to follow science, economics, pragmatism, logic and common sense by facing down the entire climate-Communist establishment, they will storm home to an enormous victory at the next General Election. All they need is the reassurance that in adopting that policy they will not be causing net harm to the planet – and it is their own advisors’ failure to find fault with our document that will provide them with that reassurance.
With Carrie now gone, you have a chance. If Liz Truss had called bluff you would be well on your way by now. I think you will have your work cut out with Rishi Sunak but at least the Conservative party is still a party. If you concentrate your efforts on the Tory party as a whole you will find fertile ground. It might be a good idea to work on other countries too, like Germany, Sweden, The Netherlands and Italy. Their people and/or governments are ready to listen. When a wall has to be torn down, it doesn’t matter much which brick comes down first.
PS. I wasn’t joking about EVs. Given that you would want to carry the public with you from the start, EVs might be the most powerful (pun intended) argument of all.
All the best for your efforts.
I am most grateful to Mr Jonas for his support. I shall hope to write another head posting once I have gone through the very many constructive suggestions for points to be included in the document to be put to governments.
We shall indeed be trying to approach several governments worldwide. It will only take one government to break ranks, and the entire edifice of nonsense will tumble.
Christopher,
They also forgot that the night is dark.
Philip
When all of this got going in the mid 90’s, I remember a chart of earth temperatures over the last 1000 years. It was an average of many (dozens?) of proxies from around the world. It showed that global average temperatures were a little higher than now in 1000, fell to some cold value around 1500, and then increased again back to where it is now.
Somehow that graph is gone forever. Anyone know what happened to it? Was it thrown away for any good reason?
I think you are referring to Figure 7.1, panel c, from the FAR WG-I report of 1990 (see attached screenshot).
The FAR can be downloaded in “scanned PDF” format from the IPCC website.
URL : https://www.ipcc.ch/report/ar1/wg1/
The full report is “only” 29.4 MB in size, The individual “Chapter 7” file is 4.7 MB.
Figure 7.1 can be found on page 202 …
The graph from IPCC (1990) sho0wing the medieval warm period as warmer than the present and the little ice age as cooler was originally by the formidable British meteorologist Hubert Lamb. It is strikingly different from the hokey-stick graph of Michael Mann. Which of the competing graphs is true? The answer may be derived by comparing the 1000-year reconstruction of global sea levels (Grinsted 2009) with the two graphs. Sea level varies precisely in line with Hubert Lamb’s graph and is nothing like Mann’s graph. So Lamb was right.
I think you should use your comment directly above as one of the talking points.
The scary Hockey Stick chart profile is not the only profile of the Earth’s temperatures. Other temperature profiles are not scary at all, showing it was just as warm or warmer in the past than it is today, and showing we have nothing to fear from CO2.
So which temperature profile is the true profile? It’s not Michael Mann’s. Mann’s temperature profile is an outliar. Everything else points to the benign temperature profile, where it was warmer in the past than today, as being the true profile. That’s what all the unmodified, regional temperature charts show.
The Hockey Stick chart profile does not conform with temperature history. It is an artifact created to sell the Human-caused Climate Change narrative. It has no supporting evidence. The only data it used, which is the only data available, does not show a Hockey Stick “hotter and hotter” temperature profile. So how do you get a Hockey Stick profile out of non-Hockey Stick data? The only answer is a fraud was perpetrated, erasing the real temperature profile and putting a scary profile in its place.
The question to ask is: How do you get a scary, hotter and hotter Hockey Stick temperature profile from data which does not contain a Hockey Stick profile itself?
See below.
The chart on the left is the U.S. chart, which shows it was just as warm in the 1930’s, as it is today, and this shows that CO2 has not added enough warmth to the United States to push the temperatures above those in the 1930’s, even though there is much more CO2 in the atmosphere today than there was in the 1930’s. All the unmodified, written temperature records from around the world, resemble the temperature profile of the United States, where it was just as warm in the Early Twentieth Century as it is today.
Michael Mann’s bogus, bastardized Hockey Stick chart on the right, shows a completely different temperature profile from the profile of the United States and the other unmodified regional charts from around the world. The Hockey Stick portrays a scary scenario where temperatures have been getting hotter and hotter and hotter and portrays today as being the hottest times in human history. This Hockey Stick chart was created so that increases in CO2 would appear to be correlated with increases in temperature. That can be the only reason because the data does not support their computer-generated chart.
So which temperaure profile is the correct one? The one on the left that shows we have nothing to fear from CO2 warming, or the one on the right that shows our world getting hotter and hotter and hotter?
All the unmodified, regional written records show the same benign profile as the United States chart. None of them show a scary Hockey Stick profile.
Written records, or computer shenanigans? It looks pretty obvious tome. I’ll go with the data.
Lethal freezing outdoor temps in Southern Europe provide crappy support for a history that stretches back millions of years.
Good idea.
suggest… If you can’t measure it you can’t manage it is an accepted maxim. The only? Appropriate measure of CC is sea level rise.
The current use of World Av temp is floored as this metric is affected by El Niño and Arctic warming , which are both local effects not attributable to the EGE.
Cost benefit analysis suggests that the 5-6 trillion and counting in expenditure has shown no demonstrable or detectable benefit in any climate parameter.
To increase expenditures , as is currently happening, without a means of measuring an outcome and with little prospect of doing so, is surely tantamount to economic insanity.
Mr Moore suggests that the only appropriate measure of climate change is sea-level rise. That is a good point, but one should be cautious about putting all one’s eggs in that basket-case, because the usual suspects have been tampering no less vigorously with sea-level rise than with other metrics. One argument we can make from the reconstructed sea-level record over the past 1000 years (Grinsted et al. 2009) is that it plainly shows sea level as 8 inches higher in the medieval warm period and 8 inches lower in the little ice age than today, showing that there is a link between sea level and temperature, that, therefore, temperature was warmer in the middle ages than today and that, therefore, there is nothing unique or terrifying about today’s global temperature.
Mr Moore is also right about the absurdity of squandering trillions on reducing global warming without having any idea of just how little global warming would be prevented even if the whole world actually got to net zero emissions by 2050. It is that argument, above all, that we are beginning to use among the politicians here, and it is slowly gaining traction.
“which are both local effects not attributable to the EGE”
Depends on the definition of attributable.
Christopher,
Go at Lord Deben and Baron Stern.
Every day point out their errors and exaggerations.
Until they admit their mistakes and recant there is no chance of stopping the Net Zero nonsense. It is politics, not science, and until the politicians change tack nothing will change.
—
On more general points:
Net Zero is bad science and bad economics. Just Stop Net Zero https://www.juststopnetzero.com/
David Tallboys (Altipueri)
That is 8 inches not .8 inches sea level rise in 100 years – in case that is not obvious. 🙂
The IPCC assumption that all the net warming since 1950 was due to human emissions and only human emissions is an example of the single cause fallacy but there is no logic to excluding CO2 as one of various concurrent causes some affecting different regions at different times.
“there is no logic to excluding CO2 as one of various concurrent causes”
Duck!
Mr Tallboys (Alti pueri) suggests we should chase after the more than faintly ridiculous Lords Stern (he of the 11 K warming by 2100) and Deben (he who profiteers by owning windmills). The approach we are preparing does exactly that, but in an interesting and well-focused way. Once we have lined up the main points of dispute with the Party Line on climate, we are going to persuade sufficiently senior politicians in various countries to approach their own climate-change advisers with two or three specific questions that we know the advisers will be unable to answer. When they fail to answer properly or at all, the politicians will then approach IPCC, which will likewise be unable and thus unwilling to answer, whereupon it is possible to persuade the politicians that they should abandon the profoundly damaging dash for net zero in toto.
As to the use of Kelvin, it is unfortunately essential both for radiative-transfer calculations using the Stefan-Boltzmann equation and for corrected temperature-feedback analysis.
Likewise, when we use acronyms such as ECS we do so as sparingly as we can, and only after defining each such acronym at the time of its first use.
As to sea-level change, we shall of course show just how small and harmless the curent rate of change is.
As to variability in the extent and impacts of warming from region to region, the existence of variability does not cast doubt upon the notion that adding CO2 to the air will cause some warming: for there is substantial internal variability in climate.
As to the inadequacy of the computer models, Pat Frank’s result is already in our list, as is our own result showing that feedbacks diagnosed from models’ outputs cannot be found to a sufficient precision to make any predictions about global warming that are not mere guesswork. We have also included in the list a statement of the large discrepancy between the modeled midrange prediction of 0.3 K/decade since 1990 and the 0.13 K/decade observed warming rate, which is well below half the models’ midrange prediction,
1. More rain is not a problem.
2. Warmer weather is not a problem.
3. More arable land is not a problem.
4. Longer growing seasons is not a problem.
5. CO2 greening of the earth is not a problem.
6. There isn’t any Climate Crisis.
Mr Case’s list is excellent. We have already included in the head posting the points about more rain not being a problem, and about the greening of the Earth.
Except when it happens all at once like in Fort Lauderdale yesterday…. 😉
Fort Lauderdale isn’t the world
Fort Lauderdale isn’t the world…. unless you live in Fort Lauderdale.
On pure economics, Russia and Canada could form a treaty to throw up as much CO2 as feasible for as long as feasible… if they had proof. So much potential farmland sits frozen and little-used inside their borders.
Limit the whole thing to:
1) 100+ year record of unremarkable extreme weather metrics.
2) Unreliable UN IPCC CliSciFi models heating 2 to 3 times faster than observations.
3) 43+ year UAH6 trend of 0.13℃/decade w/o tropospheric hot spots.
4) No SLR acceleration.
5) The political nature of the UN IPCC giving out hysterical Leftist/Marxist nonsense.
Everything else is incomprehensible pettifogging beyond the average persons grasp.
In response to Mr Fair, we have included his points in the head posting. However, one should not dismiss those points not included in Mr Fair’s list. For instance, in just 100 words we demonstrate that even if the whole world went to net zero emissions by 2050 the global warming thereby prevented would be less than a tenth of a degree, at a cost of close to a quadrillion dollars. This is an easily comprehended and very powerful point.
The total world GDP in 2023 is about 106 trillion, it’s going to take quite a while to reach a quadrillion is disposal resources to spend on nut zero.
https://www.statista.com/statistics/268750/global-gross-domestic-product-gdp/
With all due respect, Lord:
“Even worldwide net zero would cut 2050 temperature by less than 0.1 C
Our influence on temperature has increased at 1/30th unit/year since 1990, with another 0.9 units by 2050 on business as usual. If all nations went straight to net zero by 2050, 0.45 units would thus be prevented. Unit warming is the ratio 0.46 C per unit of 1.8 C midrange transient 21st-century doubled-CO2 warming to 3.93 units midrange doubled-CO2 forcing. Finally, adjust for the ratio 0.45 C/C of 0.136 K/decade real-world warming to the predicted 0.3 K/decade warming since 1990. Then worldwide net zero would abate <0.463 C: that is, less than 0.1 C.”
I’ll leave it up to the reader to determine if that is a winning argument with the average person. I understand your argument and its math but I struggle with its meaning and, especially, importance.
Agreed
Mr Fair has unfortunately misquoted the head posting, which shows that worldwide net zero would prevent less than (0.46 cubed) degrees, which is less than 0.1 degrees.
Unlike Mr Fair, I have presented the argument for that negligible global-warming reduction even from worldwide net zero before several audience, all of whom have found the point very powerful, for the good and sufficient reason that if one spends a quadrillion dollars and trashes the global economy to buy virtually no change in global temperature then the value for money is, to put it mildly, poor.
What is intriguing to most audiences, including those in Parliament, to whom I have presented this argument is that it is such a simple matter to calculate how much (or, rather, how very, very little) global warming we can prevent.
M of B, I did not misquote the head posting; it is lifted directly from your post and includes quotation marks.
My point is that the argument is incomprehensible to anybody without some knowledge of radiation physics. That, and similar arguments will not gain traction with policymakers. One does not win scientific arguments with those who are perceived by the policymakers as controlling the “science.”
Climate science, like all science today, is finely chopped into its component disciplines such that no one person or group can speak definitively to the whole for policymaking purposes. Policymakers rely on the institutions set up for the purposes of advising on the particular issue. The only way skeptics will win the debate is to show such institutions are hopelessly politicized and corrupted that they cannot be trusted. And hammering on readily understood facts, not arcane science, is the way to do that. Alinsky said it all.
Even when Mr Fair has his misquotation from the head posting explicitly drawn to his attention, he persists in saying he had not misquoted the head posting.
Those who have already seen the simple calculation that he finds so complicated are already up and running with it. The largest pressure-group in Britain, Fair Fuel UK, circulates thousands of postcards showing the calculation set out as though on the back of an envelope. Politicians are beginning to take an interest.
Therefore, we shall be including that calculation in the material that will in due course be available to governments.
Oh, for Christ’s sakes, M of B. I pointed out to you that what I posted was a direct quote copied from your head posting. Here it is again, cut and pasted:
“Even worldwide net zero would cut 2050 temperature by less than 0.1 C
Our influence on temperature has increased at 1/30th unit/year since 1990, with another 0.9 units by 2050 on business as usual. If all nations went straight to net zero by 2050, 0.45 units would thus be prevented. Unit warming is the ratio 0.46 C per unit of 1.8 C midrange transient 21st-century doubled-CO2 warming to 3.93 units midrange doubled-CO2 forcing. Finally, adjust for the ratio 0.45 C/C of 0.136 K/decade real-world warming to the predicted 0.3 K/decade warming since 1990. Then worldwide net zero would abate <0.463 C: that is, less than 0.1 C.”
Let the reader decide if it is a winning strategy to counter CliSciFi.
Maybe the points must be grouped as beginner, intermediate and advanced? This is how one walks into a meeting to propose a new can opener design and walks out tasked with establishing world peace – in two weeks.
Monckton of Brenchley:
Things are far worse than you imagine.
Implementation of Net-Zero will cause temperatures to SOAR, not decrease, and full implementation is not necessary for this to happen.
The Control Knob of our Climate is NOT CO2, but simply the amount of SO2 aerosols circulating in our atmosphere.
Historically, the early warm periods (Minoan, Roman, and Medieval) were all eras with very few VEI4, or > volcanic eruptions, so that their atmospheres were normally free of SO2 aerosol pollution, allowing the full intensity of the sun’s rays to strike the Earth’s surface.
As a result, there multiple climate-related disasters around the world, such as droughts, famines, heat waves, floods, stormy weather, deceased cultures, atmospheric rivers, etc.
In addition to CO2 from the burning of fossil fuels, they also produce SO2, which cools our planet. Between Net Zero and “Clean Air” decreases in atmospheric SO2, temperatures will inevitably have to rise. Net Zero must be abandoned ASAP.
See: “Net-Zero Catastrophe Beginning?”
https://doi.org/10.30574/Wjarr.2022.16.1.1035
Also “The Cause of Atmospheric Rivers”
https://doi.org/10.30574/wjarr.2023.17.2.0323
And other papers on Research Gate
No one knows what the effect is of rising CO2 on global average temperature. Is it one degree of warming per doubling of plant food in the air or five degrees?
GIGO models show higher and observations less. Probably a beneficial 1.6 degrees, ie slightly positive feedbacks to the no-feedback figure of 1.1 degrees.
I like to stick to basics:
1) The warming effect of CO2 occurs in the troposphere.
2) Each extra unit of CO2 has a logarithmic (decreasing) effect on temperature.
3) Over the 43+ year UAH6 record, CO2 concentrations have steadily increased.
4) UAH6 shows a 0.13℃/decade increase in tropospheric temperatures (NOAA slightly less, RSS slightly more), which takes into account all feedback and other climatic processes occurring over 4+ decades.
5) Future incremental increases in CO2 over the next decades (using reasonable emissions scenarios) cannot reasonably drive temperature trends above the 0.13℃/decade observed as a result of past increasing CO2 concentrations over time; its the rate of temperature increase that matters.
6) All historical climatic data series over 100+ years show no increases in extreme weather metrics.
7) UN IPCC CliSciFi models are junk and grossly overestimate global warming.
Dave Fair makes a good summary of some of the main arguments. The difficulty is that, sound though these arguments are, they have gained no purchase. That is why we shall be asking governments to approach their own climate advisers and ask them to refute the papers we shall send them. When governments realize their advisers cannot answer our points, there is at least some chance that they will rethink their position, particularly now that the cost of climate action is becoming all too horrifyingly visible.
Stop scaring the children with the deception that Methane and Nitrous Oxide spell doom for the planet because they have ‘forcings’ many times greater than Carbon Dioxide.
They don’t. The deception is achieved by comparing on a ‘per ppmv’ basis, without accounting for the actual concentrations of the compared gases. On a ‘per doubling’ basis, Methane has an effect 0.13 times that of Carbon Dioxide and Nitrous Oxide an effect of 0.17.
https://cw50b.wordpress.com/the-methane-myth/
https://cw50b.wordpress.com/the-nitrous-nonsense/
Also that methane and nitrous oxide are each less than 2ppm of the atmosphere, our methane emissions are dwarfed by those of nature, and up until fairly recently millions more bison roamed the US than there are domestic cattle today. If they weren’t a problem then, our cattle cannot be a problem now.
“and up until fairly recently millions more bison roamed the US than there are domestic cattle today. ”
This is not a great or even good argument. It is thrown up and doesn’t float about every three years. Of course, those fairly recent millions are estimates and now there are actual counts of cattle, hogs, sheep, and horses.
I suggest someone do a post on the issue and clarify it. I made a comment a few years ago — likely on WUWT — but personally I am now past the issue.
Cyan’s point about methane is extremely well put. I had not seen it put this way before, and it is very effective. We shall certainly include it. One might add that methane concentration has barely changed since 1990, and that although methane is 23 times more potent as a greenhhouse gas than CO2 it tends to break down rapidly into compounds with far smaller global-warming potentials.
Thank you.
May I also suggest a ‘widget’ like this:
http://cw50b.github.io/
with the right hand thermometer linked to, say, the UAH data and the left hand thermometer linked to the predictions of any of the many models. As the user adjusts the CO2 ‘control knob’, the difference between the models and reality becomes rapidly apparent!
“…methane is 23 times more potent as a greenhhouse gas than CO2…”
_________________________________
Please see my reply to CYAN above. Suppose you give your estimate of how much warming CH4 will cause by 2100.
Duh! my post to CYAN is below (ó¿ò)
“Stop scaring the children with the deception that Methane and Nitrous Oxide spell doom for the planet because they have ‘forcings’ many times greater than Carbon Dioxide.”
I don’t think that you are really scaring the children, considering the amount of “hippy crack” being inhaled and methane being generated by the little dears!
The usual statement is:
Methane traps 86 times more heat than carbon dioxide.
The proper response to that should be, “So what?” It’s a “Cause and effect statement” without the effect. The statement should continue on to say:
and will cause [so many] degrees of global warming by
[such and such date]
But climate science and the media never say how much by when.
By 2100 methane might cause an increase of maybe as much as 0.05°C.
If anyone claims it’s more than that, they need to show their work.
From WattsUpWithThat last Septermber:
50 Reasons to Re-Think Climate Policy
Brevity rocks. My suggestions:
1. Warmer Is Better.
Warmth is a boon and a blessing. Life needs warmth. Ice is death. The Earth has almost always been warmer than it is today. More warmth should be appreciated, not feared.
2. CO2 is the fundamental building block of Life.
Every carbon atom in all carbon-based life forms (including people) came from CO2. It is the Gas of Life, the Source of Green. The Earth has almost always had more CO2 than it does today. More CO2 would be a boon and a blessing.
I agree with Mike Forester that brevity is the soul of wit. However, if our list is to have enough teeth to prevent the profiteers of doom from simply brushing it aside, we need to ensure that there is a necssary minimum of scientific meat on the bones.
I can back up my claims with mountains of scientific evidence, but I prefer to cut to the chase.
The Profiteers of Doom, at any rate, are impervious to evidence, mountainous or minimal. They brush any and all aside — including your cogent and detailed analyses, sir.
Nothing is gained by internecine squabbles and nitpicking among the “skeptics”. The war is raging now. We must man the battlements with whatever we’ve got. All hands on deck, etc. The goal is to win hearts and minds, not eruditional divarications.
When dealing with governments, hearts and minds arguments don’t work. It will be necessary to show them that there is no need to do anything about global warming, no point in doing anything, and an excessive cost for negligible benefit.
“Warmer Is Better.” Yes!!!