Dr. Susan Crockford,
Despite rhetoric to the contrary, there is still plenty of sea ice over Arctic regions this summer, supplying feeding platforms for polar bears, ice-dependent seals, and walrus cows nursing their young calves. Forget about whether the numbers are below or above some short-term average, there is no catastrophe in the making for marine mammals in the Arctic at this time.

Remember, by early summer, young seals have left the surface of the ice and are in the water feeding; predator-savvy adults and subadults are hauled out on broken chunks of ice moulting their hair-coat. They may look like sitting ducks but polar bears have a hard time catching them because the seals are vigilant and have many escape routes available (due to all the open water). Most polar bears in Hudson Bay are still on the ice (you’ll see why below): the live cams near Churchill set up to watch polar bears are presently showing images of ravens with sea ice in the background, not bears.
This post is predominantly sea ice charts for mid-July, what we in the science field call observational evidence, aka ‘facts’. Keep in mind that satellites used to produce these images have an especially hard time distinguishing ice topped with melt water from open water, which means much more ice useful to these marine mammals is almost certainly present than is shown in the charts (as much as 20% more in some regions).
Arctic-wide levels, NSIDC Masie
For 13 July 2022

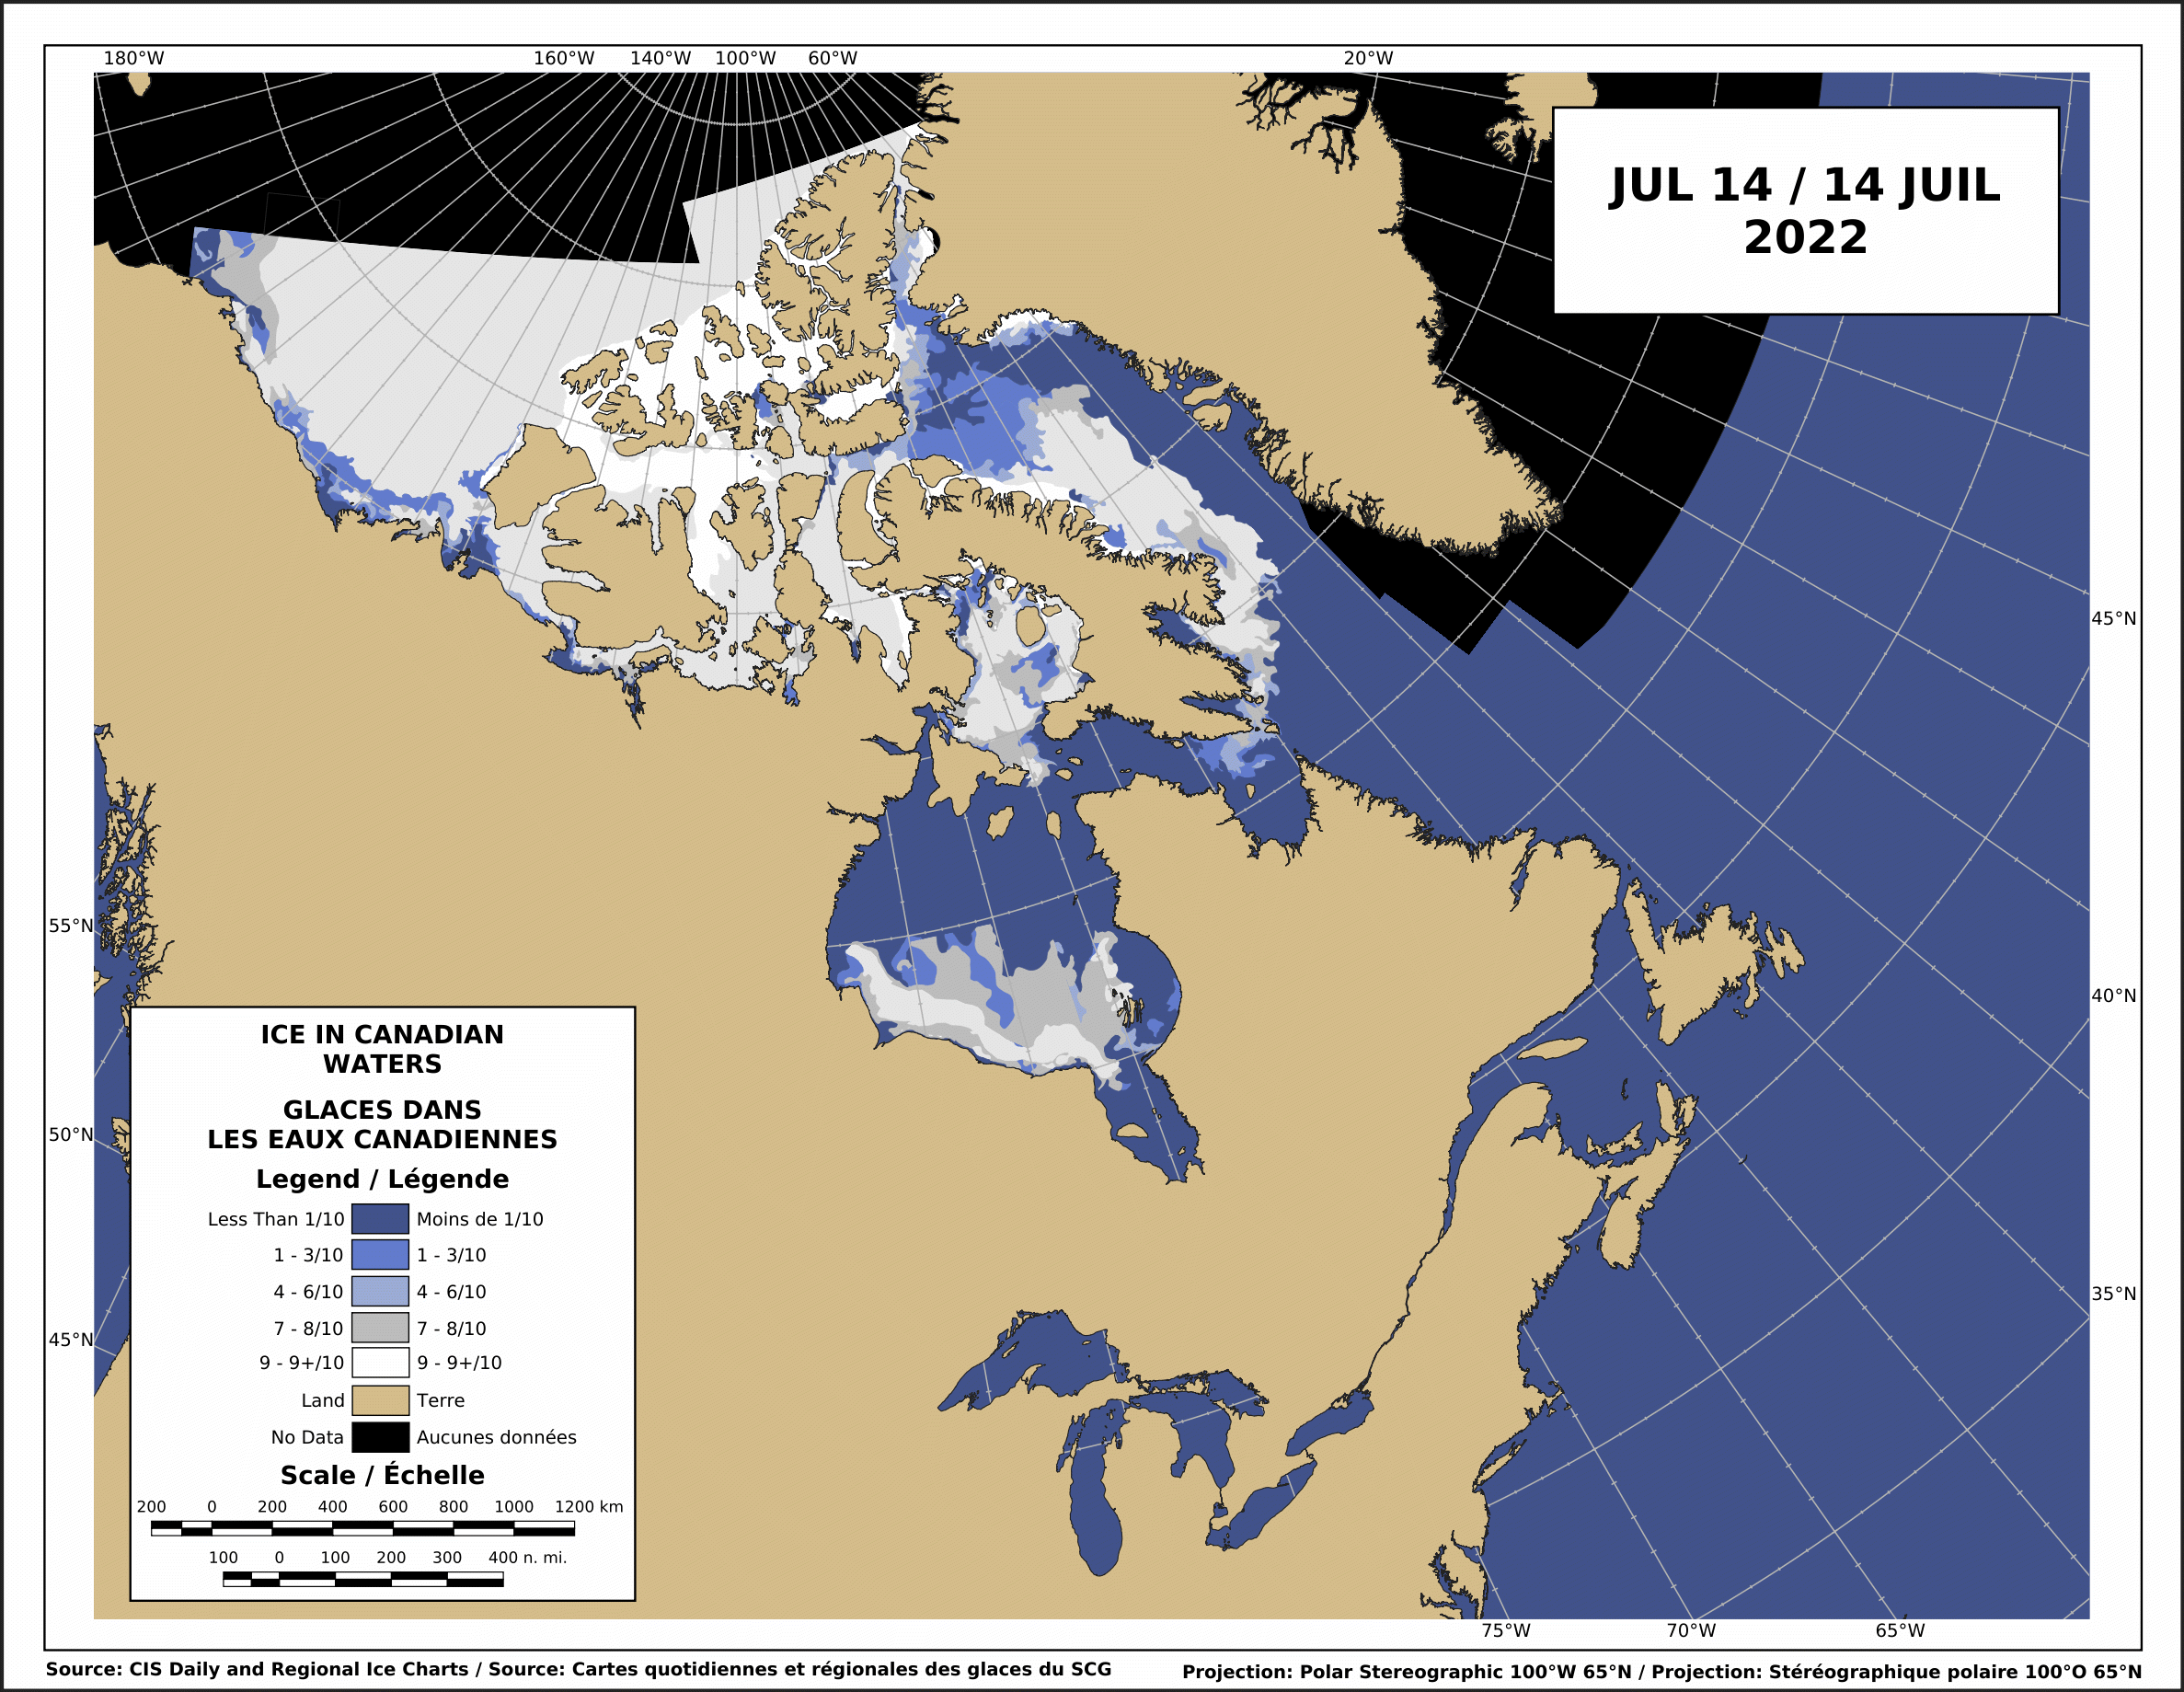
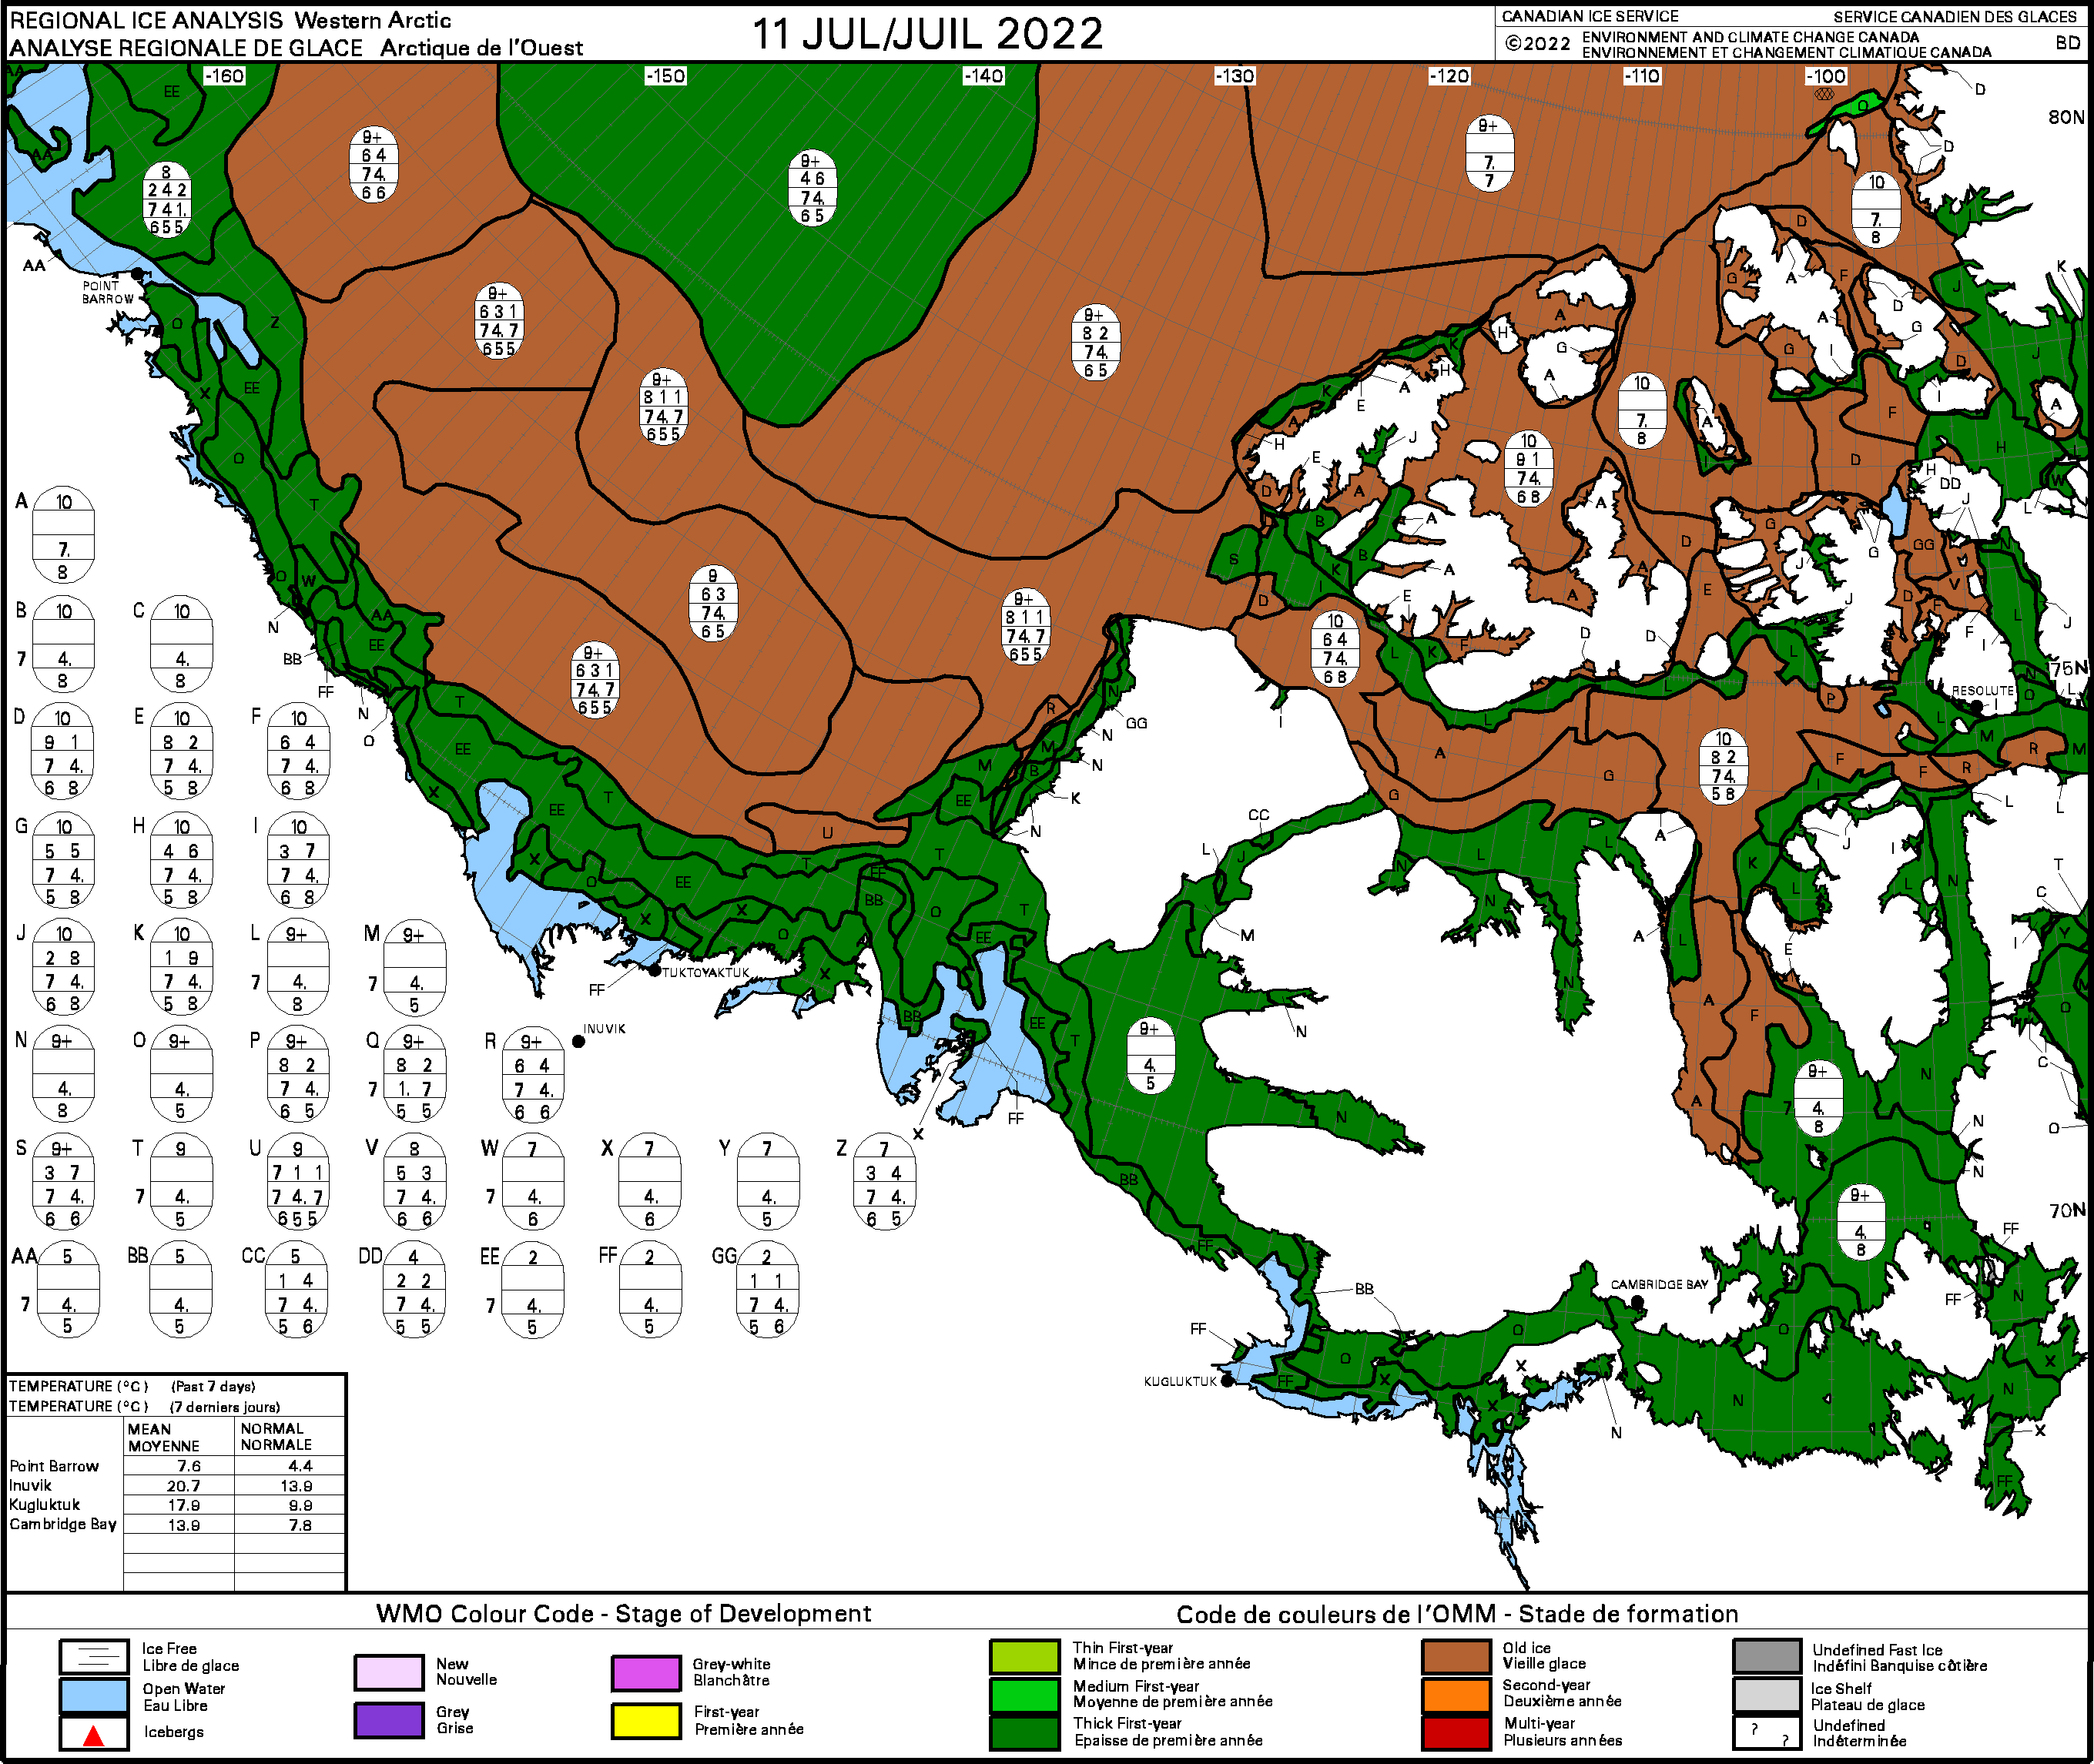
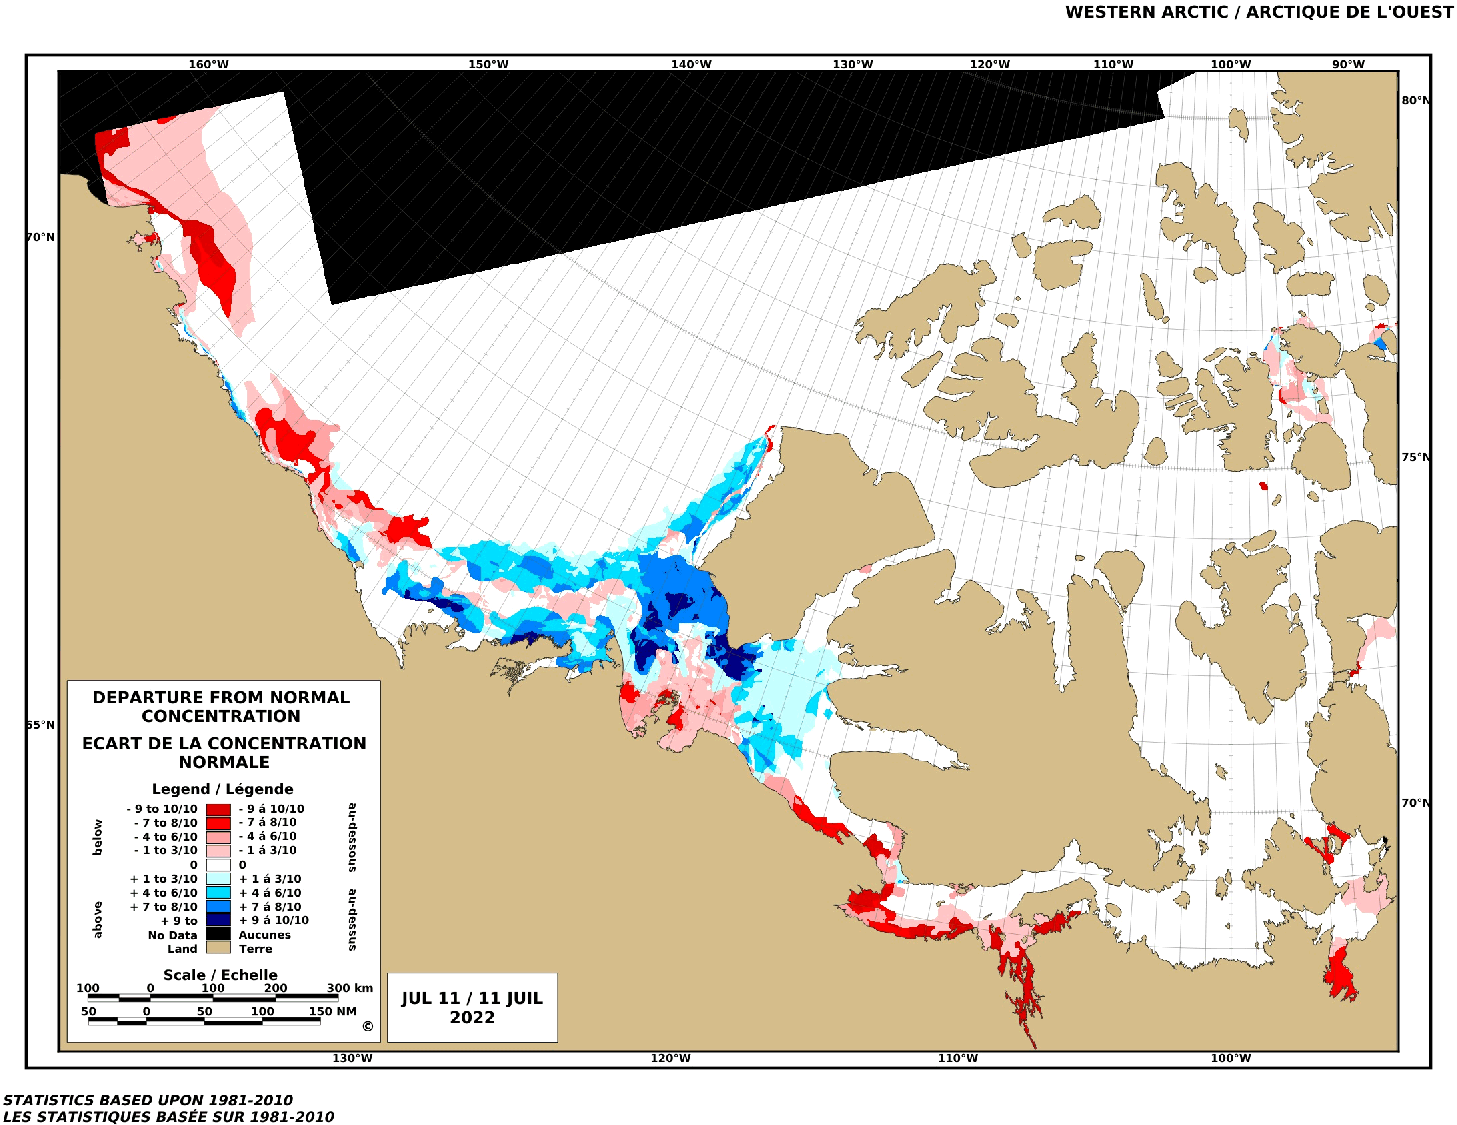
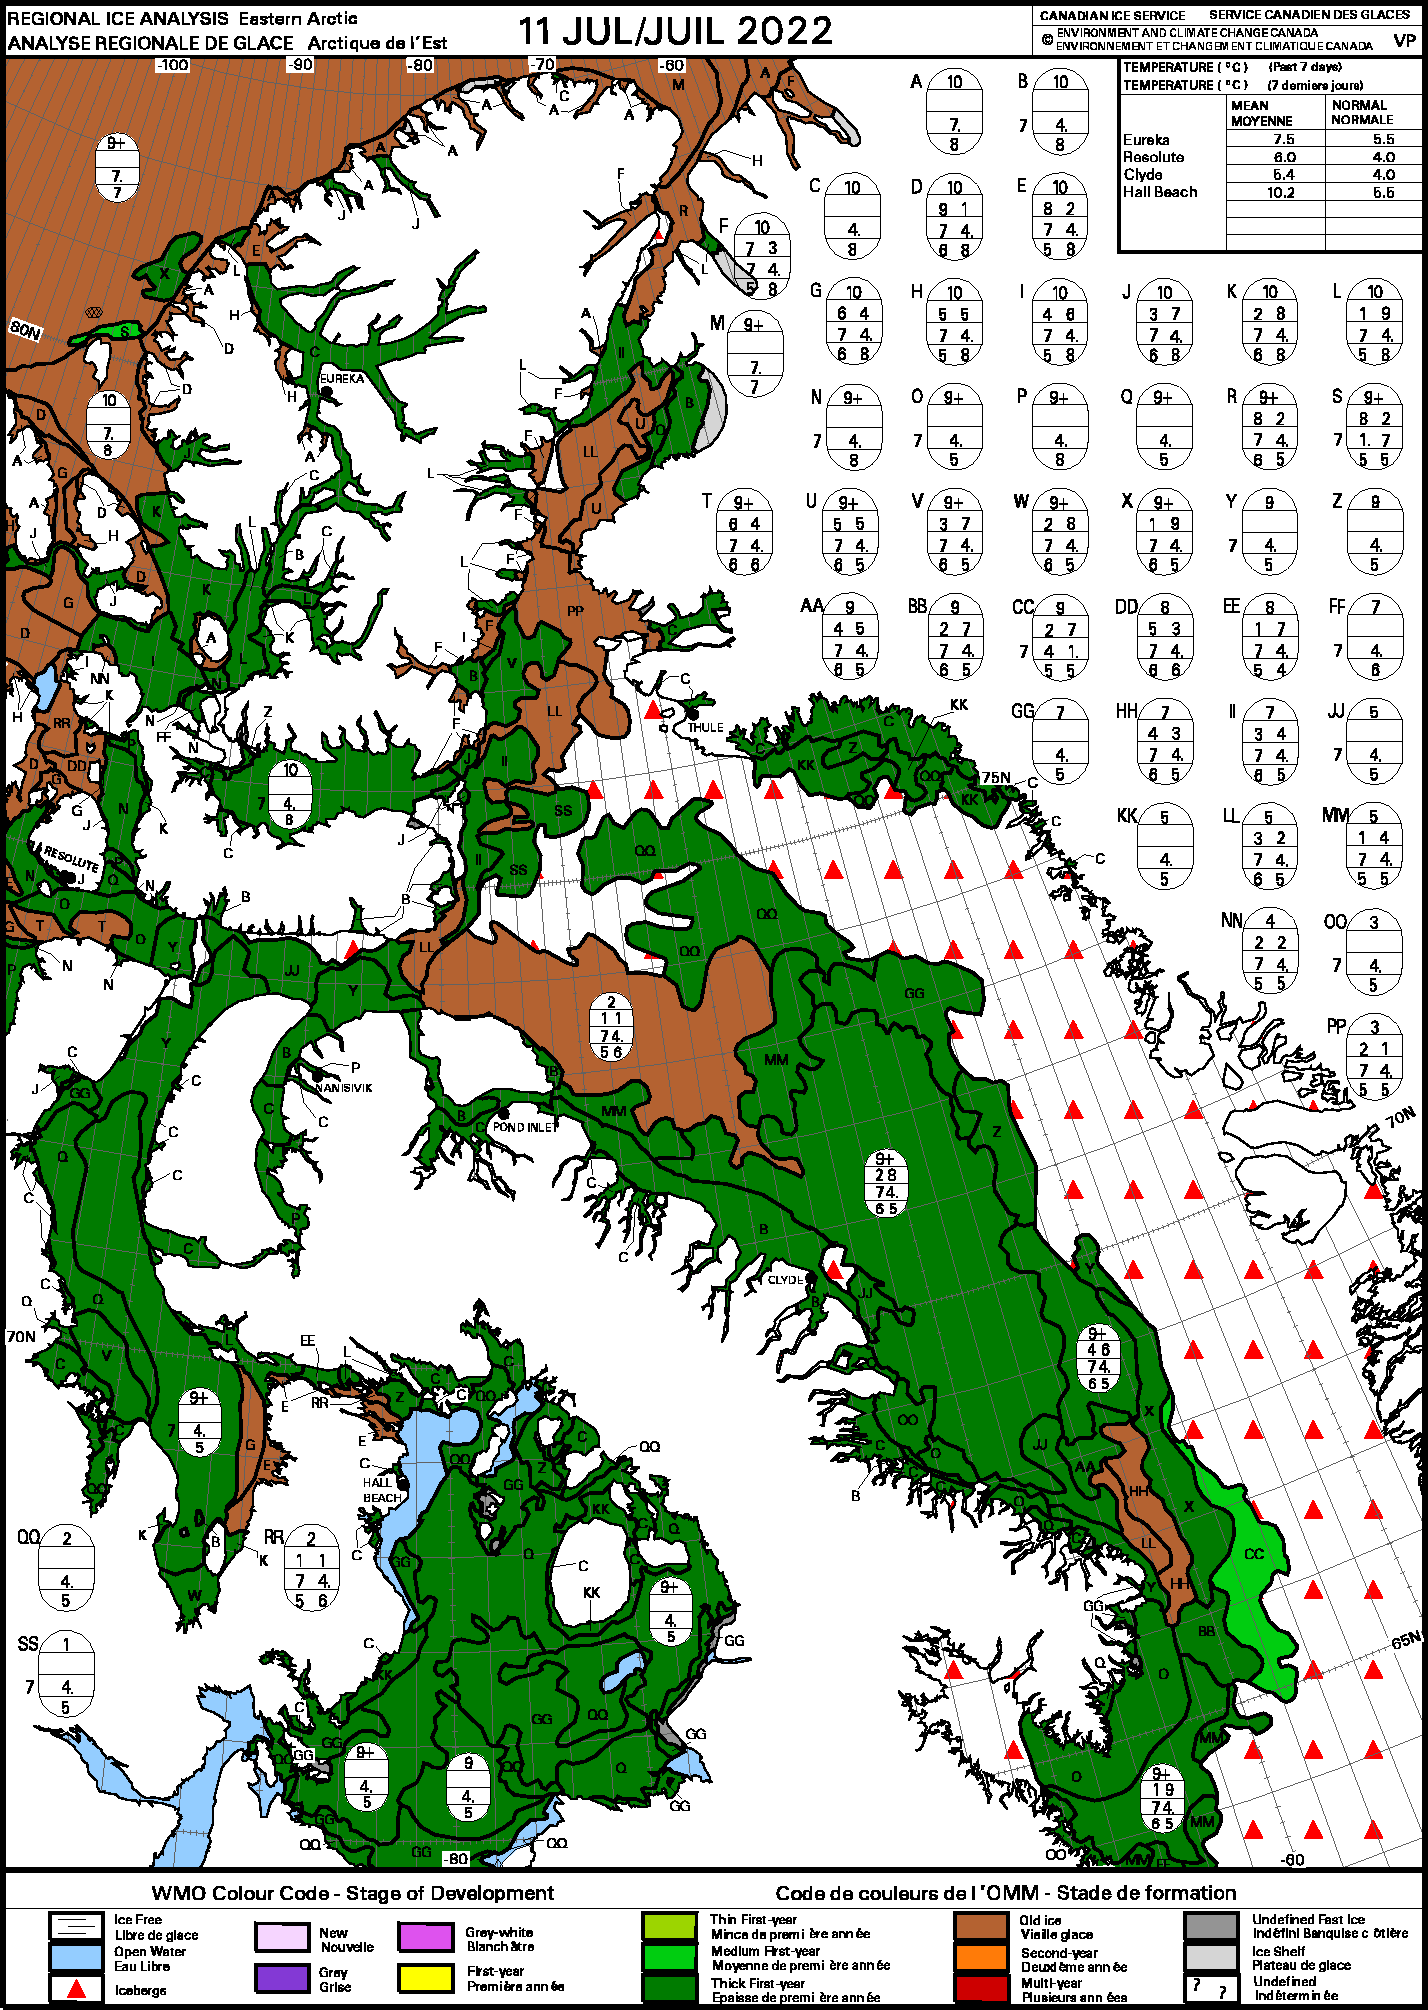
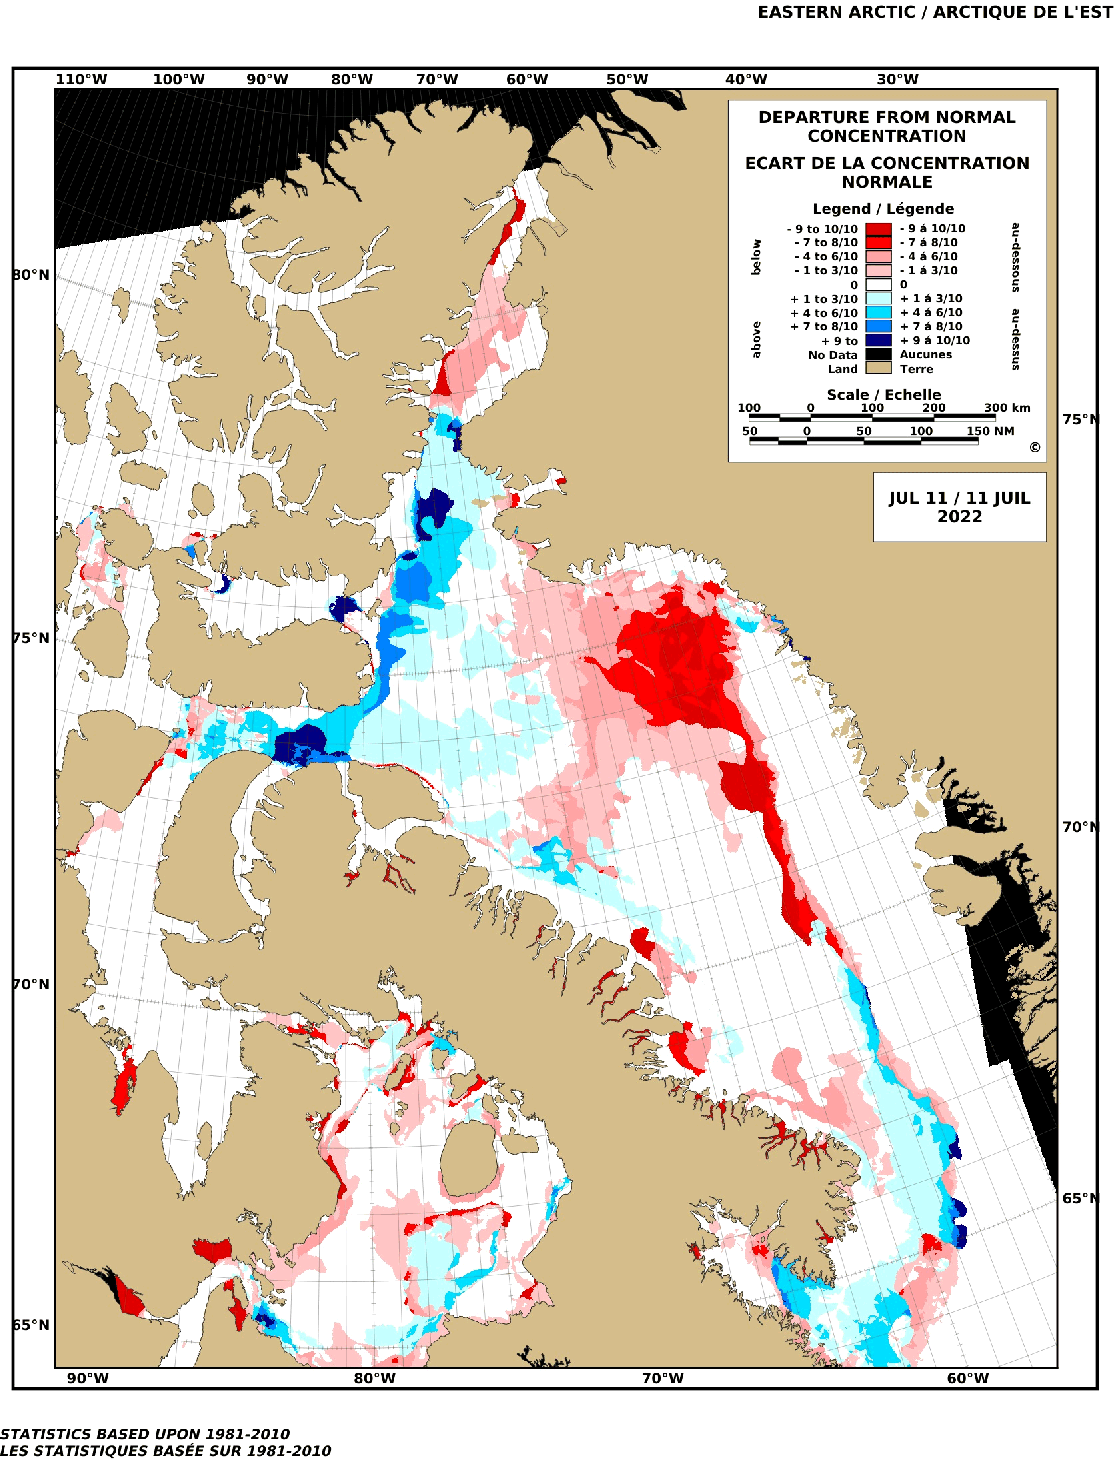
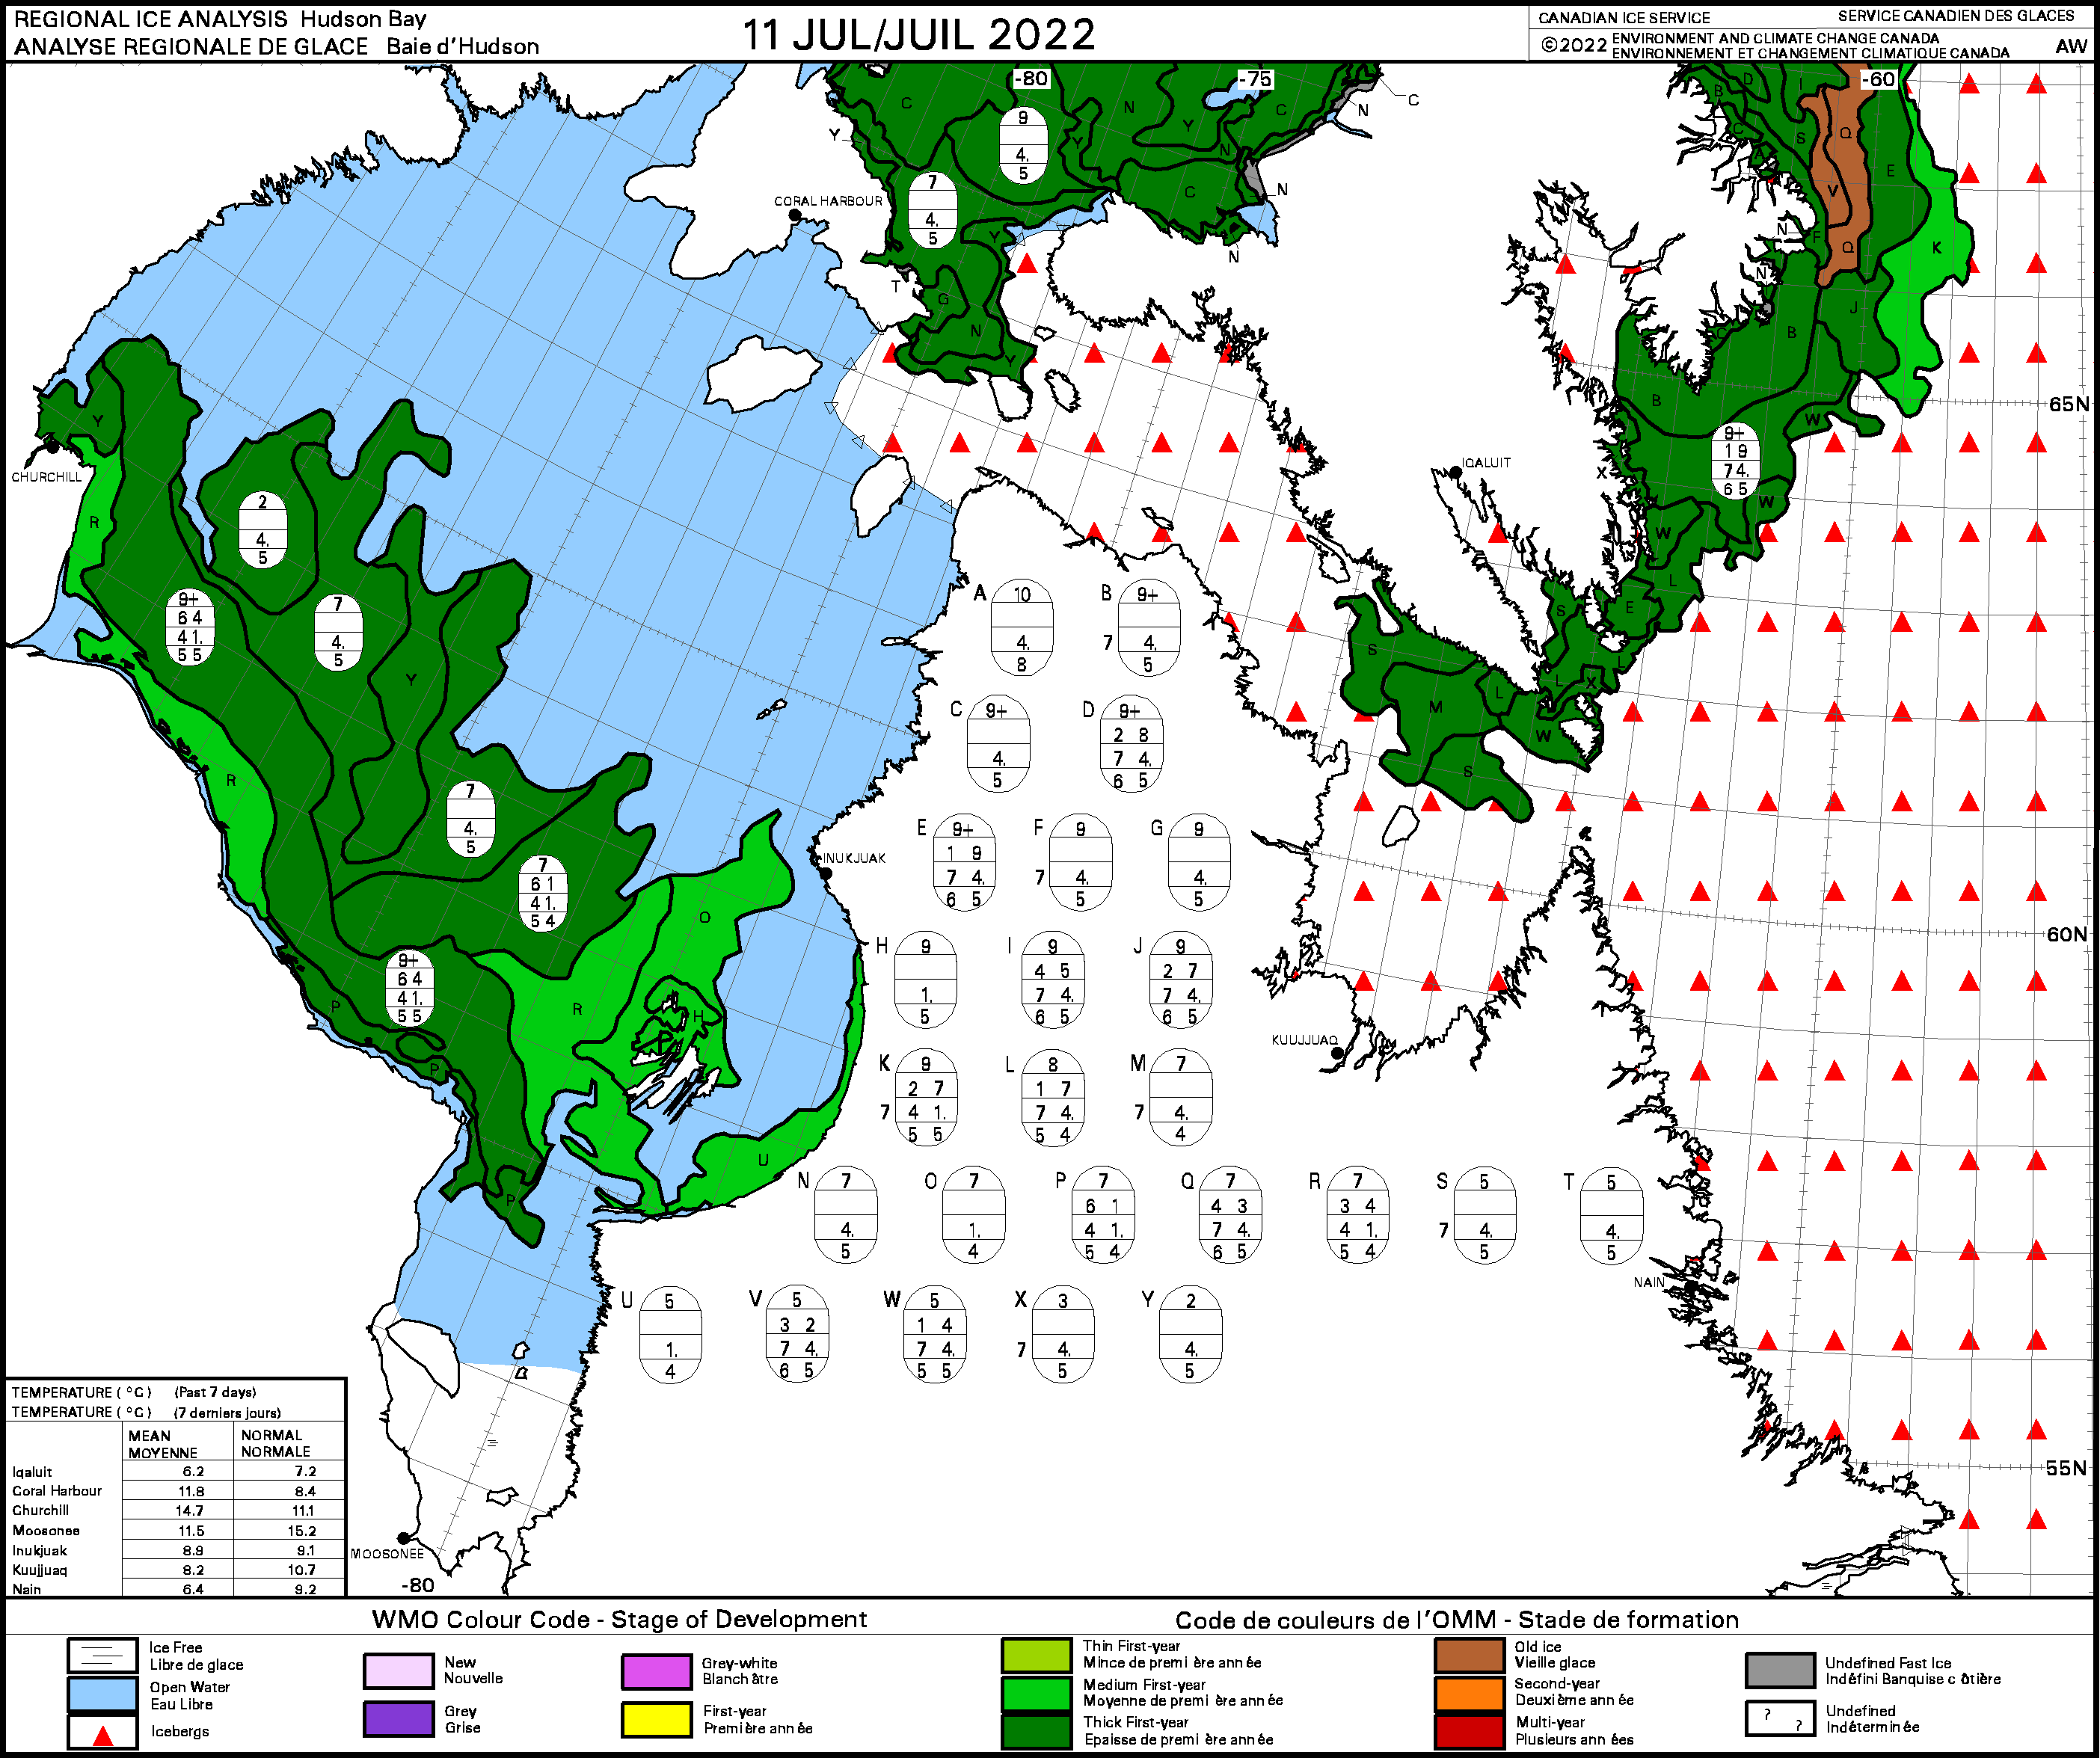
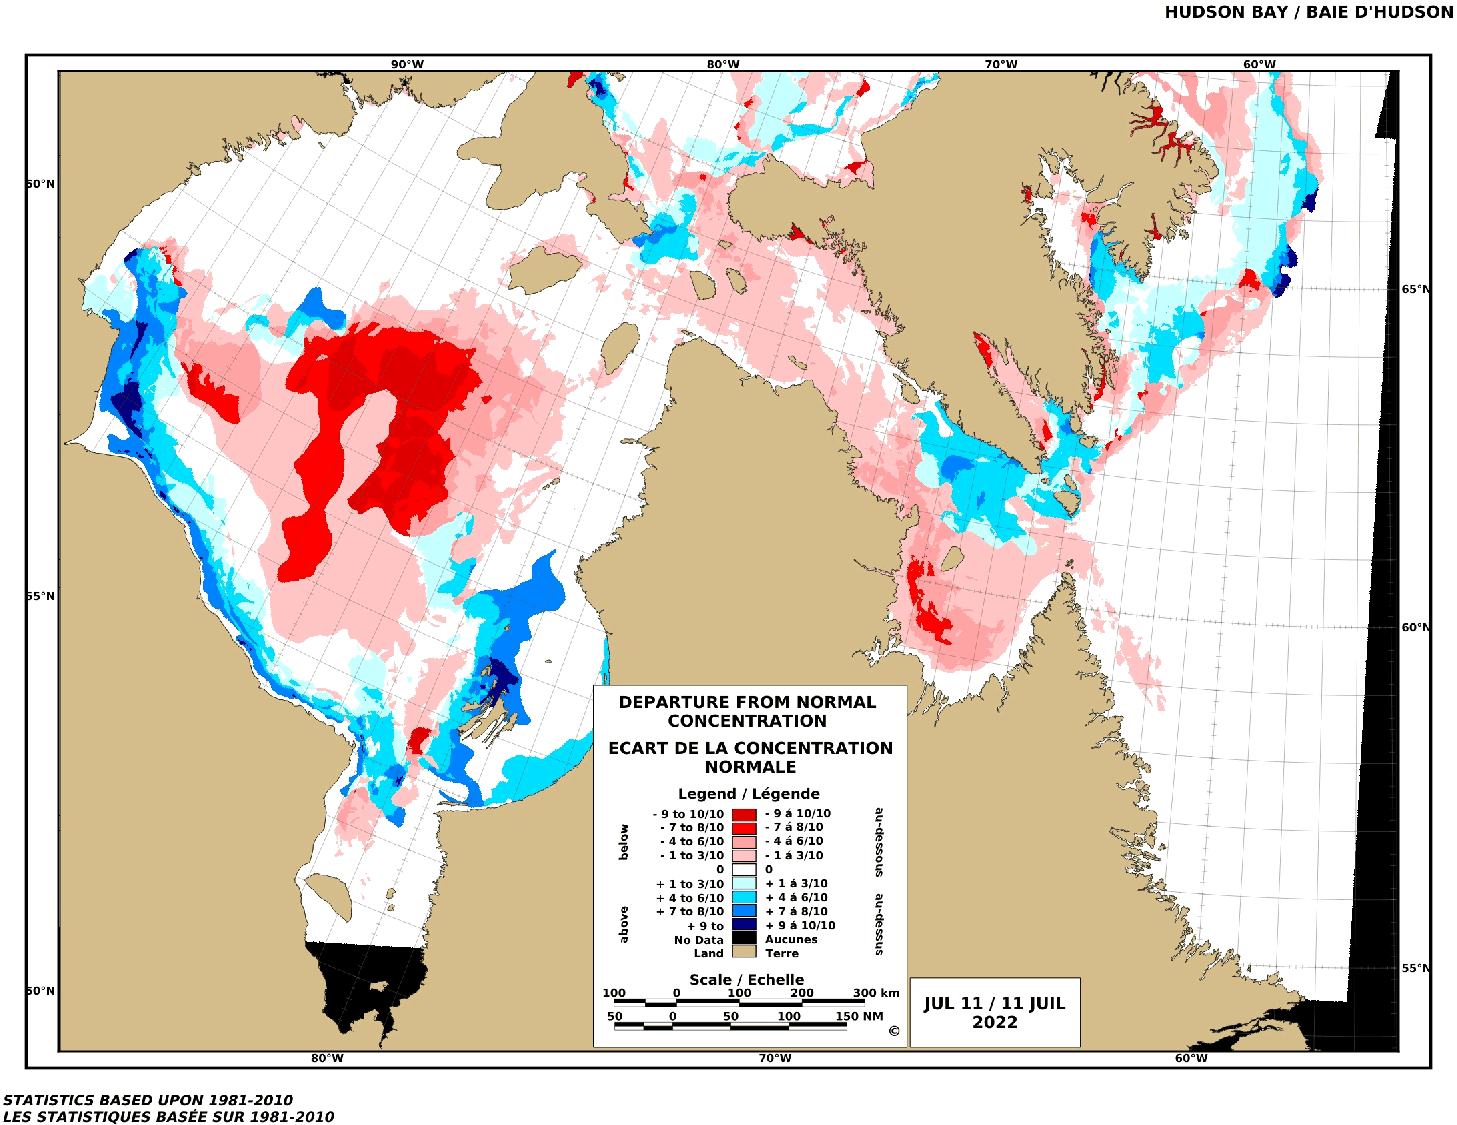
Canada (entire and then by region), Canadian Ice Service
Note that regional charts are for the week of July 11, shown here by ‘stage of development’ (ice thickness, with brown being old, multiyear ice and dark green ice >1.2m thick) and in the ‘departure from normal’ charts, dark blue is much more than average and dark red is much less.
Svalbard, Norwegian Ice Service

Chukchi/Beaufort Seas, Alaska Sea Ice Program
By stage of development and then, concentration:


Imagine that! Arctic is still covered in ice and snow, just like it always has been.
Al Gore said in 2009 that “the North Pole will be ice-free in the summer by 2013 because of man-made global warming.”
There are a lot of colorful charts.
Not very useful
At my climate science blog.
I presented six useful charts on Greenland ice mass
and Arctic sea ice extent yesterday:
Honest global warming chart Blog: Greenland ice mass (chart 1, 2 and 3) and Arctic sea ice extent (chart 4, 5 and 6) = no climate emergency ! (elonionbloggle.blogspot.com)
Thanks. Logical flow from chart to chart.
Top chart- CO2 levels dip during the 30s. Having to squint to see the 1C-1.5C
temp rise over the past 140 yrs adds much needed perspective. The temp doesn’t
stay warmer until 1981 with CO2 @ur momisugly 350ppm (usual correlation/causation warning)
Chart 4- In most yrs since 2005, the warmer winter months were followed by
average/cooler summer months which destroyed the overly optimistic open Arctic
predictions. (Archives on the left)
http://ocean.dmi.dk/arctic/meant80n.uk.php
Charts 5 & 6- The minimum Arctic sea ice levels vary much more than the maximum
levels. One factor rarely mentioned with minimum levels is that late summer
storms can blow ice into the N Atlantic.
Thanks again.
What’s interesting about that DMI Arctic temperature chart is how long the temperature has been below the 1958-2002 Mean, getting on for 3 months.
Greenland has been defying the experts again this year.
http://polarportal.dk/en/greenland/surface-con
” Greenland has been defying the experts again this year. ”
2022’s SMB is indeed very high.
But let us wait about a month until saying something useful:
Between 2018, the highest, and 2012, the lowest since 2011, there is still some warm place in between for the joungest child.
Did you realize that DMI posts Arctic data above 80N?
Arctic starts for example in the UAH record at 60N:
Maybe that speaks to you a little bit…
This can’t be right. I’m sure the climate experts told us the Arctic ice cap melted sometime back in 2014-2015.
/sarc
Quite sure, Paul. It’s to be so balmy, I had planned on swimming the Northwest Passage stark nekkid this Summer.
Sadly, I had to postpone that lark as I had already scheduled a pedicure appointment.
But ever onward and upward. Tally ho! I shall put that on the calendar for next year.
/sarc^2
Be sure to wear a fir codpiece.
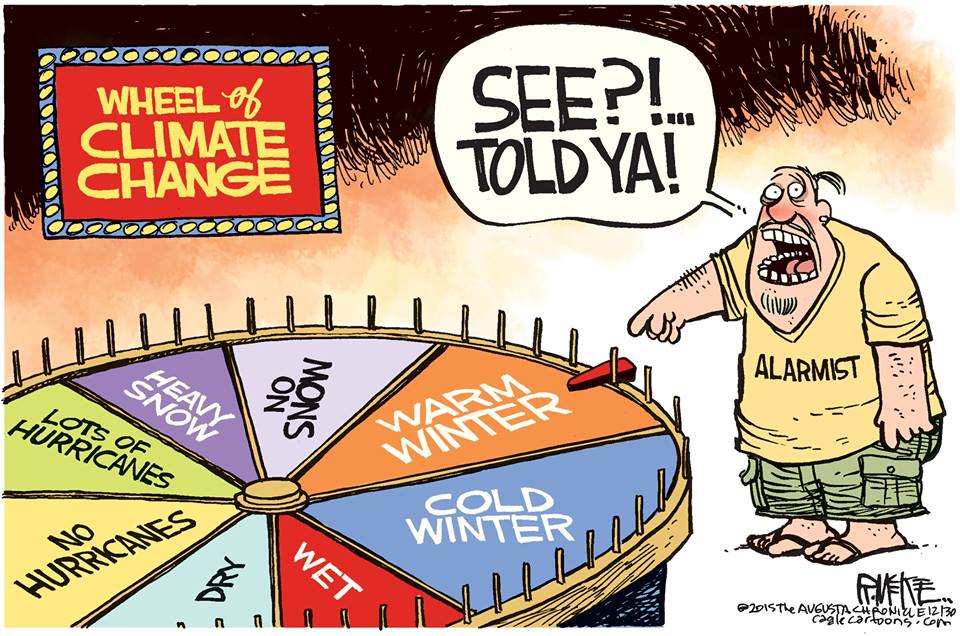
Arctic sea ice will be “canary in the coal mine’ – an early warning of the coming falsification of the AGW hypothesis.
The AGW hypothesis is constructed in such a way that it can’t be falsified. Which means it’s not real science.
If the Arctic froze solid in the summer, and the Great Lakes iced totally in the winter, that would be presented as proof that it is worse than we thought.
AGW can’t be falsified because it can’t be measured. There are too many climate variables to know what percentage is man made/
Very unlikely to be 0% or 100%.
CAGW can’t be falsified because it is always “coming” in the future.
It has been coming in 10 to 20 years for the past 50 years.
And always will be coming on the future.
You can’t falsify predictions of the future when they are made.
You can point out that 100% of dismal environmental predictions
since the 1960s have been wrong. The media ignores that fact
and so do schools, so few people seem to know, or care.
Always wrong predictions of the future climate are not science
They are climate astrology.
cartoonist Rick McKee has it sorted…
“The AGW hypothesis is constructed in such a way that it can’t be falsified. Which means it’s not real science.”
It is falsified by real science. 12-month average changes in CO2 don’t correlate with MME, but they correlate significantly with 12-month changes in SST. Of course, not all the CO2 was outgassed, we are responsible for some CO2 but the ocean handles what the flora doesn’t use for more beneficial planetary greening.
AGW supporters only see the top plot and refuse to learn any deeper meanings.
Furthermore I can and often show the 30y HadSST3 correlates with the 109y SN with an 11y lag, r=.95, greater than 99% significant, so AGW is completely falsified.
Climate change is caused by solar variability. Rising CO2 is an after-effect.
Antarctica temperatures and sea ice are doing a good job.
Artic sea ice extent used to be the canary in the coalmine (poster child) for global warming. And those pesky polar bears too … in reality. they are doing better than ever. and they are great swimmers too, but those facts were never mentioned.
My poster child for the actual global warming since the 1970s
is warmer winter nights in Siberia, about which no one is complaining.
Not even polar bears.
“Antarctica temperatures and sea ice are doing a good job.”
Yes, looks like Antarctic sea ice extent will be an all low this season, already lowest minimum and looks like being a lowest maximum.
You might want to consider record low Antarctica temperatures in winter 2021, or does your memory not extend back that far?
After being a NEW RECRD HIGH!!! in 2014.
Of course that is as measured starting in 1979.
What a crock. How old is THE CLIMATE??
Mostly agree with the replies, but still, when the (completely natural) multidecadal warming reverses, it will be impossible to ignore it. And I stand by my prediction – it will be Arctic sea ice that reverses first and it’s hardest to manipulate. Just from the latest Nature paper, which btw is interesting:
“The recent weakening and reversing of several NH-climate trends, despite the ongoing anthropogenic forcing, has increased the interests in understanding and predicting the decadal-to-multidecadal climate variability.”
https://www.nature.com/articles/s41612-022-00275-1
As I read the article, even with the identified cyclical coupling of NH phenomena (ala stadium wave), their climate model runs still predict long-term anthropogenic global warming. What a waste of good observations by polluting them with CliSciFi modeling.
Darned. The Summer Arctic ice is NOT behaving as modeled. The Arctic animals like walrus and polar bear rejoice. The Arctic warmunist alarmists despair. OK
Don’t worry Rud, the data will be adjusted to fit the models
I checked the NSIDC Arctic Ice Extent data and this year’s Arctic Sea Ice Extent is currently ranked the 11th lowest, which really doesn’t fit the Leftists’ catastrophic narrative…
According to one debunked prophesy, it’s summer Sea Ice Extent should have been zero by 2012… Not so much….
https://nsidc.org/arcticseaicenews/charctic-interactive-sea-ice-graph/
Just wait until the AMO reenters its 30-year ocean cool phase by around 2025, and it’ll slowly increase back to 1990’s levels over the next 30+ years.
Per NSIDC Arctic sea ice extent the 1991-2020 average for July 13th is 9.00e6 km2. The value for 2022 is 8.64e6 km2. Arctic sea ice extents are below average this year.
Great news for the prey- they’ll have more open water to dive into when fleeing
vicious, racist white polar bears!
Is it possible to always be above average?
ht/ Garrison Keeler
Probably. But I should point out that Arctic sea ice extents for July 13th have been below average for 22 consecutive years.
Not without a link you can’t.
https://masie_web.apps.nsidc.org/pub/DATASETS/NOAA/G02135/seaice_analysis/
So in the data you provided 5 of the last 20 years are over the average you provided, WHAT?
I standby what I said. Arctic sea ice extent for July 13th has been below average for 22 consecutive years. Download Sea_Ice_Index_Daily_Extent_G02135_v3.0.xlsx and check row 196 on the NH-Daily-Extent tab.
So things are going along pretty well as before.
EXCEPT – the climate forecasters had Arctic-free summers by now?
What’s up with that?
The IPCC predicts the first excursion below 1e6 km2 of extent around year 2050.
The forecasts you are probably looking at are inconsistent with the abundance of evidence. Actually, most of the forecasts for “ice-free” conditions by now either come from those who have no understanding of ice dynamics (like Al Gore) or who were misrepresented (like Maslowski).
So why doesn’t NSIDC update their graphs to show median ice data for 1991 to 2020 instead of 1981 to 2010? After all the climate fraudsters have identified climate as a 30 year average. They haven’t switched because it makes the fraudsters case look weaker. How much has sea ice in the Arctic since 2012? See , we can play this game too.
Call me a skeptic: “So why doesn’t NSIDC update their graphs to show median ice data for 1991 to 2020 instead of 1981 to 2010?”
MASIE data only goes back to 2006. Neither 1981-2010 nor 1991-2020 are used by the MASIE products or even possible to derive. Note that the author of this article is using the MASIE data.
Call me a skeptic said: “How much has sea ice in the Arctic since 2012?”
I’m not sure what the question is exactly. I can say that according to NSIDC MASIE the 2012 average is 10.69e6 km2. The trend since 2012 is -0.16e6 km2/yr.
You can download the data the author used here.
So?
The extent of sea ice is just a measure of the extent of sea ice, it doesn’t say anything about why
Stating it’s CO2 is just conjecture.
I would not call below average “Abundant”.
I don’t care what you would call it
I care about the reasons for ice loss – without evidence stating it’s CO2 is just conjecture.
The article claimed that sea ice was “quite abundant” for July 13th.
And?
Where is your empirical evidence linking CO2 with sea ice loss?
If you don’t have any, your whole statements are moot.
Redge said: “And?”
I would not call below average quite abundant.
Redge said: “Where is your empirical evidence linking CO2 with sea ice loss?”
The IPCC AR6 WG1 Physical Science Basis always a good starting point for drilling down into the evidence. They have an extensive bibliography.
Anyway, are you suggesting that “quite abundant” can be assigned to a quantity if that quantity is not linked to CO2? Is the amount of water in Lake Mead “quite abundant” right now?
You don’t get away with asking me to do your homework
Which specific part of AR6 WG1 demonstrates unequivocally CO2 is the cause of sea ice reduction.
No unsupported declarations – hard, empirical data
I won’t hold my breath.
Redge said: “Which specific part of AR6 WG1 demonstrates unequivocally CO2 is the cause of sea ice reduction.”
All of it. Unfortunately there is so much evidence now it can only be summarized at a very high level with a 2000 page report. But the content is approachable even for those with only a high school level of science understanding. It is a pretty easy read actually. You can get through it in a few months. It is certainly better than reading through the millions if not hundreds of millions of pages of literature and data on the topic which no single person could get through in a lifetime.
If you have specific questions regarding the link between CO2, global warming, and cryosphere heat uptake I might be able to point you more narrowly.
I’ve already stated my specific questions. I’ll ask again:
Where is your empirical evidence linking CO2 with sea ice loss?
Which specific part of AR6 WG1 demonstrates unequivocally CO2 is the cause of sea ice reduction.
Name the peer-reviewed literature, ideally with links.
You won’t. You’ll just hand wave as you and your ilk always do.
WUWT won’t let me copy the list or link direct. But here are the page numbers containing the citations for the peer-reviewed literature you requested.
IPCC AR6 WG1 Physical Science Basis
pg. 250-280
pg. 382-422
pg. 521-551
pg. 646-672
pg. 779-815
pg. 897-921
pg. 1026-1054
pg. 1159-1210
pg. 1322-1361
pg. 1464-1512
pg. 1706-1758
pg. 1877-1925
pg. 2027-2058
pg. 2077-2085
pg. 2121-2137
pg. 2150-2151
pg. 2180-2192
pg. 2200-2204
pg. 2213-2214
pg. 2255-2256
You’re just giving a bunch of references without having a clue which one paper you think states unequivocally CO2 is the cause of sea ice melt.
That’s BS, I can do it, so can you
https://www.ipcc.ch/report/ar6/wg1/downloads/report/IPCC_AR6_WGI_Chapter01.pdf
I’ll ask yet again:
Where is your empirical evidence linking CO2 with sea ice loss?
Which specific part of AR6 WG1 demonstrates unequivocally CO2 is the cause of sea ice reduction.
Name one peer-reviewed paper – I’ll give you a clue: there isn’t one
I’m giving you a bunch of references because there is a bunch of evidence. There isn’t just one line of evidence supporting the link between CO2 and cryosphere heat uptake; there is tens of thousands. And that’s only the 1st order lines of evidence cited by the IPCC. If you include 2nd, 3rd, etc. order citation it quickly expands to millions. Some of these lines of evidence are only indirectly and tangentially relevant. Others are more directly relevant. But it’s all relevant and linked in some way because the climate system is a complex and interconnected system that is itself interconnected with other aspects of the world around us.
Are you asking for a single source that summarizes the knowledge and understanding of the topic today? If so I believe the best starting point is the IPCC AR6 WG1 report. All of it. You must review it in its entirety before drilling down into the minutia of details.
Are you asking for my recommendation for the 1st piece of evidence chronologically that I think you should look at? If so and assuming you aware of evidence of fundamental laws of physics like classical mechanics, quantum mechanics (yes it is relevant), thermodynamics, etc. from which the link between CO2 and climate (and ultimately cryosphere modulation) is based. I believe Pouilett 1837 would be a good place to start chronologically since it is the first publication to hypothesize CO2’s effect on the planet in the context of climate based on the evidence available at the time. Some would argue that I’m ignoring Fourier 1822 here. But I feel like the evidence he presents can be skipped since it does not mention CO2 directly.
Link to a single paper showing a direct link between CO2 and sea-ice loss.
Redge said: “Link to a single paper showing a direct link between CO2 and sea-ice loss.”
My answer hasn’t changed. IPCC AR6 WG1.
Just to be clear:
The paper needs to present empirical data, not a climate model fantasy
Redge said: “The paper needs to present empirical data, not a climate model fantasy”
My answer still hasn’t changed. IPCC AR6 WG1.
So you don’t have one single paper showing empirically a direct link between CO2 and sea-ice loss
Thanks for admitting that
Redge said: “So you don’t have one single paper showing empirically a direct link between CO2 and sea-ice loss.”
Not one; tens of thousands. But, like I said, if you want a one stop shop for the summary of what is available I recommend IPCC AR6 WG1. That is a “single paper” if that is important to you.
Name one of the tens of thousands, just one
Note the IPCC doesn’t produce any papers as they themselves state
Al Gore said in 2009 that “the North Pole will be ice-free in the summer by 2013 because of man-made global warming.”
You should base your worldview on the abundance of evidence; not Al Gore.
Really?
So why did the Nobel Prize people award him?
Why did the UN jump on board with promoting Al’s slideshow?
So many questions Grasshopper . . .
Yes really.
I have no idea why Al Gore was awarded a Nobel Prize. I didn’t even know he was a recipient.
I have no idea why the UN jumped on board with promoting his slideshow. I didn’t even know they did.
Yes, there are a lot of question. For example, why did the abundance of evidence and IPCC consistently underestimate Arctic sea ice declines? Was the extreme decline in the last 15 or so years a transient anomaly or a new normal?
The Arctic was seasonally ice-free during the Holocene Thermal Optimum 5-7000 years ago, at a time when CO2 was much lower than today.
Would you say sea ice was “quite abundant” back then?
Apparently it was also a shock to the world back in about 1922 when the Arctic fishing fleet reported balmy conditions up there.
“Unprecedented” warm conditions they probably described the situation as.
So you’re saying, Al Gores’ “An Inconvenient Truth” was a lie?
So, not ice free. In complete opposition to what the “experts” had told us.
Why do you still listen to these supposed experts?
Actually the IPCC predicted the first excursion below 10.5e6 km2 for annual average extent would not occur until 2040. It actually occurred in 2007 and several times since. The experts have been consistently underestimating the decline for decades now.
And as of right now the abundance of evidence still suggestions the first “essentially ice free” (< 1 e6 km2) condition at the summer minimum would not occur until 2050. See IPCC AR6 for details.
Oh, come on: Wadhams et al have been predicting the end of ice for ages now and keep having to revise their predictions whenever they get it hopelessly wrong. The problem is, the media latch on to these ridiculous predictions and ramp up the fear, as you well know.
2050 is a handy prediction: most of the members of the IPCC will be long dead when the ice still there in 2050 and they won’t be there to defend their stupid hysteria.
Besides, prove the decline in sea ice isn’t part of perfectly natural variation – you can’t.
Wadhams 2012 predicts an “ice free summer” (< 1e6 km2) before 2042.
I should also point out that Wadhams does not provide the abundance of evidence. His research represents but a very small portion of the available evidence.
Alarmist, which definitely includes IPCC climate predictions are pure fantasy. Press release and political climate predictions without any real basis in reality.
2050 alarmist climate predictions are fantasies meant to drive headlines to keep the green money trough flush with cash.
Dr. Crockford accurately states:
No amount of budgerigarwx’s ‘Arctic average’ games changes the 2022 Arctic situation.
The Bering sea ice extent was since last fall and currently is well above average. https://www.knom.org/wp/blog/2022/02/23/bering-sea-ice-reaches-st-paul-for-a-week-now-recedes-north/ See for your self. The article blames the weather for the increased Bering sea ice extent. Also see http://ocean.dmi.dk/arctic/meant80n.uk.php which demonstrates the average Arctic day time temps are trending lower than average. So it is just weather or an actual climate trend is anybody’s guess. For anthropomorphic climate change people weather is always an indication of climate change, for the rest of of it’s just weather.
I tried to post the most current Bering sea ice graph that compares with the average. It just would not go. So if you go to Rick Thoman with ACCAP, for Bering sea ice extent you will find the graph in there.
I see that. If being below average is “quite abundant” then what do we can call being above average?
Absolutely abundant! Ice extent is absolutely abundantly variable as the weather. It can demonstrate massive expansion beyond the average in one region in any given year and recede in all the other regions any given year. The key is to watch the trends long term. Our current record is less than 70 years.. This is my beef. In 2017 I did a poll at work of 65 staff members. ‘Is there an ice cap in the arctic?’, 94% of the staff said “no”. with a request to comment. The vast majority said global warming had wiped out the ice cap. They didn’t believe their eyes when I sent them a satellite graphic of that day’s ice extent… it was in July. This is the power of misinformation and irresponsible prima facie predictions made by experts and scientists. This issue is far more important than the sea ice extent in the arctic itself. How long will the public endure being gaslighted on stupid stuff like Arctic sea ice extent?? There are many factor’s we don’t understand and can’t measure that effect Arctic sea ice extent. To assume prima facie that anthropomorphic climate change is the only key factor in sea ice extent is anti-science. Some of the other possible factors that are not currently measurable are regional geothermal warming, gravitational variance, sea level anomalies caused by gravitational variance and the impact on currents. I am sure there are experts in WUWT that could name many others.
correction. .”some of the other factors that MAY effect sea ice extent’.
BTW… my info used is based on abundant Satellite data. The veracity of your abundant evidence of lower than average Artic sea ice extent is not challenged. Nor should you challenge the veracity of my abundant evidence that the sea ice extent in the Bering sea is above average. BOTH/AND my friend. So what is your point?
My point is that “quite abundant” is a strange way of describing below average conditions.
Below the average based on a 30 year mean. But certainly not in much longer time scales. And the authors point is that it is quite enough for the Polar bears.
In the end the alarmists are losing. What they claimed should have already happened has not. And it does not appear it is going to either.
Every summer over the last several years summer air temps in the Arctic have run below the average. The variance in sea ice metrics are governed more by wind and waves more than anything else. And there is no trend over the last few years.
Darn, how will David Attenborough make a disaster movie if everything is normal?
You may not make his day either if you tell him The Team™ has unwittingly shown that
natural variation dominated for the past 730k yrs. Ouch! 😉
Attenborough will simply tweak what you see, like using drones to stampede animals while editing in a drop of melting ice that has a heater blowing on it. C’mon!
He managed it with the Netflix mockumentary
Darn, how will David Attenborough make a disaster movie if everything is normal?
He’ll lie, just like he has before.
Thanks Susan. It is good to get the facts into the ether.
Being in central Washington State, I don’t use ice as my gauge of the season’s weather. I use wildflowers, especially the Mariposa Lily:
Calochortus macrocarpus | Green-banded Mariposa-lily | Wildflowers of the Pacific Northwest (pnwflowers.com)
They normally bloom on or about July 4th at my place. This year a cold and wet spring has delayed plants, so the first bloom I found was on July 12th.
“Quite abundant” and “plenty of sea ice”?! What are these general, non-scientific terms being compared to? How much is “quite abundant”? Very scientific…not! 🤦🏻♂️
Yea, never mind all the charts and graphs.
OK, so I see from the first link that the extent is 8.7 million km², which is at least 1 million km² less than the average. So 8.7 million km² is abundant and plenty? How should the average figure be described? More than abundant or super abundant? What is the scientific “abundant” term?
Look at my post below and look at this one.
Loss Of Arctic Ice From 1988-1996 | Real Climate Science
Arctic sea ice is indeed very abundant relative to what so many “experts” both in and out of government, declared that it would be by this time. Even ignoring the fact that Susan’s comment is made in the context of what is believed to be best for the Polar bears.
There is not enough lipstick in the universe to cover up the pig that was the prediction of so many alarmists that were and still are declared to be “experts”! Artic sea ice is not only still there, but there is still no indication that we will see “virtually ice free” summers anytime in the near future. But there are people like you that are silly enough to still try to nitpick and obfuscate that oh so obvious fact.
And then there is the Greenland ice sheet. Despite all the claims of declining mass balance, the ice sheet has been growing relative to the 30 year mean.
And all of this is happening even as the AMO is still in its positive phase, though it appears to be heading south. And I have no doubt that when it does pass neutral on it’s way down and we start seeing temperatures here in the states like we had in the 70’s that there will be fools declaring THAT has been caused by “human caused climate change” also.
Still no scientific definition of abundant, then? Just a description that you and the main post wish to use to say…what? Ignore the trend and focus on the present? Ignore the figures and focus on vague, unscientific descriptions? OK, if that’s what this website prefers…
l won’t argue anymore. No need too. Let the conversation stand as it is for others to judge.
Who was the article written by?
What is her area of expertise?
What is she reporting on and why?
If you cannot answer these questions, you cannot understand her use of “abundant”.
I suggest you read up on Polar Bears and what they need for hunting and what seals need for reproduction, THEN you might get some sort of clue.
But you, like bdgyx above are just trolling on ONE WORD, which you would call a LIE!!! because “below average”.
So answer the above questions and you can possible get a cue as to what abundant applies to.
1 Dr. Susan Crockford
2 Zoology, particularly polar bears
3 Arctic Sea Ice, saying it’s abundant
And no, I have no idea how “abundant” relates to all this scientifically. Maybe you can explain and reveal how average conditions could be described, seeing as how conditions at the moment are below average.
“And no, I have no idea”
You should have stopped typing after this statement of fact.
Extent this year is pretty similar to 1995.
Ice Loss Since 1995 | Real Climate Science
One man’s loss is another man’s input to the average.
Breaking News. One walrus found in the town Hamina, southern cost of Finland!
https://wattsupwiththat.com/2022/07/14/arctic-sea-ice-still-quite-abundant-for-early-summer/#comment-3555535
Here is an interesting chart. The avg. temp in the arctic is below a baseline for this time of year. Constantly so! http://ocean.dmi.dk/arctic/meant80n.uk.php
Very nice data feed. I looked at all of the years 1958-2022. It is rare, (relatively rare we taking a 64 year data set) for the day time temp average to dip below the mean by that much for the long during the Summer months. The 2022 graph is very close to the 2009 graph. I could not find any others that were similar. I remember Bastardi predicted three cold winters (2011,2012 and 2013..which turned out cold in PA) after the solar minimum of the 23rd cycle, (the minimum of the 24th cycle was very similar to the minimum of the 23rd cycle). Anyway, Bastardi cited a cooling trend in the artic as one of the factors for his prediction. I wonder what he now thinks of the current arctic cooling trend? Ice in and out ice out dates are also another data proxy for arctic temp trends.
Where is Joe now? Does he have a site? Also, Greenland is not melting on schedule as well.
Geez the narrative protection on Bering sea ice makes it nearly impossible to find good information. There was a very inconvenient expansion of Bering sea ice this Winter and it stuck around awhile…into MAY?…. but it was just due to weather. LOL
https://scitechdaily.com/a-sea-of-icy-variability-expansion-of-sea-ice-in-the-bering-sea/
It’s a bit chilly in July in the North Pole.
http://ocean.dmi.dk/arctic/plots/meanTarchive/meanT_2022.png