Bob Irvine
ACORN-SAT routinely adjusts measured historical temperatures to correct for various equipment changes, site, and vegetation changes etc. Some of these changes are legitimate and some are not. A reduction in historical temperatures enhances any century scale warming. In the case of Darwin, historical temperatures have been lowered significantly causing Darwin’s warming rate over the last century to be nearly one full degree higher per century than it would have been if raw temperatures as measured were used.
I am interested here in two of the adjustments made by the Australian Bureau of Meteorology (BOM) to raw data for inclusion in the ACORN-SAT 2.2 Darwin maximum temperature reconstruction.
They are:
- The cooling of recorded and unadjusted historical temperatures prior to 1/1/37 due to the station change from the Darwin Post Office (DPO) (#014016) to Darwin Airport (DAP) (#014015) in 1942. This adjustment also included an estimate for any temperature change across the in-continuity from 1/1/37 to 1942. All temperatures prior to 1/1/37 were reduced by 1.02C based on only one reference station, Wyndham Port (WP) (#001005).
- The BOM reduced all maximum temperatures prior to 1/1/80 (including further reducing the maximum temperatures prior to 1/1/37) for statistical reasons based on the reference stations, Cape Don (#14008), Jabiru Airport (#14198), Oenpelli (#14042) and Katherine Council (#14902). All maximum temperatures from 1/1/80 back to the beginning of the reconstruction in 1910 were reduced by 0.67C.
For reference I have copied Jennifer Marohasy’s graph depicting Darwin’s ever changing temperature history, Figure 1, from her site,
Homogenisation Creating Remodelled Temperature Series for Australia
I need to acknowledge Jennifer’s work in compiling this important data source.

Figure 1 – All changes over time to the Darwin maximum temperature series. Each subsequent change adds warming to the record. ADAM is the raw unadjusted data while the 4 ACORN-SAT datasets have all been heavily adjusted.
I’ve also copied below for your reference, a page from the Australian Bureau of Meteorology (BOM) website, Figure 2, that outlines all the changes to Darwin maximum temperatures including the two I am interested in.
Adjustments for ACORN-SAT version 2.2 for station number 14015
| Date applied | Temperature variable | Cause | Impact (°C) | Comparative stations |
| 1/08/1995 | Maximum | Screen | Annual +0.14 | 14272 14090 14142 14938 14198 14153 14042 |
| 1/08/1995 | Minimum | Screen | Annual +0.03 | 14090 14272 14932 |
| 1/10/1990 | Minimum | Move | Annual −0.3 Winter −0.34 Spring −0.33 | 14213 14090 14932 14400 |
| 1/01/1980 | Maximum | Statistical | Annual −0.67 | 14198 14042 14902 14008 |
| 1/02/1941 | Minimum | Move (n) | Annual −0.83 | 14905 14626 1005 |
| 1/01/1937 | Maximum | Site (vegetation) | Annual −1.02 | 1005 |
Table 1 – All Acorn-Sat changes to Darwin temperatures and reference stations used for those changes.
1. THE ADJUSTMENT TO MAXIMUM DARWIN TEMPERATURES PRIOR TO 1/1/37
As mentioned, ACORN-SAT reduced all the raw, measured maximums prior to 1/1/37 for the Darwin record by 1.02C based on the reference station, Wyndham Port (WP). Some reduction is justified as there was a major cyclone in 1937 that altered vegetation near the station and a site move in 1942. The original site was also bombed in 1942.
The point I wish to make here is that using Wyndham Port as a reference station exaggerated the warming across the in-continuity in the homogenised Darwin record. The Wyndham Port, Darwin Post Office and Darwin Airport graphs of maximum temperature are copied below.

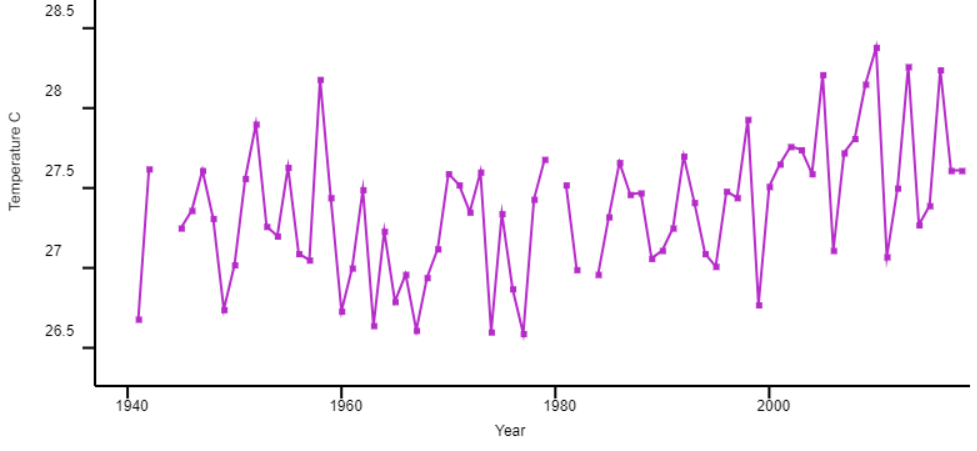
Figure 2 – Darwin Airport raw maximum temperatures. 1942 to 2018.

Figure 3 – Wyndham Port raw maximum temperatures.

Figure 4 – Darwin Post Office raw maximum temperatures to 1941.
The first thing to notice is that Wyndham port maximums warm by about 2.0C from 1925 through to 1955 while Darwin Post Office maximums are level from 1925 to 1936. Darwin Airport maximums are also level from 1942 to 1945 and only rise by about 0.4C from 1942 to 1955. This should immediately make us suspicious about using Wyndham Port as the only comparison station to adjust the Darwin temperatures for the station move, cyclone and Post Office bombing between 1/1/37 and 1942.
Acorn-Sat has justified the use of Wyndham Port maximums in this case by referring to their homogenisation program as described at http://www.bom.gov.au/climate/change/acorn-sat/documents/BRR-032.pdf and referred to here as Trewin, 2018.
By using this homogenization algorithm, they have transferred the anomalous warming in the Wyndham Port maximum record to the Darwin record.
I will show here why Wyndham Port (WP) should not have been used as a comparison station for Darwin.
METHOD
- Trewin 2018, first chooses either the daily method or monthly method of comparing a reference station to the target station. The daily method is more complex and time consuming and is used when there is sufficient daily data. The monthly method is used when there is not enough daily data. I have chosen to use the monthly method here as it saves a lot of time and has no significant effect on the result. Trewin 2018, support this approach. See the quote below.
“This comparison showed that there was no evidence of any systematic differences between the daily and monthly methods. The mean adjustment for the daily method was –0.067 °C and for the monthly method –0.069 °C, whilst the mean absolute size of adjustments was 0.465 °C and 0.478 °C respectively” - They then calculate the Pearson Correlation Co-efficient (PCC) for each of the 12 calendar months between the reference station and the target station over a period of 3 to 5 years (depending on data availability) either side of an in-continuity. 5 years, of course, being preferred. In this case Wyndham Port (WP) (The reference station) is compared to Darwin Post Office (DPO) for the 5 years, 1932 to 1936, and in a second calculation Wyndham Port is compared to Darwin Airport (DAP) for the 4 years, 1942 to 1945. These results are shown in Table, 2. Below.

Table 2 – The PCC (Pearson Correlation Co-efficient) for the three stations (WP v. DPO & DAP) over the years indicated is calculated for each individual month. These values are shown in the table along with their mean and median. The red values are the months with poor correlation
3. The next step is to decide how to treat these monthly PCCs. Trewin 2018, describes their method below.
“…the correlation index (for station comparison purposes) was determined as the median of those 12 monthly correlation values,…
In general, only stations with correlations of 0.6 or above were used as reference stations, but if fewer than three such reference stations were available, this limit was relaxed to 0.5. If there were still fewer than three available reference stations, the reference stations were weighted by inverse distance from the candidate station, rather than as per the procedure outlined above. (There was one case, at Darwin in 1937, where only one reference station was available; this adjustment was well supported by metadata.)”
Darwin is in a unique position in that it is the only station in Australia to have only one comparison station. The Wyndham Port inhomogeneity was, consequently, not picked up and was allowed to contaminate the Darwin record. The red PCCs in Table 2. are the poorly correlated months and it is in these months that the possibly spurious warming at Wyndham Port was transferred to the Darwin record.
Once a reference station has been cleared as suitable, its mean monthly temperatures either side of an in-continuity can be used to bridge that gap in the target station. The mean monthly temperatures for each of the 3 to 5 years either side of the in-continuity are then compared between the two stations and the target station is adjusted accordingly. In the case of the Darwin maximums for the in-continuity from 1936 to 1942, Wyndham Port was considered a suitable comparison station as the median of its monthly PCCs with Darwin Post Office and Darwin Airport were above 0.6 as shown in Table 2. Unfortunately, this method effectively hid any effect the poorly correlated months (red) would have had on the mean. The problem comes from using the mean to adjust the stations while using a different measure, the median, to decide if a comparison station is suitable.
On the evidence from the maximum data, Wyndham Port (WP) should not be used as a reference station for either Darwin Post Office (DPO) or Darwin Airport (DAP) as it clearly has strong warming from 1925 to 1955 that is not apparent in either Darwin record.
Another reason why Wyndham Port should not be considered as a reference station for Darwin is that its minimum temperatures from 1942 to 1950 are strongly negatively correlated with the Darwin Airport as is clearly seen in the two minimum graphs below. Darwin Airport minimums rise strongly from 1942 to 1950 while Wyndham Port minimums fall by nearly 2.0C during this same period. The temperature drivers in the two places appear to be unrelated for this period.

Figure 5 – Darwin Airport raw minimum temperatures.

Figure 6 – Wyndham Port raw minimum temperatures. Note the dramatic fall in temperature after 1942 compared to the rise in temperature at Darwin Airport for the same period.
Amazingly, Wyndham Port (#1005) was eligible to act as a reference station for Darwin Airport minimums for the in-continuity in 1941 (See Table 1) despite the strong negative correlation between the two after 1942. This almost certainly happened because they used monthly median PCCs to qualify the reference station. The fact that the mean temperatures are then used to bridge the in-continuity introduces a spurious warming or cooling to the target station.
CONCLUSION
Wyndham Port should have been disqualified as a reference station for the in-continuity in maximum temperatures in the Darwin record from 1937 to 1942. It was not disqualified because the homogenisation algorithm used is faulty. Acorn-Sat qualifies a reference station if the median monthly correlation co-efficient either side of an in-continuity is greater than 0.6 (or occasionally 0.5). The fact that they use the median and not the mean correlation co-efficient allows poorly correlated months to have limited or no effect on whether the reference station qualifies or not. In this way poorly correlated reference stations can qualify as a reference station, despite having large, incongruous temperature variation hidden in the months that are poorly correlated.
What a mouthful. Basically, Wyndham Port was used as a reference station for Darwin despite it having a large and obvious increase in temperature from 1925 to 1955 that does not appear in either Darwin record. This has occurred because the homogenisation algorithm used by Acorn-Sat is faulty as discussed above.
It is quite possible that this situation is common in the Acorn-Sat homogenised series in Australia and other similarly homogenised series around the world.
2. THE ADJUSTMENT TO MAXIMUM DARWIN TEMPERATURES PRIOR TO 1/1/80
Acorn-Sat reduced all Darwin maximum temperatures prior to 1/1/80 (including further reducing the maximum temperatures prior to 1/1/37) for statistical reasons based on the comparison stations, Cape Don (#14008), Jabiru Airport (#14198), Oenpelli (#14042) and Katherine Council (#14902) (see Table 1). All maximum temperatures from 1/1/80 back to the beginning of the reconstruction in 1910 were reduced by 0.67C.
This reduction occurred between Version 1 and Version 2 of the Acorn-Sat series (Figure 1) and was attributed to “statistical” changes (Table 1) by the BOM. Trewin, 2018, discusses all methodological changes from version 1 to version 2 and defines statistical changes as either, “removal of rounding bias”, “detection of date shifts”, or “Adjustment for negative diurnal ranges”.
None of these statistical changes apply to Darwin in any significant way.
- Rounding biases only apply when there is an even number of reference stations for an in-continuity. There was no in-continuity at Darwin in 1980. Also, the average adjustment is only 0.025C for any individual adjustment which is not significant in this case.
- Date shift changes are insignificant and only last a few months at most.
- Adjustments for negative diurnal ranges effect individual days and in Darwin’s case must be less than 0.3% of days if any (Trewin, 2018)
I am at a loss to know what possible statistical changes could reduce every maximum temperature from 1/1/80 back to the start of the record in 1910 by 0.67C. This is significant and not explained as far as I can see. What possible reason could Acorn-Sat have for changing a perfectly good data set by such a large amount many years after the original data was recorded.
The only useful thing I can see to do is graph the 4 Acorn-Sat reference stations with the Darwin Airport raw and adjusted data to see if the change makes any sense. This is done in Figure, 7 below.
All stations in this graph are equalised in 1980 for comparison purposes. You can see that the Darwin raw temperatures are a better match to the 4 reference stations than is the Darwin adjusted series indicating that the adjusted temperatures were less accurate than the raw Darwin series. You will notice that the Darwin adjusted series is significantly cooler than the other 5 series and that the raw Darwin series tracks the 4 reference stations well over 30 years.

Figure 7 – Darwin raw and Darwin adjusted are compared with the 4 reference stations used by Acorn-Sat to lower Darwin temperatures artificially in 1980.
CONCLUSION
There appears to be no valid reason to lower Darwin maximums by 0.67C for all years prior to 1980 all the way back to the start of the record in 1910. The reason given is “statistical” and is based on the 4 reference stations mentioned above. (Table1) & (Figure 7).
There is no statistical reason given that could explain this in the Trewin 2018 peer reviewed paper quoted by Acorn-Sat as their reference. The result of this adjustment is a significant increase in Darwin’s century scale warming trend. Unless someone can come up with a valid explanation, I would say that this adjustment was the result of either some sort of error or alternately was the result of politically motivated support for the global warming narrative.
Finally, just out of interest, that great and revealing email from climate-gate.

Figure 8 – Climate gate email from 2009.
BOM is even heavier handed than GISS.
BOM is even heavier handed than GISS.
____________________________________
So far this year GISTEMP has made 786 Changes to their
Land Ocean Temperature Index LOTI as follows:
Jan Feb Mar Apr May Jun Jul Aug Sep Oct Nov Dec
291 243 252
Again we are presented with an example of adjusting data in the direction of helping CAGW fanatics. Climategate has faded away in the eyes of the mainstream media, so, we need another Climategate, and the way these loonies plow on ahead it is likely we will get one. Wait for it.
In the beginning, there was the thermometer — and then government arrives … https://www.youtube.com/watch?v=hs-K_tadveI
Nice video, infuriating.
The swamp is everywhere — it’s global.
Amazing vid
Well done uncovering more fraud. But on my first read I’d think figure 5 should be comparing the same years as figure 6. Or did I misunderstand something?
How is this fraud? The raw data is available for everyone to download and analyse. I you don’t like their temperature analysis feel free to do you own and write it up for publication.
You miss the point as usual. The government makes the chang’s to suit their purpose, then the “official” government data is used for policy setting.
“It is quite possible that this situation is common in the Acorn-Sat homogenised series in Australia”
Well, not according to Trewin, in your quote.
” (There was one case, at Darwin in 1937, where only one reference station was available; this adjustment was well supported by metadata.)”
The situation was unique, and only proceeded with because the change was well supported by metadata. That is, Wyndham plays a minor role in determining the change.
Here is a paper that says what that metadata was:
“In this case, the Darwin ACORN-SAT time series data is sourced from three successive deployment phases: first, from 1910 to 1942 at the Darwin Post Office (PO), and then for 1941- 2007 and 2001-now at two separate sites on the Darwin Airport (AP).”
They know what changed, when, and they have an overlap period of at least a year with readings at both locations. It doesn’t all depend on Wyndham.
None of this justifies changing previously recorded data! As everyone should know, thermometers measure the microclimate in its shelter and that is all. Changes introduce different microclimates but don’t invalidate the previous readings as being inaccurate.
There is only one reason to create new information to replace accurate recorded data and that is to create a “long” record from short ones. What should be done is to stop the older record and begin a new one. All other scientific fields do this. But climate science obviously feels that normal science practice is not appropriate for new pseudoscience. So it becomes standard practice to replace known accurate measurements with created information.
If Darwin was inconsequential in the overall scheme of things, why not just leave the recorded temps as they were documented?
(My years as an internal auditor at a major company tell me to always be suspicious of transactions alterations that have little imperative.)
The imperative is to get it right. There is a series of readings at the PO, and then a series at the airport a few miles away. There is no reason to believe that you can just continue one series from the other with zero adjustment. You have to estimate the difference. Here it seems they have the best evidence – readings at both places over a common period.
Adjustments are inconsequential in the overall scheme of things. Adjusted and unadjusted data give a very similar global average. But that is no excuse for not getting it right. You don’t know they are inconsequential until you have tried.
”There is no reason to believe that you can just continue one series from the other with zero adjustment. You have to estimate the difference.”
They should have been kept seperate. But you knew that.
Bingo!
So the metadata from one station was good enough? There is no reason to adjust the two stations just exist. Statistics can’t tell what the temperature was yesterday; let alone 100 years ago.
So Australia has a global average temperature? That’s good to know.
And then “You don’t know they are inconsequential until you have tried.”
Having tried it and it is inconsequential why use it?
“ it is inconsequential why use it?”
Why not? Zero adjustment is a decision like any other. There is no reason to believe it is the right number. You have to make your best effort to get it right.
Why not? Because change for change sake should not be the imperative. It seems the Wyndham Port data should not have been used. Would you care to comment on that?
It is not change for change sake. You have readings from one place, to be combined with readings from another place a few miles away. One is likely to be warmer than the other, and you have to estimate that. Equally warm (no adjustment) is an estimate, and you suggest it should be made without evidence.
I think they probably should have used metadata as the primary source. But they found that it supported the Wyndham-based adjustment, so they invoked that, which is consistent with their general framework.
So a few miles is ok? What about in the larger Australian context of a few hundred km’s away?
Yes like 446kms as the crow flies-
wyndam to darwin distance – Search (bing.com)
Some of these boofheads need to jump in their EVs and drive between the two stations
People don’t combine such series.
The microclimate surrounding a station can be different from another station only a short distance away, let alone kilometers or miles away.
You haven’t addressed the real issue, manufacturing long records out of short ones by replacing measurements with created information! Address why this is necessary in terms of scientific requirements. Would you allow any other scientific endeavor to this? Drug makers? Nuclear radiation measurements? Bridge builders?
My auditing training was all about the integrity of the books Nick.
Sorry, but adjustments of entries where no definitive evidence for the imperative for such adjustments would call for me to qualify that ledger with a notation that it was not to be relied upon.
And investigation of the situation and personnel was called for.
Data for both airport and PO separately are available, unadjusted, on GHCN V4. In 1941 they both had readings; PO returned an annual average of 27.68°C and airport was 26.68°C. Exactly 1°C difference. It seems to me your job as auditor would have been to ask what allowance was made when combining the series, since the airport was clearly cooler.
You don’t have to combine the series.
You don’t. But changes to a site do occur, and without combining you end up with useless fragments. The combined series is a useful longterm record for Northern Australia.
Anyway they did combine the series. And if you do, you must adjust for known changes.
If you end up with useless fragments then so be it! That is not a justification for creating new information, that is a RATIONALIZATION. IOW, I need long records so I’ll manufacture some regardless of the accuracy of the original recorded data.
Nick, from an auditing perspective, it doesn’t matter whether a contrived number that was substituted for an original entry was “in the same ballpark”, the practice just has no defensible rationale or integrity.
You can’t force a balance in accounting, which is basically what historical temps homogenization is attempting to do.
It’s jail time for crooked company auditors you know.
We had to play everything straight down the line.
“contrived number that was substituted for an original entry”
It wasn’t substituted for the original entry. The unadjusted file lists them as recorded, as I graphed below. But if you want to combine them in a longer series, you just have to have some estimate of whether one is a warmer place. Just hoping won’t do, and wouldn’t satisfy a good auditor.
In fact they have a year of overlap measurements, and the airport was 1°C cooler. That has to be your starting point.
You keep using a rationalization to justify creating new data so your statistical analysis looks complete with reasonable error bars. Use a scientific reason to justify doing so. Something like the data was incorrect because …
Right according to who?
Nick –> “get it right”. You have shown nothing, not even the metadata, that proves the readings were inaccurate. You never address what the need is for “adjustment”. What is the reason Nick? Is it to manufacture a long record rather than multiple short ones?
“that proves the readings were inaccurate”
Again, for the umpteenth time, no-one says the readings were inaccurate. Readings at the PO were (probably) accurate for the PO, readings at the airport were accurate for the airport. But those accurate readings show that the airport is a cooler place (by about 1°C). So if you want a series for Darwin that reflects climate, and not man-made changes of venue, you have to adjust one or the other so they match. Convention is to change the earlier ones and keep the current one.
As to whether you should want a combined series, that is a separate question. But people do, and it has been done for a very long time. And if you do, you have to adjust to get it right.
Nick –> You have basically just admitted that what you have done has “extended” the climate at one place to encompass another location.
And, in the process just invented information that was not measured and replaced existing measurements that are probably accurate.
The only rationalization you use is to “create” a long record.
Tell the folks here why it is statistically important to have ‘long’ records and why that justifies replacing accurate recorded temperature readings with contrived information.
Be sure to explain why ‘short’ records cause problems with your statistical analysis.
Well you need to show and account for changes that were made when looking at the historical data. The Post Office at some point implemented a Stevenson screen, also had a tree growing nearby and then got bombed so records could no longer be used. The record needs to be annotated with those changes so that changes in temperature can be understood.
Knowing that changes were made doesn’t justify modifying recorded data with new and contrived information just to create a “long” record for official publication and use. If an individual wishes to do so for a given paper then they must supply the reasons that justify the modifications and what a sensitivity analysis shows.
Science requires using data as it is measured and recorded. If it doesn’t fit what you are doing, it is normal practice to declare it unfit for purpose and to discard it. In this case, and others like it, it means stopping the record when a change is made and to start a new one. Creating new information is generating fiction anyway you cut it. I know of no other way to describe it.
Yet again showing that the only warming signal comes from data adjustment
ie the warming IS NOT REAL.
“The imperative is to get it right.”
How many attempts to ‘get it right’ are they allowed?
Making any further alteration indicates that the previous adjustments were not ‘right’ so why believe the latest ones are ‘right’.
“Adjustments are inconsequential in the overall scheme of things.”
It appears to only be inconsequential when it reinforces the ‘we’re all going to die from CAGW’ meme.
It appears like the imperative was to bolster the narrative and nothing more
(tapping, a.k.a. “Nick,” heard off stage)
Edgar: Soon again I heard a tapping somewhat louder than before.
“Surely,” said I, “surely that is something… —
‘Tis [T]he [W]ind and nothing more!”
********
Thanks for the poetry fun, Bryan A..
Janice
All anyone has to know is that the sum total of all of the changes to collected data have the singular effect of making the time series agree with the preconceived conclusion of those making the adjustments.
IOW, the people changing the data are creating a record that supports what they want everyone to think, and what was measured did not do so.
By and large the general public are not buying what warmistas and their alarmist army are selling.
And most of the general public have no awareness of these alterations to measured data.
If and when everyone is fully aware of these shenanigans, who thinks people who are being impoverished will be persuaded by the lame explanations of those who fudged the numbers to paint a false picture of the history of measured temperatures?
There is not a single place on Earth that has anything unprecedented occurring with respect to temperature, even in the short history of thermometer data, and even given the obvious warming effect of increased urbanization, industrialization, population, and energy usage.
Beyond that, no serious person thinks that altering data is a valid method of verifying a scientific hypothesis.
“The imperative is to get it right.”
I’m skeptical.
Yes Tom he is trying to defend the indefensible. Microclimates are real data not anomalies to be adjusted away, that is not science as we know it, it is simple fraud!
So. You seriously believe that Mr. Irvine was only talking about Wyndham there.
You are clearly not that stupid.
Intentionally mischaracterizing an author’s words — again.
He said
“By using this homogenization algorithm, they have transferred the anomalous warming in the Wyndham Port maximum record to the Darwin record.”
and that just is not true. They relied primarily on metadata from the Darwin location, and in particular the period where they had concurrent readings from both Darwin sites.
Nick
The Darwin PO had been corrupted by the cyclone in early 1937 for the period from 1937 to 1941. Vegetation changes as stated.
They were looking to adjust pre 1/1/37 data and connect it to the Airport data which commenced in 1941. There was no overlapping data that could be used.
Bob
“There was no overlapping data that could be used.”
There is. It is in GHCN V4 unadjusted, though that no doubt came from BoM. In the months of 1941:
27.24 NA
27.98 27.43
28.48 27.89
28.64 27.86
NA 26.07
25.26 24.14
26.13 23.44
25.16 23.99
27.62 26.40
NA 27.92
28.39 28.13
30.10 28.70
The airport is cooler in each of the 9 months when both have data, with average difference 1°C. Now you seem to be saying that they should reject (or adjust?) the PO data for 1941. In fact the complaint about it was that trees had grown to shade the thermometer, so it should then have been even warmer. But whatever, you can’t ignore the difference. You can never be certain of what it should be, but you can be very certain it isn’t 0°C, the estimate promoted here.
Nick
Firstly, I believe DPO should be adjusted down to some extent if we want to bridge the in-continuity with Darwin Airport. .
The facts as I see them are that we have no idea how much the major cyclone in early 1937 effected the DPO data set other than to say that it cooled it significantly. Not that it tells us much, the DPO cooled about 0.5C from 1937 to 1938. This of course can only be checked by using a reference station, in this case Wyndham Port was used.
For the test period 1938-41,
WP was level and DPO fell a little over 0.5C.
For the test period 1932-36,
WP rose about 0.5C while DPO rose only a small amount.
The effect of that cyclone in Darwin over 400km from Wyndham Port is likely unknown but possibly has cooled the DPO record by only about 0.5C.
The station change in 1942 also had to be adjusted for. The reference station Wyndham Port was the only station available for this as well.
My point was that Wyndham Point should not have qualified as a reference station for the reasons outlined in the essay.
If you are saying that we should use the 9 overlapping months between PDO and DAP in 1941 then you should be aware that for the 4-5 years prior to 1937 and after 1942 the December ( and 4 other months to a lesser extent) temps were strongly negatively correlated for the two stations. This could make a significant difference.
Just out of interest, do you have any idea why the BOM reduced all max temps prior to 1980 right back to the start of the record in 1910 by 0.67C. They quote “statistical” reasons but these are not supported by their nominated reference paper.
The point I was trying to make in this post was that the algorithm used by the bomb can in some cases lead to reference stations being used that should not qualify.
Bob,
First, I see there is another comparison month, Jan 42, when PO was 28.64°C and airport was 27.85°C. Again cooler, and by about the same amount.
I don’t understand where you are going with reference to cooling from the 1937 cyclone. I thought there was cooling suspected from the growth of shading trees. But either way, that means the PO should be adjusted upward, making the adjustment for the move larger.
You seem to be saying, as many do, that we aren’t sure, so let’s make it zero. But zero is just a guess, and on the evidence a very bad one.
I think that WP was, on it’s own, inadequate evidence, and from your quote, Trewin thinks so too. They say that they made the adjustment because it was supported by metadata. The fact is that together, they do have ample evidence. They should have cited metadata, with the overlapping year, as the primary rather than WP, but that is a minor sin. They have the goods.
As to 1980, you’ll see from the graphs I posted that GHCN TAVE does not pick that up. BEST has a small empirical break there, but counters with an opposite break in about 1966. They have a 1°C empirical break in 1940 (like BoM), but seem to think the station move came later. I think 1980 falls within what would be a grey area for statistical tests of significance. You would get different threshold testing TMAX directly, as ACORN does, vs testing TAVE.
I see from your table that BoM has split the around 1940 change into -.83 in 1941 for the move (min only) and -1.02 in 1937 for veg (max only). This amounts to a total change of -0.93 to TAVE, close to BEST and to the actual observed discrepancy. Obviously the timing of an adjustment for vegetation can’t be precise.
Nick
Thanks for the detailed reply.
I think you may have misunderstood my post.
I agree that a -1.02 drop is a better guess than zero for 1936 to 1942 period station move and cyclone.
My point is that Wyndham Port qualified as a reference station for Darwin when it obviously shouldn’t have. Look at the graphs. You say you (and Trewin) agree with me on that point.
My post outlines why the algorithm that qualified WP is faulty.
This is not a “minor sin”.
It is a major systemic error that possibly applies to hundreds of reference stations around Australia.
On the face of it, this error should not favor warming over cooling, but it is possible that any UHI effect, for example, could have infected surrounding rural stations in exactly the same way that WP was eligible to infect Darwin.
The fact that WP qualified as a reference station for the min change in 1941 is a joke. Look at the graphs. WP and DAP run strongly in opposite directions after 1942.
The BOM really does have a problem here.
Lastly. As we are in the guessing game. Here’s my estimate for Darwin Maxs from 1910 to 2020.
From the raw data,
DPO has no slope from 1910 to 1936.
DAP has a 1.1C rise over 80 years from 1942 to 2022.
Combined that indicates an anomaly of 1.04C/100 years.
That compares with AcornSat v 2.2, 1.904C/100 years.
If we take off the unexplained and likely fictitious (unless you can find a detailed explanation) 0.67C from 1980 then that leaves a drop of about 0.8C for DPO to bridge the in-continuity from 1936 to 1942.
Better than using 9 intermittent months overlap or an obviously non-compliant reference station.
The only warming in Darwin, appears to be warming created by data adjustment.
The Adjustocene proceeds apace.
Darwin is a classic example of temperature manipulation by the BOM.
https://kenskingdom.wordpress.com/2010/05/22/the-australian-temperature-record-part-2-northern-territory/
http://www.warwickhughes.com/agri/darwinfiddle25jun12.pdf
A couple of the older articles spelling out some issues found previously. I did think that are various times around WW2 they had anywhere from 3-5 temperature stations with datasets showing there was no reason to adjust the airport further by some completely unrelated station some long distance away.
Thanks shortie of greenbank for posting those articles on Darwin incl Ed Thurstan’s Darwin Fiddle paper that I posted.
And some are accused of conspiracy theory thinking.
There is a physical distance of approximately 250 statute miles (about 400 km) between Darwin and Wyndham Port, and irregular land figures along the coast in the region. That side of Australia faces the Timor Sea and I would venture a warm maritime climate, locally. I hardly think that that one area would be ideal for measuring “global warming”, and extending manipulated data for that purpose is a fool’s errand. The apparent mixed use of the statistical “mean” and “median” to extrapolate from the BOM weather data is, to me, quite problematic.
I have always been troubled by weather station measurements, as any single weather station only measures the micro-climate of that location only. Where I live right now it is 22c if I drive 1.5km down the road it is 24.5c. If the sea breeze picks up both locations will be less than a degree apart but if the wind turns offshore it will a 5 degree spread. No amount of homogenisation or statistical manipulation can change that weather station can only measure the micro-climate of a single location only To combine multiple stations into a single temperature and call a region is nonsense. Unless of course you have factored in all the other variables for each location like wind speed/direction, cloud cover, humidity that determine a location temperature at a particular point in time. And then somehow work out what that all means over a very large area.
Brilliant
Did you just describe your own comment as brilliant?
By mistake and there is no edit button.
OK, we can let it slide this time.
BTW…there is an edit button, but only for a few minutes after a post is entered.
This is the whole problem. Everyone wants to reduce the complexity down to one simple number, the Global Average Temperature, but WTF is that? How can that possibly be a meaningful number?
What you are talking about.
Yep, exactly that picture. Add them all up, average it out tell everyone that’s their climate. It’s not, it’s the average of the micro-climate across that region and that is meaning less. The they do that for the whole world! It’s nonsense.
Is there any chance that the original measurements will ever get ‘lost’ amongst all the various adjustments going on?
Is there any other field of science that ‘adjusts’ historical measurements as much as what we see with the temperature record?
If I could adjust my historical blood pressure readings I wouldn’t be as concerned about my current readings 🙂
Don’t think so, it’s a bit like a phrenologist finding that a subject of a certain personality type lacks the right bumps producing them by clouting him on the head with a hammer.
Imagine economists altering data for employment and economic growth, and using those altered numbers as the basis for punishing policies?
Who would accept that?
According to Fig 1 we are expected to believe that Darwin is ~2C warmer now than it was in 1910.
Comparing the isotherms on the BoM ‘Average daily mean temperatures’ for December (28C) and July (24C) with those on Image 28 in The Royal Atlas & Gazetteer of Australasia (1890) for December (85F) and July (75F) the climate around Darwin hasn’t changed much over 130 years, maybe Darwin was a little warmer back then.
The entire premis that says raw temps should be adjusted to make up for changes (like cyclones or site relocations) is total disinformation. How much should you adjust? I don’t know. how do you know it’s a correct adjustment? who knows since you made it up. Leave the data as is. If the site is relocated, then end the old nums and start from scratch frkm that new location. If a cyclone comes through and messes up vegetation.. oh well (it works the other way too with lack of cyclones). If the site is reading faulty, throw the numbees out (do not use nearby sites as proxies). Science gets polluted when we make crap up to fill in gaps. I know its not as simple as this, but making crap up is antiscience, which is exactly what the climate crazies are and why they so it.
Short records screw with the statistics. That is the reason and only reason for wanting long records. Make the math look right, to heck with using the data as is.
If you go to Moyhu here, you can see GHCN V4 unadjusted data for the airport and PO separately, as well as the combined series. The airport alone is called Darwin Airport Comparison. The plot of combined series is here:


You can see the sudden and sustained drop going through the transition in 1941. The plot for Post Office alone is here:
The last full year of data is 1941, when the annual average temperature was 27.68°C.
The plot for airport alone is here:
The first full year of data is 1941 and the annual average was 26.68°C. That is 1 full year of concurrent data. The airport is clearly a cooler place, which is the reason for the sudden drop in the combined series. That drop did not reflect a cooling in the climate anywhere. It reflects just a change in the place of measurement. An adjustment must be made.
Umm, are you sure those last two plots are for different stations? They look _exactly_ the same to my inexpert eye.
Thanks, yes, I showed the airport instead of PO. Fixed.
“That drop did not reflect a cooling in the climate anywhere. It reflects just a change in the place of measurement. An adjustment must be made.” Oh really? If that is your argument then you have failed completely – as written it is complete garbage and utterly dangerous as an assumption.
As it happens, the reasons for the change was twofold – the original site was at the old Post Office (bombed in 1942 which is why 1941 is the last year of full data) which was located in an area which may have been subject to UHI and lacked any sort of screens (the new one at the RAF station radar site had a Stevenson screen) which raised doubts as to the reliability of the temperature record at the Post Office. So why the hell do you adjust the station record from that point onwards until 1980? Why not adjust the P.O. records downwards slightly to reflect the unreliability issues and UHI and leave it at that?
“So why the hell do you adjust the station record from that point onwards until 1980? Why not adjust the P.O. records downwards slightly to reflect the unreliability issues and UHI and leave it at that?”
They don’t adjust onwards, always backwards. Here is a plot of GHCN V4 Darwin unadjusted (purple) and adjusted (green). The adjustment in 1980 was minor and backward; The adjustment in 1941 was larger and changed earlier readings.
The reason for adjustment was that the PO was observed to be 1°C warmer. It doesn’t matter why it was warmer. You don’t adjust to reflect unreliability (how could you?).
So their “adjustment” created the warming.. Ok
But we knew that.
You have continued to fail to explain WHY you need to create new information to have a LONG record. Why do you insist on having a long record? What is wrong with just having two DATA records of different lengths?
This is changing the subject. I agree that you can have two stations. GHCN V4 gives the two records separately as well as a combined record. You need some threshold, though; some degree of change is happening all the time.
BEST takes that approach; they use a least squared approach to anomaly base in global (and regional) temperature calculation, which handles the changes. I use that too in TempLS. But in the older style, you need at least some data in a fixed period, say 1961-90, and the long Darwin PO history could not then be used.
But ACORN is explicitly a collection of long records, and we do have a long record of temperature in Darwin. If you want such records, you have to adjust for effects like change of location. The alternative is just wrong.
Answer the fundamental question of why you need a long record. It is the basis of your argument.
If you don’t need long records, the need for “adjustment” (changing data) goes away. You need a very good scientific reason to justify changes.
“Answer the fundamental question of why you need a long record. It is the basis of your argument.”
It is not the basis. I don’t need a long record. But many people feel they do, and I point out that as a matter of proper arithmetic, you must adjust for effects like change of location.
You don’t explain the alternative. Do you insist on a break whenever there is a change that can be simply adjusted for?
You don’t throw away a micrometer because it is not at the design temperature. You adjust for the difference. There is nothing new about adjustment in science.
My city, Melbourne, hs a temperature record going back to 1856, which sometimes is invoked at WUWT. It was measured for over a century in a city location, where urban pressures got serious (as discussed at WUWT). So in 2014 they moved to a new good location about 2km away. Should our record end in 2014? They did of course maintain an overlap period to measure the average difference between the sites (just as we have in Darwin).
Do you realize Richard that Darwin PO had a Stevenson screen in the 1890’s? “Late 19th Century photographic evidence of the Stevenson Screen in Australian meteorology 14Jun2010”
http://www.warwickhughes.com/blog/?p=604
Along with many other weather stations across the wide brown land.
“If you go to Moyhu….”
The very last place you would go to for unbiased information.
“The airport is clearly a cooler place” That is not clear at all from the small overlap between the two, particularly given the gaping holes in the airport data at the start. Post Office ~27 to 27.75 and airport ~26.5 to 27.75 over roughly the same period. Looks pretty much the same without looking at each day side by side.
Bob Irvine,
Thank you for this essay. Since about year 2000, I have done a number of studies about Darwin which might blend nicely with your essay. Some is not yet ready for WUWT, so if you would like to discuss, my email is sherro01 at out!ook d0t c0m.
Well done Geoff S
Bob,
That warming at Wyndham, 2 degrees C in Tmax from 1925 to 1955 might be non-physical in the sense that it is a bigger trend than anywhere else. I cannot recall a trend this large in other Australian data, but I have not specifically looked for it. But, I shall do that now. Geoff S
There is a truly basic data issue with this adjustment concept.
A weather station is in place to record conditions at the site. It is not there to become a homogeneous element in a politically driven narrative.
we either trust the professionals who took the readings or we don’t. If we do trust the scientists and technicians that were carefully recording date back in time, then we should not adjust anything. If we do not trust the recordings taken then using them as a basis for ‘adjustment’ is completely unscientific. Clearly adjusting any historical data is pointless and nothing more than guess work or worse plain old fraud.
“we either trust the professionals who took the readings or we don’t”
This is nonsense. Of course we trust the professionals. Their results are recorded and passed on by BoM, GHCN etc in the unadjusted data.
The issue is, as with Darwin, that professionals were taking accurate readings in different places, some warmer than others. And if you want a long record for Darwin, you have to take account of the airport being a cooler pace than the PO.
Bollocks. One of the issues, clearly stated by the BOM adjustment bureau, was that because the Darwin P.O. station lacked screens they didn’t trust that the Postmaster would have moved the station round (it pivoted) to avoid the sun. So they really don’t trust the professionals, nor do they trust the readings up to that point to be completely reliable – they clearly blame human error and state that the P.O. site was warm for that reason and UHI, not that the RAF station radar site was significantly cooler.
Nick Stokes – IMHO you have muddled the entire article bringing in GHCN. Should have been left to just BoM data as set out by Bob Irvine. GHCN is a whole different set of adjustments and fiddling and deserves a thread of its own.
Can I suggest you checkout Halls Creek 002011 – I know it is a bit further and inland but worth a look – only few missing months from 1898-1951 and no missing months around 1942. No sign of any warming jump in early 1940’s as shown in Wyndham Port. Worth a decko only take you minutes. Feb & Mar 1942 have complete dailies. When you have the monthly max table showing you can make charts of any month or the annual by clicking on the little chart symbols up top. Wonders of the BoM. If you want to see a year of dailies – go down the lower left and clik the GO botton after selecting the years you want.
Bob,
Your fig 7 – can you check the colour codes?
Jabiru started after 1970. My colleagues set it up and operated it. Oenpelli was there decades before. Geoff S
Hi Geoff
My data indicates that Jabiru only has 4 points prior to 1980 and is, therefore, a bit hard to find on my fig 7. Note, it was still used as a reference station.
Oenpelli goes back to 1964 as shown in fig. 7.
Colour codes seem OK unless I am missing something.
Seems both Nick Stokes and Izaak Walton were subject to a strategic “e-mail blindness”whilst perusing the article.
When the data doesn’t match the theory, fix the data.
did you ever perform the Millican oil drop experiment? I could never get my drops to float and I am convinced to this day, 50 years later, that he assigned this project to a couple of grad students who faked the results so they could go out and drink beer. For a hundred years we’ve been wrong about the charge on the electron as a result. <warning – that was a joke>
as with electrons, so with temperatures…
I’ve never understood the need to adjust. To begin with if you don’t have data, then you don’t have data. Stop “infilling” in order to pretend that you do.
If you need to relocate then do so. Mark the point of change but leave the original figures as they were. We can work out for ourselves why there is a difference.
Ditto if you “upgrade” the equipment.
The bottom line is (or should be) “who cares”? This is the past we are talking about; this is a historical record complete with all the flaws that might have affected it. We can’t change it and doesn’t affect the future — and that is the message the climastrologists are refusing to acknowledge. Tweak the figures as much as you like, guys, we are not repeat not influencing climate or temperature in any significant way, much as you would like to believe otherwise.
As usual, the BoM and ACORN have ignored the influence of rainfall trends.
Darwin’s annual average rainfall in 1890-1909 was 1528.76mm (av max 32.90C, min 23.61C). Somewhat irrelevant as ACORN starts in 1910.
Darwin’s annual average rainfall in 1910-1941 was 1511.14mm. (av max 32.35C, min 23.62C).
Darwin’s annual average rainfall in 1942-1999 was 1708.15mm. (av max 31.95C, min 23.22C).
Darwin’s annual average rainfall in 2000-2021 was 1773.15mm (av max 32.52C, min 23.25C).
All of which equates to a mean temperature of 27.99C in 1910-1941 amid 1511.15mm of rainfall, and a mean temperature of 27.89C in 2000-2021 amid 1773.15mm of rainfall.
It could be argued the temperature should have dropped even further with a 17.4% increase in rainfall, but Darwin is home to more than 147,000 people so there’s sure to be a bit of UHI.