The Copernicus program offers very interesting data on Arctic ice.
While sea ice has been declining off the Greenland Sea (east of the island), the Chucki Sea (eastern Siberia) shows a very different trend in sea ice extent over the past year. Such deviations have occurred repeatedly since the year 2000.
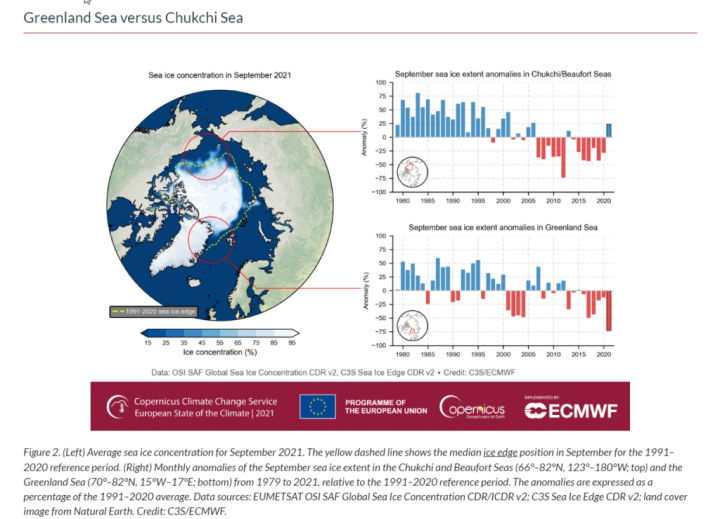
Chart: Screenshot climate.copernicus.eu
Overall, the 2021 extent was very close to the 1991-2020 mean and well above the lowest value in 2012 and also above what was recorded in the year 2020.
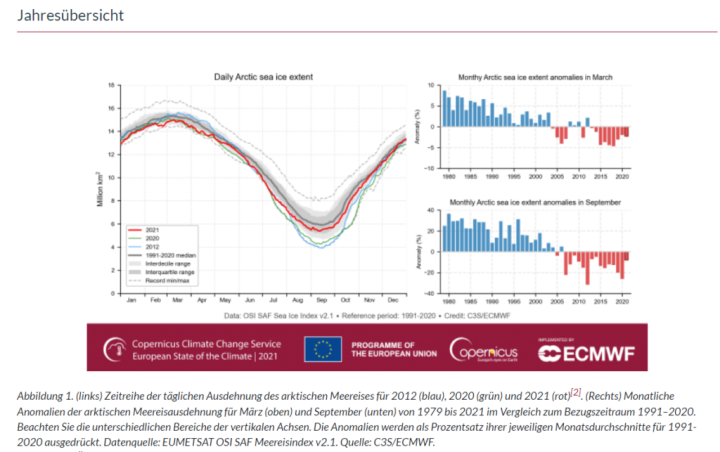
Chart: Screenshot climate.copernicus.eu
Solar Cycle 25
Solar Cycle 25 is now already 28 months old and there are still 12 months of sunspot activity increase to plateau on average for cycles 1…24, a little more than 3 years after the start of the cycle. So it’s worth taking a look at the current status of SC25, which started in December 2019.
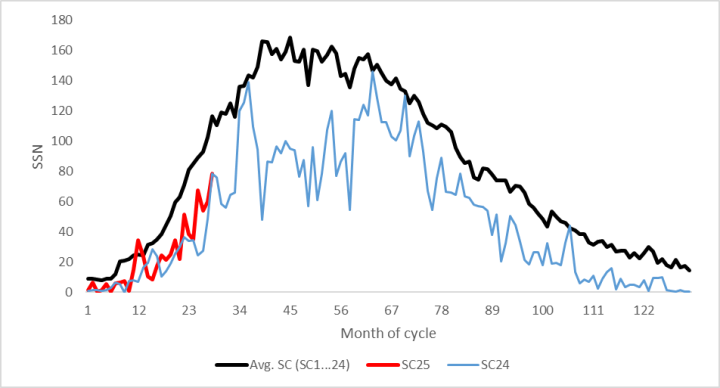
It has been speculated that SC25 will be somewhat stronger than its predecessor SC24, which was the weakest cycle since the beginning of the 20th century. In fact, the current cycle so far behaves quite similar to SC24, in the sum of all months it showed only 21% more in SSN than the predecessor, it is thus “second last” in activity since 1900. We will inform you in irregular intervals about the status in the current solar activity, so far SC25 keeps to the forecasts.
Sea ice recovery and Solar cycles 24 and 25 (so far) weak, sounds like a Heliocentrist view. Hey Giordano, what’s that I smell burning?
Why is that? Sea ice on a dead spiral sounds like a Geocentrist view, you mean? Hey Ptolemeu…?
The Solar cycles 24 – 25 minimum so far has been tracking one from the century ago. However, since there are number of other factors are involved it is unlikely that the Arctic temperature (for which we have some data) and sea ice (data might be scarce) will follow the early 20th century.
As always time will tell.
When it comes to tracking cycle 25, use the austrailian estimate. Their estimate is tracking right on. The NASA/NOAA estimate seems way off.
https://www.sws.bom.gov.au/Solar/1/6
“Arctic Sea Ice Stabilizes”
But not in the narrative driven media it doesn’t. It does quite the reverse
One only needs to consult The Guardian – which is feeling the cold winds of economics
Only a few days left to enjoy 35% off an annual subscription
Millions turn to the Guardian every day for fiercely independent journalism that’s open and free for all. This April only, we’re giving you a limited time offer: enjoy 35% off an annual digital subscription and you can power Guardian journalism for a whole year. To say thank you, we’ll give you ad-free reading, and exclusive access to premium features on our award-winning apps
Don’t ya jus lurv the hyperbole
Its so funny – they really think that being the house organ of the Labour Party is ‘fiercely independent journalism’!
“fiercely independent journalism that’s open and free for all“
Then why do all their articles on the “Climate Crisis” always get at least a ‘7″ on the Griff scale?
My local newsagent tells me he can’t give the Guardian away, let alone sell it.
Griff says “At those prices, sign me up twice!”
The 1991-2020 mean is 11.08e6 km2 with σ = 0.6e6 km2. The annual mean in 2021 was 10.55e6 km. That is close to a 1σ deviation below the mean. That’s not what I would describe as “very close to the 1991-2020 mean”. [1]
The trend over the last decade is -0.44e6 km2/decade. That’s not what I would describe as “Stablizes”. [1]
According to DMI Modeled ice thickness and volume page 2022 is greater than 2021 and 2020 and on a par with 2019, But lower than 2018 and the 2004-2013 mean but within one standard deviation of the mean. Looks pretty stable to me.
Be as that may be Die kalte Sonne is referring to extent over the last 10 years and wrt to the 1991-2020 mean.
You say, “That’s not what I would describe as ‘very close to the 1991-2020 mean’.” And therein lies the problem with climate science as understood by/ interpreted by the general public (and by too many climate scientists). Some exaggerate variances and trends; some underplay them–and the reason why this is possible is that climate data and science, despite claims, is far from providing a clear picture of what our climate is doing and why, both from non-human and human causes.
Bottom-line, climate is a non-stationary chaotic process by all data and analysis…and the evidence we have “flipped” into a different attractor over the last several thousand years is simply not there…and there’s no way to predict, by definition, if we are likely to do so for any reason any time soon.
So, bdgwx, thanks for your interpretation, but it’s meaningless….
Thanks for this comment.
It closely reflects what I was thinking –
“climate” is a very imprecisely defined human construct.
The most honest conclusions scientists could publish about “climate” would be –
“we can’t be sure”,
“we don’t know”,
“weather has no set rules”
“always expect the unexpected”
Just so there is no confusion my interpretation of “very close” does not include something that deviates by nearly 1σ.
By definition it does.
To each his own. I am curious though. What is your definition of “close”? What is your definition of “very close”?
“Close is good enough for horseshoes and nuclear weapons.”
68% of all the measurements around an average will fall within 1 standard deviation if the measurements are normally distributed. How much closer would it need to be for you to consider it “close”? Also, the trend slope is less than one standard deviation per decade from the mean value. Is it significant?
I do consider 2021 to be close to the 1991-2020. I just don’t consider it to be “very close”.
The σ = 0.6e6 figure has units of km2. The trend figure of -0.44e6 has units of km2/decade. You cannot compare the two numbers because they have different units.
Nature has no shareholder of whatever deviations.
Consider that in any given year, the variation, to one sigma (0.66e6), is greater than the trend which is -0.044e6 per year. That’s a factor of 10 in any given year. This suggests that the trend isn’t really a trend.
It’s not a unitless factor of 10. It is a factor of ~10 1/yr.
Precisely it is
0.66e6 km2 = -0.044e6 km2/yr * -15 1/yr
or
0.66e6 km2 = -0.044e6 km2/yr * 0.00000047 1/s
So we can also say it is a factor of ~5e-7 1/s. Note that 0.00000047 1/s is the same as 15 1/yr.
Either way this doesn’t make any sense. You don’t say 60 miles/hour is 10x more than 6 miles anymore than you say 0.66e6 km2 is ~10x more than -0.044e6 km2/yr. The units don’t match and so you cannot compare the two.
Clearly, the comparison is between how much variability there is in the annual maximum sea ice extent and the magnitude of the increase or decrease per year. In a nearly horizontal graph with a large scatter, a very small slope is suspected to be an artifact of the large scatter and not a meaningful trend. We need a lot more data before we can draw any conclusions. Even more important, we need a lot more understanding of the drivers of Arctic sea ice.
The comparison I made was between the average of the annual mean from 1991-2020 and the annual mean of 2021. We can do the same comparison with the maximum and minimum as well though.
1991-2020 max: 15.25e6 km2 with σ = 0.45e6 km2
2022 max: 14.93e6 km2
2013-2022 max trend: +0.02e6 km2/decade
1991-2020 min: 5.35e6 km2 with σ = 1.01e6 km2
2021 min: 4.76e6 km2
2012-2021 min trend: +0.07e6 km2/decade
What we can say from this is that both the max and min are close to the 1991-2020 average and that both the max and min have stabilized over the last 10 years.
On a normal distribution 32% of values are outside 1 standard deviation. That is why science uses 3 standard deviations before you even get interested .. oh wait this isn’t science it’s climate science my bad.
Want to have a guess how many 1 standard deviations something like the LHC collider sees?
There is no need to guess. About 68% of their observations lie with a 1σ window.
Lesson 2 … No some events don’t have normal distributions wannabee layman climate scientists like Nick Stokes fall down that hole continually.
So now lets see if you know some science … how would you check the distribution?
I use one of the formal normality or goodness of fit tests (Kolmogorov-Smirnov, Jarque-Bera, etc.) if I want an objective answer. Usually though I just overlay the sample histogram with a normal distribution plot of the same mean and standard deviation and eyeball it.
Have you tried it on the sea ice data 🙂
You are after all claiming the deviation is significant as in not just random variation.
Yes. I did. And no I never said the deviation was significant or non random.
What exactly is your challenge here? What does the goodness of fit to normal have to do with your challenge? Is any annual extent regardless of deviation “very close” if the 1991-2020 is normal? What if it is some other distribution? Does the distribution effect have any influence on the definition of “close” as well?
Why beat around the bush? What exactly are the conditions for determining if something is “close”? What exactly are the conditions for determining if something is “very close”? Why not just lay out the acceptance criteria like what I did?
You certainly hinted that the deviation was not important when you outright stated that “…both the max and the min have stabilized over the last 10 years…” As the max and min include the deviations – or, do you not do statistics this way? – then you definitely stated the deviations are not important.
Your thinking, your conclusions, and your statistical methodology(ies), are extremely suspect at this point.
I think you have me confused with the other posters here. I have never stated or even remotely hinted that deviations are not important. In fact I use them all of the time. It is the other posters that are challenging the definitions of “close” and “very close” that use deviations.
“…both the max and the min have stabilized over the last 10 years…” HUNH??? From the extremely limited data we have and that you have shown – and, in the grand scale of Earth’s timeframe, and even on the timescale of man’s existence, however you might define what being a human is, what data we have is EXTREMELY EXTREMELY EXTREMELY limited – there is NO “stabilization”, and especially when you look at each year separately…
[And, by the way, define “stabilization”… If you’re calling it w/in 1 sigma or 2 sigma or whatever STATISTICAL variation of some “mean” or “average” or what have you, well, we go back to the FACT that there is extremely extremely extremely limited data, and ALL of it from during the timeframe of the last few decades at best. So, to make ANY generalization w/r to “oh, the ‘data’ is showing ‘stabilization’ “, well, think on that some more. Or, not – you’re welcome to continue “opening mouth and inserting foot”… ]
Therefore, to say there’s been “stabilization’ over the period of 1991-2020 is, at best, wishful thinking on your part, and at worst, and closer to reality, utter rubbish on your part – and accomplished via statistical “methodology” as I’ll call it. Others would use a different term, like perhaps statistical “trickery”.
And, as everyone visiting this site more than once should know, STATISTICS AIN’T REALITY. At best – at the VERY best – statistics is a SIMULACRUM, a REPRESENTATION, to supposedly help us understand reality and see trends. That’s all.
As Loren C. Wilson commented a couple of days ago – “we need a lot more understanding of the drivers of Arctic sea ice.” Amen.
bdgwx: “…both the max and the min have stabilized over the last 10 years…”
grrlocks said: “HUNH???”
I standby what I said. The trend on the overall extent is -0.44e6 km2/decade. The trend on the min is +0.07e6 km2/decade. The trend on the max is +0.02e6 km2/decade. The -0.44e6 km2/decade trend on the overall extent is negative meaning the extent has declined over the last 10 years contrary to what Die kalte Sonne claims. However, the trend on the winter max and summer min is statistically equivalent to zero. Therefore one could reasonably describe the min and max as stable.
grrlocks said: “[And, by the way, define “stabilization”… If you’re calling it w/in 1 sigma or 2 sigma or whatever STATISTICAL variation of some “mean” or “average” or what have”
I am not defining it that way. Stable just means no change. The units of change in this context are km2/decade which we can assess with a linear regression.
grrlocks said: “extremely extremely extremely limited data, and ALL of it from during the timeframe of the last few decades at best”
All of the data is available for the two periods Die kalte Sonne referred to. Those are 1991-2020 and 2012-2021.
grrlocks said: “Therefore, to say there’s been “stabilization’ over the period of 1991-2020 is, at best, wishful thinking on your part, and at worst, and closer to reality, utter rubbish on your part”
Nobody said anything about stabilization over the period 1991-2020. What Die kalte Sonne said was “Arctic Sea Ice Stabilizes, No Trend Reduction In More Than 10 Years”. I am challenging that statement because the trend over the last 10 years (2012-2021) is -0.44e6 km2/decade.
bdgwx
last decade started with 2012 nad was by far the lowest on record, not sure where you are getting your numbers but I think they are a bit off.
Those aren’t my numbers. I got them from the NSIDC. See the link in my post. I encourage you to download the data and verify the numbers yourself.
Why do you suppose the NSIDC still uses the 1981-2010 mean for artic sea ice extent as the measuring stick as opposed to updating to 1991-2020 mean? I asked that question to NSIDC and they told me they didn’t want to confuse the public with an updated mean average for sea ice extent. I’m willing to bet my last dollar that if the 1991-2020 mean showed a greater disparity in current sea extent to the mean, they would have changed their measuring stick in a New York minute. Figures lie and liars figure.
The NSIDC does not use 1981-2010 or any period as the measuring stick. The values that they report are absolute in units of km^2; not anomalies like how many global average temperature datasets do it. But even if they were using anomaly analysis it wouldn’t change anything. The graphs would all still have the same shape and the trends would all be exactly the same.
Look at their home page for artic sea ice extent. They are still using 1981-2010 as their mean for sea ice extent on their graph. Why be so deceptive?
Ah…I see. I don’t know. I don’t think its deceptive since they clearly label it as 1981-2010. And its just a comparison with no more or less meaning than a comparison with 1991-2020. I do think it would be nice if there was 1991-2020 button for those that want to make that comparison and who lack the technical know-how to do it with the csv files.
NSIDC? There is the problem.
JAXA is -0.38e6 km2/decade as compared with NSIDC of -0.44e6 km2/decade.
BadWaxJob, Is that very close, close, or not close at all?
It’s very likely that very close, close and not close at all are not defined.
I was thinking within 1/4σ could be reasonably described as very close. That makes 0.38e6 km2/decade very close, albeit just barely, to -0.44e6 km2/decade given the uncertainty as reported by LINEST in Excel. I’m open to different viewpoints. What are you thinking?
And yet the Arctic is still covered with ice. And guess what? The Antarctic is, too. Cry your way out of reality, buddy.
All that dirt raining down on your head? That means stop digging. What a maroon. The Arctic is covered with ice. You can spew stupidity about it all you want, does not change the fact the Arctic is covered with ice.
I think you have me confused with someone else. I’ve not challenged the existence of ice in either the Arctic or Antarctica region. In fact, it’s quite the opposite. I’ve been trying to tell people that despite the fast decline in sea ice we observe today that both sea ice and land ice will still be around for thousands of years even with the most aggressive warming scenarios.
Was waiting for it and there it is, 180. Go for another, spin for us, we love laughing at that stupidity.
There is no 180 here. I’ve always accepted and advocated for the data which says there is still sea ice in the Arctic region.
So within 1 sigma. You do know what a standard deviation is don’t you?
Yes. I do.
Clearly not.
Sure I do. It is defined as σ = sqrt[Σ[(x_i – u)^2, 1, N] / N]. If you or anyone else wants to challenge this/my understanding go ahead, but considering this is a universally accepted definition I doubt you’re going to get much traction even with the most outspoken contrarians on WUWT.
He is trying to tell you what I stated above for 1 standard deviation 68% lie inside 32% outside. If you like it’s a 1 in 3 chance and occurs at that rate.
If you get excited about the significance of 1 standard deviation you aren’t a scientist as they wouldn’t even bother to run an analysis on that crap.
I’m not challenging what a standard deviation is. I’m not challenging that 2/3 of observations lie within a 1σ window. What I’m challenging is Die kolt Sonne’s description that the 2021 extent was “very close” to the 1991-2020 average. Let me put it this way. If we accept that the 2021 extent is “very close” to the 1991-2020 average then we must also accept that observed global temperatures are “very close” to predicted or modelled temperatures even from decades ago. The thing is…I don’t think either of those are what I would describe as “very close”. I’m more than willing to accept that they are close, but very close? And as I’ve repeatedly said I’m completely open to different viewpoints so if you have a definition in mind for “very close” then just present it.
Then your definition is a bullshit layman one that differs from science we have accepted values for significance … do you know what they are?
Absolutely. I definitely want to know what your definition of “very close” and “close” is.
Close is anything that isn’t significant because it can occur simply by chance and you always have to err to the negative of your hypothesis … THAT IS HOW SCIENCE WORKS. Layman use other Bullshit criteria like you seem to be using.
Your definition of “close” is consistent with mine. I have already said multiple times in this subthread that I think any 1 sigma deviation from the mean including the 2021 extent wrt to the 1991-2020 is “close”. So what exactly is your challenge here?
Aw man, that’s 252 years till its all gone…
This is just soooo poor, I mean, can it not hurry up a bit
I wish, want, no I demand a shallower thermal gradient between the equator and the North Pole.
Be gone Foul Ice, no more besmirsch my view. And my weather
I wand a nice shallow, tending to zero thermal gradient like I was promised, so that those horrible storms, tide surges, wind, hails, thunders, colds and anticyclones can be gone.
No more
(Esp them anticyclones, you’d never fetch one of them home to meet yer mother that’s fo’sure)
On top of that, because of my being of ‘peasant extraction’, I want/demand that I can grow hundreds of acres of hay to feed my cows and horses, just like my grandfather did
I want to be able to grow heirloom wheat barley and oats, crops that grew to be over 7 foot tall and did not get blown over by all the wind and storms we have now.
Crops that did not get wasted, out in the field, because of all the rain
Crops that I could plant in the springtime without fear of them being washed away or frozen just after planting
Crops that I could harvest in the autumn without crop propane crop-dryers, without Glyphosate desiccants and without it being an insane race against the weather.
A nicely melted arctic will assure those things. bring it on.
(And a bit faster than 250 years ffs, we ain’t got all day yanno)
Just how did my grandfather manage all those, now impossible, things?
You can’t extrapolate out to “all gone” using a linear regression. There are a few reasons for this. The sea ice on the northern edge of Greenland is being augmented by the ice sheet and will continue to exist as long as the ice sheet exists. Winter sea ice even the open waters will likely exists as long as the ice sheet exists as well meaning that there will undoubtedly be a decline in the rate of decline of sea ice in the distant future. Realistically we’re probably looking at several thousand years before the sea ice is “all gone”.
“You can’t extrapolate out to “all gone” using a linear regression.” Really? Has anyone told Peter ‘a farewell to ice’ Wadhams of this fact as I’m pretty damn sure that’s exactly how he does his ‘science’.
You missed the fact he was parodying the whole wet-your-pants-with-anxiety thing.
Scientists crying about the extent of ice even though it’s really an unnatural thing, only since the last 35-ish million years has Antarctica been covered with ice, and about half that for the north. Any sensible person would be cheering the melting of the ice caps, make it much better off for the plants and animals – make the world bloom and teem with life like during the Cretaceous.
If the desire is for ice caps to melt we can use our understanding of physical laws to make it happen at an ever increasing pace. The first thing I would advise is to mitigate pollution since aerosols increase Earth’s albedo. The secondary benefit there would be the general health of people. The next thing I would advise is to extract as much fossil carbon as possible and inject it into the atmosphere as various carbon molecules. CH4 and CFCs are potent GHGs but they have a short lifespan. The warming would be initially slower with CO2, but CO2 has the advantage of sticking around in the atmosphere for a long time. Nature will fight against us though since the oceans will buffer a lot of the atmospheric CO2. To mitigate that we might be able to geoengineer a durable barrier on the ocean surface that reduces the buffering capacity. That might be technically and economically difficult, but humans are resourceful so I wouldn’t put it past us to solve that problem. Even if no solution is found to that problem enough CO2 should be retained that we could reduce the ocean’s buffering capacity by de-facto with the temperature increase. It might not be easy but I do think given enough planning, time, and resources I truly believe we could get the Earth back into the hothouse state like during the Cretaceous if that is what everyone wants.
Hmmm, and “they” don’t care what everyone wants.
And inspite of your crying the Arctic is still covered with ice. Nothing you feel changes reality, sweety.
I think you have me confused with someone else. I’m not crying, losing sleep, alarmed, anxious, etc. by the NSIDC, JAXA, or DMI data. Nor have I ever challenged the existence of ice in the Arctic region whether it be sea ice or land ice. And I fully understand that my feelings have no impact on the evolution of ice either way. The laws of physics simply do not care about my feelings. In fact, that is something I try to reiterate to the other WUWT participants myself.
No confusion on my part, the Arctic is still covered with ice and your feelings are irrelevant.
We are both on the same page in that regard so what’s the issue?
But a lot of Climate Science (TM) projections are based on linear extrapolation. Something my Professors abhorred.
In several thousand year we are more likely looking at the next glaciation.
Encore! Shakespeare, eat your heart out!
It’s amazing how enjoying the (fermented) fruit of one’s labors can help one wax eloquently
after a long day of walking behind the plough!
Exactly right – the biosphere would be much better off if the Arctic was completely melted and all that precious water circulating in the atmosphere and raining down on the Sahel and the Sahara, and any other parched area. While the Arctic has “stabilized” over the past few years, Somalia is facing another year of drought and from the Copernicus site itself it mentions Portugal enduring a drought.
But, but, but… the Settled Science™ says the arctic ice vanished in 2014.
Right . . . Al Gore, a shining proponent of the science-is-settled crowd, in 2009 at the UN Climate Change Conference (COP 15), promulgated the meme that there was a 75% probability that the entire Arctic ice cap would be completely gone during some summer months “within the next five to seven years” . . . that is, by 2014 to 2016.
Hear his direct words at the 2m5s point into the video available at https://www.youtube.com/watch?v=MsioIw4bvzI
Oh well, sic transit gloria.
Gloria got sick getting transed?
No. Gloria gets sick in minivans. But probably only on a Monday.
Climate Science – the field of study that involves pulling important sounding numbers out of one’s butt and pretending they are fact.
But that was only 75%, after all.
True . . . but I’ll take those odds to Vegas any day, any time.
Is it now fair to say that all those AGW/CAGW alarmists are skating on thick ice?
Well, in any event it’s very thick, thick or not thick at all
Jim Steele recently did a WUWT post that covers the drop in Arctic Ice after 1990. A must read!👍👍
https://wattsupwiththat.com/2022/04/25/the-big-5-natural-causes-of-global-warming-part-1-varying-atlantic-water-transport/?utm_source=rss&utm_medium=rss&utm_campaign=the-big-5-natural-causes-of-global-warming-part-1-varying-atlantic-water-transport
A great comment by Gordon A. Dressler listed his 6 likely drivers of global temperature,
with one of them from Henrik Svensmark’s work on cosmic radiation. A video by Svenmark,
etal, further explains their affect on clouds, also noting that we pass through an arm of
the Milky Way ~ every 150M yrs, coinciding with the 4 cool periods in the last 600M yrs.
Food for thought- a must see!
https://wattsupwiththat.com/2022/04/25/the-big-5-natural-causes-of-global-warming-part-1
-varying-atlantic-water-transport/?utm_source=rss&utm_medium=rss&utm_campaign=the-big-5-
natural-causes-of-global-warming-part-1-varying-atlantic-water-transport#comment-3506147
An utterly ridiculous statement…
Ummm . . . due to its absence of reference, I must conclude your post is self-referential.
Then row a boat to the North Pole, lie spewing liar. Go for it.
The first time I’ve upvoted a griff statement.
What statement is that?
Meanwhile your typical drive by one liner an indication you have little to offer which is a common failing of warmist/alarmists worldwide.
Cheers
I know you never reply, but perhaps you can make an exception this time; what year will the ice have all disappeared?
The question wasn’t asked of me but I’ll try to answer anyway. There are no specific predictions of “all disappeared” that I am aware of, but the general consensus is that it will be several hundred years at a minimum because the sea ice north of Greenland is augmented by the ice sheet. There are predictions of both annual average sea ice extent and of the summer minimum going “essentially ice-free” (< 1.0e6 km2). In 2001 the IPCC predicted that the annual average would not drop below 10.5e6 km2 until about 2040. And in 2021 they predict that it is likely the summer minimum will drop below 1.0e6 km2 by 2050.
Wow you must not read anything that the high priests of your religion say because there have been several Algore, Mike (Piltdown) Mann and others have all made pronouncements of the imminent death of sea ice.
I read a lot of stuff. That doesn’t mean I’m going to accept contrarian opinions that are contradictory to the abundance, consilience, and consensus of the evidence.
budgeriagarwx’s favorite source of ice data, NSIDC, were major promulgators of the Polar ice melting fallacy.
budgeriagarwx’s ignorance of NSIDC’s polar ice alarmism must stem from willful ignorance.
“but the general consensus is that it will be several hundred years at a minimum”
Well, that’s not what “ice expert” Peter Wadhams says. He predicted it would be ice free 10 years ago. You’re going against the “expert consensus” – be careful or Mike Mann will block you on twitter.
One scientists opinion a consensus does not make. I am not going against the consensus of 2050 for “essentially ice-free” by dismissing the opinion of a single scientist in a newspaper interview even though his peer reviewed publication says something completely different and aligns better with the consensus.
A quick look at the conclusions of that paper has him claiming we’ll be ice free before 2050. We can all have a good chortle when that doesn’t happen.
Now, can you explain why he was dishonesty touting around to the media a date of 2012 for an ice free arctic? What kind of scientist lies about his own research? Does this makes Wadhams no better than the charlatan and inveterate lier Mike Mann?
BTW You in one breath you said you’re not going against “the consensus of 2050 for “essentially ice free” ‘ Yet in a previous comment you said, ” several hundred years at a minimum” Make your mind up!
I have no idea why he said what he said. I’m certainly not going to defend it. And if you track my posts you know I’m not friendly to contrarian predictions like these.
I will, however, standby and defend what I said. That is the consensus prediction for less than 1.0e6 km2 at the summer min is around 2050. That is the definition of “essentially ice free” as used in academic literature. The case of near 0.0e6 km2 year round is at least several hundred if not several thousand years away. That is the definition of “all gone” I was working with in my response.
Griff has gone Mosher gangster drive by 🙂
“An utterly ridiculous statement…” said by an utterly ridiculous person! 😮
An abysmally irrelevant person desperately trying to appear relevant. If he had a touch more courage he’d be out supergluing himself to cooking oil lorries!
So, in conclusion, Arctic is still covered with ice. Got it.
And so is Antarctica, where in the east they have been having colder than average temps for this time of year.
Yea, I was just whacking him with the one reality brick since he clearly can’t handle more than one stream of thought at a time. 😎
I never really could understand what the fascination is with floating artic ice anyway. Do the ice cube test. Mark a glass of water and ice cubes, let it melt and where do you suppose the water level would be? If you said unchanged that would make you a climate denier.
It’s one of those proxies the alarmists decided long ago to point to even though in the shorter term it is not even close to be a reflection of true temperatures. I mean, you can’t have polar bears as your icon of “climate change” unless you can make memes, doctored images, and other propaganda, that shows they are threatened by us evil humans using fossil fuels after all.
The ocean has an albedo of about 0.05. Sea ice has an albedo of 0.7. A decline in sea ice increases the planetary energy imbalance. That is the sea ice albedo feedback.
Given the latitude the impact of that change in albedo is trivial. Moreover, you seem to have overlooked the difference in reflectivity between vertical incidence and a low angle sun.
I have not overlooked the nuances of solar incidence angle. Despite the lower angle the annual isolation at the north pole is still 4e9 j/m2 as compared 9e9 j/m2 for the equator. Anyway, Pistone et al. 2014 found that the darkening of the Arctic due to sea ice loss increased solar forcing by 6.4±0.9 W/m2 in the region or 0.21±0.03 W/m2 globally and is equivalent to 25% of the previous 30 years of CO2 forcing of 0.8 W/m2. This is not trivial.
Never mind that the atmosphere is thinnest at the poles. And never mind that when that ice melts into water vapor it creates clouds.
There is only about 20,000 km3 of water in Arctic sea ice. That is a miniscule 0.0015% of the water on Earth. And since the heat of fusion (333 kj/kg) is considerably less than the heat of vaporization (2260 kj/kg) most of the melting will be in liquid phase. But even assuming all of it vaporizes why would the 0.0015% be more impactful than the 99.9985%? And how does a thinner atmosphere related to the albedo of sea ice versus open ocean?
Won’t more open arctic sea enable more heat to escape to space? Won’t that cool the Arctic Ocean? Doesn’t an increase in ice free sea in the artic tend to work as a brake on even more ice free sea in the arctic?
Yes sea ice puts a hat on the planet.
It allows more heat to escape to the atmosphere. More heat absorbed by the ocean and more heat flux from the ocean to the atmosphere means the atmosphere warms. Actually, because of the enthalpy of fusion there is a clamp on atmospheric temperatures above ice such that it really goes above 0C. Once you remove the ice the enthalpy of fusion clamp disappears and temperatures rise dramatically.
Tell me about sea ice albedo in the time ice is growing, , i.e. winter 😀
I’ll give it my best shot, but I’m not sure exactly what you are asking. Above 60N solar insolation is at its lowest at the December Solstice and at its highest at the June Solstice. At 90N the 0 W/m2 shunt occurs between the September and March equinoxes and peaks at 510 W/m2 at the June solstice. Little known fact…the North Pole peak at 510 W/m2 is higher than the equatorial peak of only 440 W/m2 due to the fact that insolation occurs all day versus half the day. Anyway, the sea ice min occurs in Feb-Mar while the max occurs in September. That means the albedo warming potential of the melting ice lags the solar insolation. What that means is that both the winter max and summer min are important in modulating the total amount of solar insolation that is absorbed by the surface.
“Anyway, the sea ice min occurs in Feb-Mar while the max occurs in September.”
Isn’t that back asswards for the northern hemisphere??
Yes. I meant to say the max is Feb-Mar and the min is Sep.
Wow, when you are wrong you just keep beating that dead horse till you are covered in bloody bits of dead horse and a thick layer of wrong.
I standby what I said. If you can present evidence that sea ice albedo and open ocean albedo are significantly different that 0.05 and 0.70 then by all means post it so that everyone can review it.
‘Tis but a scratch 🙂
That albedo is a funny thing, it only affects places that get a lot of sun light.
The North Pole gets 510 W/m2 of solar insolation on June 21st significantly more than the equator which only gets 390 W/m2. In fact, the equator only peaks at 440 W/m2 on the March and September equinoxes. Sea ice albedo is pretty big deal because the Arctic gets a lot of sunlight during the summer.
No no, its all about the polar bears starving and drowning. Remember, they are cute.
When I told a bunch of kids I teach that polar bears will hunt a human down and eat their own young they were shocked – they are constantly led to believe that the poley bears are all cute and fluffy and enjoy nothing more than a big cuddle.
The magnetic field strength of the solar wind is very small, as indicated by the high level of galactic radiation reaching the Earth’s surface. This means that, on average, the magnetic field strength of the solar wind increases very slowly in 25th cycle. The magnetic field of the solar wind, which strikes the Earth’s magnetosphere, provides energy to the high layers of the atmosphere, up to and including the stratosphere.
WSO observations at Stanford show a downward trend in the strength of solar dipoles, which is particularly evident for the equatorial solar dipole. This is certainly not a short term trend.
Any idea why it became so hard to find any up0 to date data on Total Solar Irradiance?
I have been looking for a while, charts stopped being updated a few years ago.
TSIS Total Solar Irradiance – Daily Average, Time Series
https://lasp.colorado.edu/lisird/data/tsis_tsi_24hr/
SORCE Total Solar Irradiance – Daily Average, Time Series
https://lasp.colorado.edu/lisird/data/sorce_tsi_24hr_l3/
NRLTSI2 Monthly Averages, Time Serie
https://lasp.colorado.edu/lisird/data/nrl2_tsi_P1M/
So arctic ice is trending down with random annual +/- mixed in. One region goes randomly + enough to get above the Anomaly line, and Die kalte Sonne says the sea ice stabilizes.
Looks like they are getting excited about a non-event.
Entire Northern Hemispher
During the La Niña period, ice in the Arctic melts slowly.
Solar wind energy increases the anergy of jet streams. The very slow increase in solar wind strength extends the La Niña period because the western equatorial Pacific too slow accumulates heat to allow the subsurface wave to move eastward. Therefore, no El Niño can form. The reason is that the energy of the jet current along the equator is too weak. It is almost certain that the Niño 3.4 index will drop below -1 C in May as solar activity increases.
http://www.bom.gov.au/archive/oceanography/ocean_anals/IDYOC007/IDYOC007.202204.gif
“No Trend Reduction In More Than 10 Years”
You can be sure that rising ice extent is being feverishly worked on by the Climate Wroughters as they have done with sea level, the Dreaded Pause, LIA, MWP, polar bears, fake acidification of oceans, demise of the GB Reef, wild fires started by activist arsonists, bogus accounting of costs for renewables…. They will bend the Ice Extent curve back down again.
According to Sea Ice Daily Extent, the extent today is higher than it was in 1989. Volume is probably a lot lower, but I like the current state.
https://nsidc.org/arcticseaicenews/sea-ice-tools/
A strengthening La Niña will bring typical weather to various areas of the world in the Northern Hemisphere. An increase in North Pacific and Atlantic activity can be expected, which means lower temperatures in the mid-latitudes and higher temperatures in the south. The threat of hurricanes on the continents will increase. Sea ice extent will fast in the south.
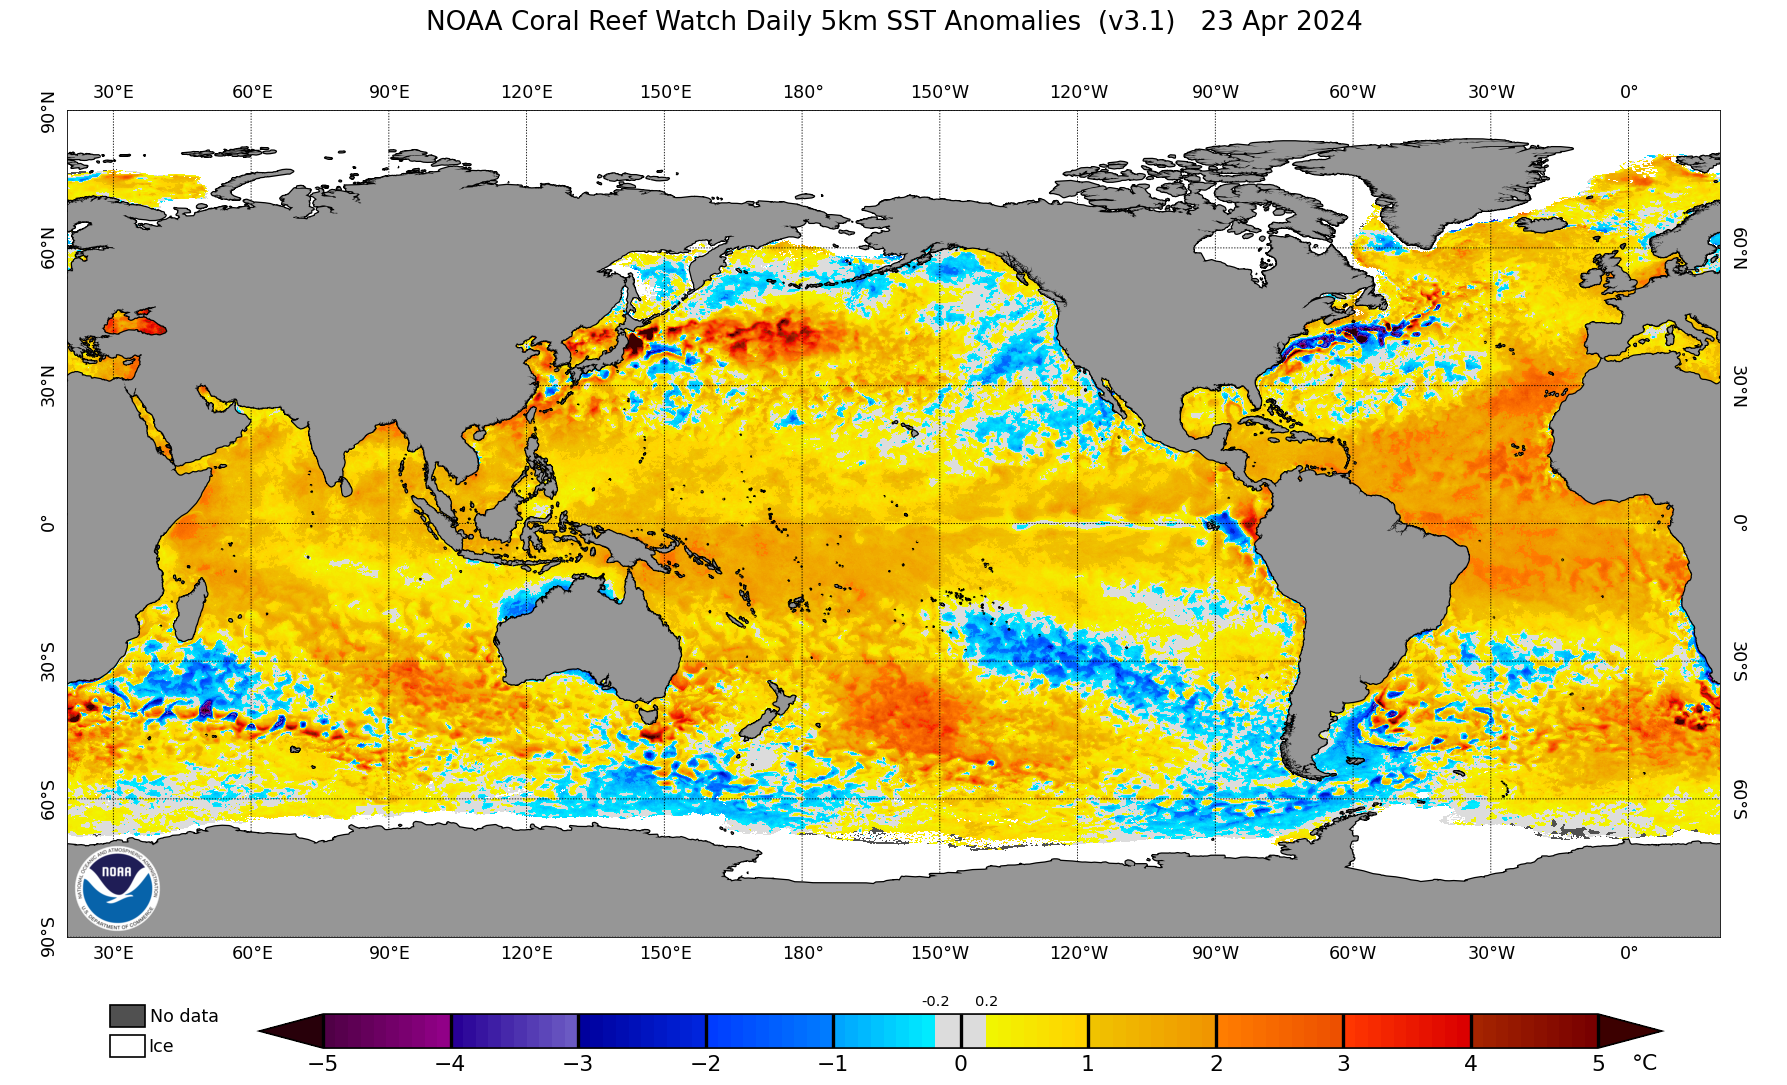
The ACE of the NW Pacific basin has been near record lows the last two years while that in the N. Atlantic has been higher than average. But over all the global ACE has been lower than average those two years since the most powerful storms, Typhoons, form in the NW Pacific Basin.
… https://nsidc.org/arcticseaicenews/
How did the extent of ice in the Arctic change from March to April 27?

It can be seen that the extent of ice in the Greenland Sea has increased.
I plotted the last 10 years, including back to 2012 here. It’s hard to see because of all the squiggles but I separated the lines out to show that the 2021 minimum was above the 2011-2020 average and that we are currently above that average.
I added some interpretation to go with that. This article at WUWT is what gave me the idea to start that new climate crisis busting thread…….thanks Anthony!
https://www.marketforum.com/forum/topic/83763/
Went to pittsburgh this week, first time in 26 months.
Usually I’m able to golf a green course with green trees in mid-April but this year majority of trees only starting to leaf out, and there was to be widespread freeze Wednesday night.
More clear evidence of CO2 induced global warming.
Frosty high in eastern Canada.
What did Valentina Zharkova say?
She said the solar grand minimum started 2 years ago and that the Earth would cool by 1.0 C between 2031 and 2043 [1].
I wonder if Javier can update the comment on his model projection from 5 years ago for Arctic ice . Has Nature listened to his projection ?