
.
This is PART 4: HOW PRESSURE SYSTEMS CONTROL CLIMATE
all earlier videos at
https://www.youtube.com/channel/UC7XNHEz2QCJ_Phf2mvDFk0Q/videos
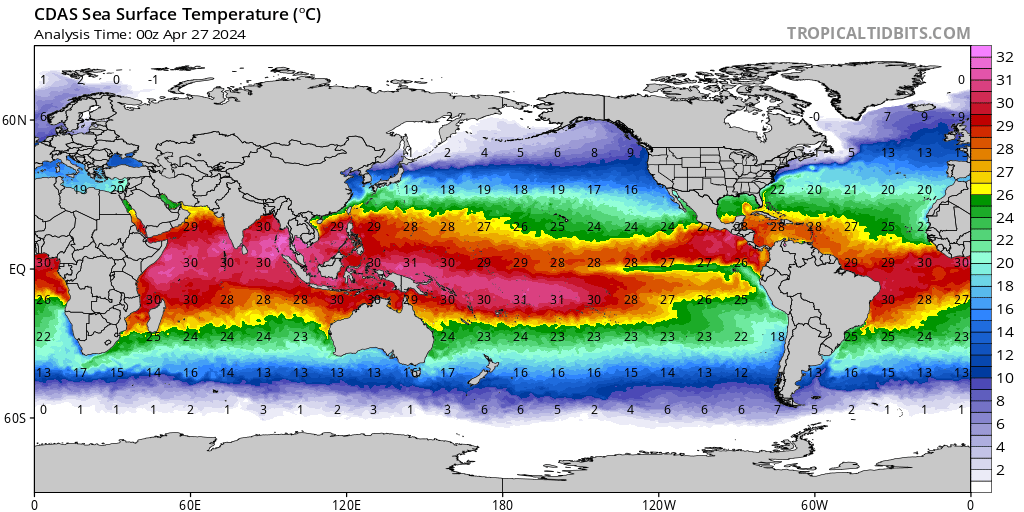
The video describes how the Indo-Pacific Warm Pool can drive climate change and explains the last 10,000 years of climate change, observed changes that contradicts CO2 theory.
Analogous to how a hot water heater services a home, a drained heater or drained warm pool can only transport colder temperatures. During the Little Ice Age, El Nino events were more frequent and reduced the warm pool.
With fewer El Nino events over the past 150 years, the warm pool has been steadily re-charging, and accordingly contributing greatly to the current warming trend.
For a transcript go to https://perhapsallnatural.blogspot.com/2022/01/how-global-warming-is-driven-by-pacific.html
Careful, you’re on heretical grounds using actual/historical data.
like Tony Heller
Jim, your proposal may make sense for some of the natural variability seen on multidecadal and multi centennial time scales.
But it cannot refute some AGW. Tyndall showed experimentally in 1859 that CO2 and H2O were ‘greenhouse’ gasses. It is fairly straightforward to estimate the ‘nofeedbacks’ CO2 doubling ECS. Curry on her blog posted one derivation (1.1C) back in 2010. Lindzen derived 1.2C in 2011. Moncktons much later equation produces 1.16C using IPCC inputs.
The uncertain issue is all about feedbacks, especially water vapor and clouds. ARGO salinity measurements now show that models underestimate tropical ocean rainfall by about half, meaning WVF is overstated 2x. That explains why they produce a tropical troposphere hotspot that in fact does not exist. Clouds at multiple scales are more uncertain per IPCC. That is why they have to be parameterized, which brings in the attribution problem (natural as you explain vs anthropogenic), yet another reason models run hot compared to observation.
Rud, You completely misunderstand, I am not refuting greenhouse gases have warming effects, but just how significant is that added 1-2 W//m2?? There are a few uncertain issues you ignore. All your greenhouse warming stats, that I am well aware of, do not account for CO2’s cooling effects as discussed in How CO2 Saves the Earth: Greenhouse Gases have Vital Warming & Cooling Effects
Also as the video shows, changes in the oceans warm pool drive air temperatures and air temperature have lagged behind warm pool temperatures. So how much does the greenhouse effect warm the ocean and warm pool?
CO2 infrared doesn’t penetrate more than a micron of the ocean’s surface and that energy is readily released with any slight breeze. Thus any warming of the ocean must be indirect, and that requires accounting for ocean and atmospheric circulation dynamics. As the video shows the warm pool is heated by waters originating in the subtropical gyres where solar heating is amplified due to reduced cloud cover and the greenhouse warming is reduced.
It is misleading to always frame climate change as driven by greenhouse radiative effects while ignoring the much stronger effects of the storage and ventilation of heat in the oceans! You seem to forget that the upper 10 feet of the oceans contain more heat than the entire atmosphere. Then consider the ocean’s average depth is 12,000 feet and that warm pool temperatures are 25C and higher down to about 300 feet.
Finally it is hugely misleading to argue higher temperatures are solely the result of added heat. Average temperatures often rise simply because there was less cooling. The best recent example is the north east Pacific Warm Blob. Hotter temperature were due to still winds situated below a high pressure system that evaporated less water and heat. Likewise the argument here is the Warm Pool is growing, not due to any great increase in heat, but due to a decrease in heat ventilation!
Thanks for your excellent articles.
The Earth’s climate system is complicated and I have several questions but I will restrict myself to one.
If greenhouse gasses were the whole story, one would suppose that equatorial regions on land would be hotter than the hottest region on the moon. Of course, they aren’t.
My guess is that the Earth’s rotation, air currents, and ocean currents redistribute the heat and reduce the difference between the maximums and minimums that would otherwise occur.
Am I barking up the right tree? The corollary seems to be that the greenhouse effect is overstated and that the effect of heat distribution is pretty much ignored.
Thanks CommieBob, you are certainly asking the right questions. Climate is certainly complex even without including greenhouse gases.
I like your moon comparison. The moon’s surface certainly heats up far more, to 273 F, without greenhouse gases to amplify temperatures. But without greenhouse gases and oceans to slow the cooling, temperatures fall dramatically at night. That’s why the alarmist always push “average” temperature. But maximum and minimum temperatures are driven by very different dynamics, and averaging the two violates the statistics of averaging requiring the “things” to be averaged to have any meaning.
To understand natural climate change we must as you say determine the effects of “rotation, air currents, and ocean currents that redistribute the heat”
It illustrates why citing the standard deviation is important. A
‘spike’ will have a very small SD, while a nearly constant temperature will have a very large SD associated with the average.
I agree with you that the standard deviation is important, Clyde.
However, while I can see that a frequency-distribution that can be characterised as a ‘spike’ will have a very small SD, wouldn’t ‘a nearly constant temperature’ be characterised precisely as a ‘spike’ and have a very small SD accordingly? After all, the SD is a measure of the variability in a set of scores; no?
Once again the comparison is inappropriate. If you want to discuss the effects (or not) of GHGs, the appropriate comparison is a planet with an atmosphere containing GHGs and a planet with an atmosphere without them.
What happens on the airless moon is irrelevant.
If there were no GHGs, the surface would be impacted by more energy and heat up much more than it does now. The air above would be heated by convection and, lacking any radiative gases, would remain hot, day and night, accumulating heat as time passed.
The main impact of adding GHGs like water to the atmosphere is to drop the air temperature about 90 degrees C.
Rud, you missed one point about ocean heating. They are not heated “indirectly”, they are heated by direct absorption of radiation above the IR frequencies.
Jim, your main points are well explained and I enjoyed the article.
I’m the one who raised the airless moon.
Anyway, it sounds to me like you’re trying to re-invent Maxwell’s Demon.
However you describe “greenhouse gasses”, just realise they have no influence on Earth’s energy balance.
The most powerful factor in regulating the energy input is tropical cloud. Its formation is surface temperature controlled to limit ocean temperature to 30C.
On the cooling side, sea ice is a dominant factor in controlling heat loss. Sea ice forms an insulating blanket that keeps the water below at -1.8C. The cooler the surface, the thicker the ice.
There are two temperature regulating processes that control Earth’s energy balance. “Greenhouse gasses” can be described however you like but they are irrelevant to Earth’s energy balance.
Over time, the Earth radiates as much energy as it absorbs, plus a bit for geothermal heat. So, yes, greenhouse gasses don’t affect the Earth’s energy balance.
Having said the above … I now live in southern Ontario (Canada). Outside on a warm summer night, I feel like I’m enveloped in a warm comfy blanket. When I’m back on the Great Plains of my childhood, outside on a summer night, it feels like I’m directly exposed to the stark cold of outer space. Given that dry air is a lousy heat conductor, I attribute the feeling to the fact that there’s no water vapor to act as a greenhouse gas. It’s like my body’s heat is radiating straight out to the cosmos.
What you feel does not control the energy balance on Earth. You will feel cooler under a cloudless sky because, like the surface, you are radiating to very cool space and not to a warmer cloud.
However this is only a local observation. Globally, land is always a net loser of energy. There is always net heat flow from oceans to land.
The ocean energy balance is regulated by upper and lower thermostats that are both controlled by the formation of ice. The lower limit -1.8C due to sea ice insulating and the upper limit 30C due to cloud ice reflecting.
So you can perceive the “greenhouse effect” however you like but it plays no role in Earth’s energy balance. The energy balance is the consequence of two very powerful thermostatic processes working over ocean surface.
OMG…you feel cooler in lower RH due to h20 evaporating from you skin…
That is why ice forms on rocks by morning in Death Valley after a clear day of 120-130 F temps. However, if clouds form overnight the ice does not form. Unmistakable evidence that CO2 does practically nothing to trap heat.
Practically speaking I’m starting to think you’re correct.
You can clearly see the effect of CO2 in both the downwelling and upwelling spectra . In spite of that, the evidence seems to be that the effect of CO2 is swamped by other phenomena.
There are two things:
1 – CO2 lags temperature.
2 – If CO2 increases surface temperature, why isn’t the surface of Death Valley hotter than the surface of the Moon?
Something’s keeping Death Valley cool. LOL Clearly there are other things at work that swamp the effect of CO2.
That is true Rick. One more item to add to the energy balance would be the heat added by volcanic eruptions not just on land but under the oceans in the form of submarine volcanos and thermal vents. It is the later for which scientists have no estimate. They keep saying volcanos are a constant, however, I disagree especially with the two volcanos erupting in 2021 in Iceland and the Canary Islands.
Jim, with all due respect, I had to come back to this thread. Much misunderstood, in my opinion. I never said your tuff was not possibly partly natural variation explanatory, indeed, started with the opposite,
my only, and remaining after your impassioned critique, is that your explanation of natural variation DOES NOT negate an AGW confirbution.
To deny otherwise (like Monckton) simply pushes the incredulity envelope. Do not go there, because only empowers warmunists.
Rud I hope you are not saying what it sounds like.
It seems you are arguing my analyses shouldnt be based on the science I present, but must be limited by how warmunistas will react. Really????
I have no credentials to add to this other than concern. Having read further down it seems to me ( I’m no proper judge of the scientific content ) that some get their knickers in a knot too easily. There may be previous history between some here but it serves little purpose to slag one another who may disagree about some specifics but agree about the end purpose; which is not who has the best/brightest theory but about preventing the Co2 mob from destroying our countries and the welfare of future generations.
Your “Reply to Jim Steele” would more aptly be directed to Mr. Istvan.
Although not absolutely clear my reply was to everyone on this thread as may be evident from the pronouns used; perhaps you could reread in that context.
How does this explain the pattern of global warming evident in the temperature record since the1880’s?
Bill here’s your choice of explanations for warming.
1) The claim that the rate of cooling in the atmosphere has been slowed down by rising CO2 since 1900
or the argument here
the rate of cooling in the ocean has slowed down by having fewer El Ninos since 1700
What you say hsas no bearing on what I am saying.
Au contraire! The current narrative is global warming is caused by a slow down in atmospheric cooling, initially caused by rising CO2 that climate scientists argued became significant by 1950, not 1880.
In contrast this whole video is about how cooling of the ocean warm pool that has slowed down since the late 1700s, due to ITCZ migration and ENSO effects. Oddly you asked for an explanation that the video had provided in detail, so I couldnt fathom why you would ask how does the video explain the warming,
So I assumed you must hold another theory which blinded you to what the video had explained.
Or perhaps you didnt understand the science in the video, so a question that showed precisely what you are questioning or disagreeing with would help the discussion
I’m talking about the alternating thirty- year periods of warming and pause in warming that comprise the temperature record while during the same period, atmospherc CO2 level constantly rises.
Oh, that pattern. I believe the best explanation is the dynamics of the Pacific Decadal Oscillation which is intimately connected to ENSO. Johnstone_2014 published “Atmospheric controls on northeast Pacific temperature variability and change, 1900–2010″ suggesting the PDO can change pressure patterns and circulation patterns in a way that explains a century of regional climate change
Is there a thirty- year pattern to the Pacific Decadal Oscillation? I would think that whatever is causing the air temperature pattern of change occurs in the same pattern. I tend to think the answer lies in astronomy not oceanography.
The same goes for the reason behind the alternating five- hundred- year periods of warming and cooling or do you attribute that to ocean currents also.
We have a new Climate Puppet in Pennsylvania. He is apparently from the land of Fairy Dust and Unicorns:
Posted:February 8, 2021 02:42 PM From: Senator Sharif Street To: All Senate members Subject:Carbon Capture and A Clean Energy Standard in Pennsylvania In the near future, I will introduce legislation to modernize the Alternative Energy Portfolio Standard Act (AEPS), create a new Clean Energy Standard in Pennsylvania, and invest in carbon capture technology to help make Pennsylvania energy emissions 100% carbon neutral by 2050 while supporting the Commonwealth’s thriving energy sector job base.
In 2021, the original AEPS will expire – offering a chance to build a new framework better suited to our current climate and energy challenges. A new AEPS, together with a Clean Energy Standard framework running parallel to the AEPS, will put Pennsylvania on the path to becoming a national leader in the fight against climate change while protecting good Pennsylvania jobs.
The AEPS requires a certain percentage of energy purchased by utility companies for use by Pennsylvania consumers to fall under designated tiers of energy. The original AEPS gave an important boost to the renewable and alternative energy industries in Pennsylvania. Our legislation builds on this success by investing in carbon capture technology and incentivizing the use of net-zero carbon emission fuel sources. This new and updated AEPS will expand from two to seven tiers to include carbon constrained coal and natural gas, existing and advanced nuclear, and hydrogen energy sources. These new tiers will work to keep Pennsylvania’s expansive energy industry alive and thriving, providing support for energy jobs and additional investment in carbon capture technology that will transform energy industries throughout the Commonwealth.
Running parallel to the AEPS will be a Clean Energy Standard. The Clean Energy Standard is defined as an overarching standard for total reductions in carbon emissions encompassing all energy sources within the AEPS tier system. Starting in 2022, the Clean Energy Standard will lay out a number of carbon reduction goals and the dates in which they should be accomplished. The end goal of the Clean Energy Standard will be to have a 100% carbon neutral Pennsylvania by the year 2050.
Introducing a Clean Energy Standard and running it alongside a new and expanded AEPS will ensure Pennsylvania protects our important energy jobs and joins the rest of the world as a leader in tackling the challenges of climate change head on. Not only will the new AEPS tiers give a boost to integral Pennsylvania energy industries, the Clean Energy Standard promises to ensure an environmentally friendly Pennsylvania for a long time to come.
I urge you to reach out with any ideas and join me a co-sponsor of this important piece of legislation. Please contact Micah Mahjoubian at micah@pasenate.com if you have any questions.
PA residents time to bombard our Senate mwmbers the bill being proposed is SB979
All the downwelling IR (DWIR) warming claims are equivalent to measuring the amount of rain falling from the sky and claiming the world will eventually be completely flooded. In this case ignoring evaporation, latent heat convective transport and condensation. Yes, it’s called the water cycle for a reason.
There are similar processes related to energy flows in the atmosphere. Only looking at CO2 DWIR ignores convection, latent heat, conduction and other radiation flows. Any increase in DWIR will increase the upward flow of energy in these other areas. No one understands the exact result. AFIK no one has even tried to compute this value. Probably because it is too complex.
This is almost what happens in climate models. Integrating the precipitation minus evaporation for the CMIP5 climate models results in atmospheric water going negative in 3 years.
Climate models show many unphysical features – like tropical oceans being warmer than 30C over an annual cycle – a physical impossibility on planet Earth with the current atmospheric mass.
RichardM
You omitted the fact that increasing the CO2 concentration makes the atmosphere a more effective radiator of IR.
Most don’t even know CO2 has a critical cooling role. Without greenhouse gases 99% of the atmosphere couldn’t shed the energy it absorbed by conduction with. the solar heated surface
CO2, H2O, and CH4 may be greenhouse gases but mathematically and physically (physics) cannot have the effect on climate that the alarmists including the scientists claim.
Yep – we live on a planet with two ocean thermostats on ocean temperature that regulate the energy in and out – 30C upper limit -1.8C lower limit. The function of the regulators can be verified every day of every year for millions of years:
Go back 20M years or so when atmospheric mass was some 10% higher than present and the upper limit was 33C. And still conducive to abundant life.
Whatever you think “greenhouse gasses” can do, they do not control the energy balance on Earth.
The concept of “greenhouse gasses” completely sidesteps the idea of “refrigerating solids” – the particles that form from the most power greenhouse gas – water. Water solid and water gasses are the same matter, just different forms. It is a fools errand to treat them independently when attempting to understand their impact on the energy balance.
Clouds form from water vapour to regulate the surface temperature to 30C in tropical ocean warm pools. Ice in the atmosphere is far more dominant than water vapour in regulating the energy input. Tropical clouds can knock out 90% of the surface insolation – that is tremendous cooling power.
On the low side, sea ice regulates the loss of energy from the climate system to limit minimum ocean surface temperature to -1.8C. Sea ice forms an insulating blanket that dramatically reduces heat loss from the water below; a fraction of the radiating power of an open water surface.
Earth’s energy balance is controlled by an upper and lower temperature limit on ocean water. Whatever you think “greenhouse gasses” do and however you choose to describe them, they have no influence on Earth’s energy balance. The ocean surface temperature has two hard limits.
Yep. In order to posit catastrophic global warming, Hansen invoked positive feedback.
We can measure downwelling and upwelling radiation so the greenhouse effect of CO2 and H2O should be obvious to anyone more sophisticated than a novice in a nunnery. link
On the other hand, there is the apparent fact that atmospheric CO2 lags temperature. Also, the solubility of CO2 in the cold deep ocean is exquisitely sensitive to temperature (much more so than to partial pressure). I’m coming around to the opinion that the greenhouse effect of CO2 is swamped by other factors.
So what Rud, anyone can mental masturbate. Doesn’t mean it’s true in the actual atmosphere of planet Earth.
Can you answer the big question? The current level of CO2 in the atmosphere is 418ppm. It is evident that our greening planet has pushed along CO2, lately. The big question is can you split the sources:-
CO2 generated by Natural sources = Xppm
CO2 generated by Anthropogenic sources = Yppm
Total = 418ppm.
Yes, any and all of the Carbon Cycle studies do exactly that, albeit there are differences in their conclusions, and probably none of them are exactly right.
Thanks Clyde. CO2 level has moved up in the last 50 years however, do we know for sure if the increase is all industrialization. I am getting the impression that the Anthropogenic proportion, from the “97% who all agree”, is some where between “zero and I dunno”
Rud,
Read Tyndall again. He demonstrated that some apparently transparent gases were at best, translucent, and at worst, as efficient as a brass plate in preventing the transmission of some IR wavelengths reaching a temperature measuring instrument.
No mention of “greenhouse gases” – you just made that up.
So, that is before we had the physics of thermodynamics sorted out and nobody had even heard of quantum mechanics. You do understand that absorption/emission of IR is a quantum phenomenon and statistical mechanics is therefore inappropriate? R.W. Wood showed experimentally over 100 year ago that the greenhouse theory was wrong, and Seim and Olsen (University of Oslo) reconfirmed this as recently as 2020.
Any ECS higher than 1,1 to 1,2 degrees C warming per doubling of CO2 requires net positive feedback effects, which are rare in nature. IMO net negative feedbacks are more likely, for ECS between 0.0 and 1.0 C. In some extreme environments, the effect of more plant food in the air is cooling.
How accurate is the UAH Satellite dataset (Christy & Spencer)? I looked at it and saw that the trend is small but then I read this article https://www.theislanderonline.com.au/story/7109102/has-there-really-been-no-warming-of-the-planet-in-22-years/
What are your thoughts on this? In the article it says “Prof Renwick said the UAH satellite series was an estimate of temperatures in the lowest few kilometres of the atmosphere based on atmospheric radiation measurements and it was “fraught with errors“.
Every so-called “global temperature” dataset is fraught with errors. Most notably the fact that there is no global temperature.
hmmmm…. poor data, much of it based on proxies, and a far from complete understand of feedbacks, and they have the nerve to say the science is settled
There are numerous things wrong with the so-called Global Average Temperature (GAT) derivation caused by using poor statistical analysis. 1st, no time series analysis tools have been used at all. Most of what is happening with trends is using data that has not been made stationary. 2nd, sampling requires IID samples and using stations as samples from the NH and SH destroys any “random” sampling. 3rd, winters are spread over 2 years and should be contiguous. 4th, trying to average SST’s and land temperatures is meaningless. As JS points out, the heat content of the oceans don’t give temperatures that are equal to land temperatures. Trying to average the two together is really, really wrong. Heat contents are what should be averaged.
There are any number of other problems with the way statistics are done for the GAT and are just insane.
I completely agree. I’m wrestling with trying to understand why, when there is about a four-fold difference between the specific heat capacity of air and water, the water appears to be warming as though the ratio was only two-fold.
All of the early errors were fixed two decades ago. The most recent version, UAH6, implemented a better satellite aperture/Earth curvature correction. The ‘fraught with errors’ accusation is because it isn’t showing what the climate models predict. One of many ways to show observationally the climate models are just wrong. Others include absence of the predicted tropical troposphere hot spot, tropical ocean rainfall as measured by ARGO salinity about 2x modeled (why there is in fact no tropical troposphere hotspot), and observational ECS about 1.6-1.7C rather than modeled 3.2C. Models predicted sea level rise would accelerate; it hasn’t. Models predicted summer Arctic sea ice would disappear; it hasn’t.
Indeed. “Fraught with errors” sounds like a rat catcher slagging cats.
“fraught with errors”
First, not my style to be overly critical of other commenters here.
Really though, the “fraught with errors” link is The Guardian, a well known hyper-partisan operation which is all-in on the CAGW bandwagon.
Then they get disparaging. Behold:
“Perhaps the darlings of the denialist community are two researchers out of Alabama (John Christy and Roy Spencer).”
Calling these two a derogatory name, or at the least linking them to some “substandard” group is utterly unjustified and uncalled for. Both researchers are best described as “lukewarmers”, who deny nothing.
Then we have this:
“These contrarians have been shown to be wrong over and over again, like in the movie Groundhog Day.”
The fact is that the AGW crowd and the IPCC have been wrong about *everything*. Christy and Spencer have shown over 40 years that the climate is doing now what it has always done. That it is warming at a rate about half of what the IPCC predicted and predicts for the future.
The IPCC is wrong and the UAH data set is perhaps the most solid data set in all of climatology.
Yet Prof. Renwick would have you believe just the opposite. This is the problem.
Check this out:
If you can not win a debate, how to *avoid losing* in 3 easy steps:
1) Make outrageous claims about your opponents, defame them personally to the extent you can get away with it. Impugn their work with all kinds of criticism, your criticism need not be valid, at all. No matter, the dirtier, the better.
2) Step back and wait for the response. Hopefully, you will have created a firestorm.
3) Rejoin, say “Look at all the controversy, there must be real problems with their work!”
And that is how you do it in Climate Science.
I hope this helps clear things up for you.
{for the record: Over the years UAH has been corrected with better calibrations for things like satellite drift and inter-satellite calibrations. These corrections typically have been on the order of a few hundredths of a degree.
Meanwhile NOAA and NASA-GISS correct their data sets by 10 times more and have done so continuously for some 30 years now.
Yet the AGW people can not stop talking about UAH corrections and never mention their own which have more than doubled the apparent rate of warming in their own records.}
How about that?
Thank you. Huge sigh of relief.
Ok, so for those 4 satellites you’re implying that they’re the ones with many multiple errors? Is there any hard proof that does validate the fact that these satellites have errors? In the article it said that all four of these satellites agree with each other. Otherwise thank you for the clarification. I’m only asking because this has made me realize that I can never just take someone’s word for something and that I need to see actual proof.
Over the decades a whole constellation of satellites have been used. I am aware of the diurnal drift error and recalibration only because Roy Spencer wrote about it at some length. He explained it all in posts at his blog and here at WUWT, giving us a fascinating inside look at the goings-on with the keeping of the UAH data set. For those inclined, the full details including orbital parameters and mathematical algorithms were published in the scientific literature. It is this forthright openness and acknowledgement of errors which gives us confidence in the final result.
You write:
“Is there any hard proof that does validate the fact that these satellites have errors?”
That is probably not the right question.
The errors crept in as the orbits drifted. Once this was properly understood, the temperature algorithms were changed to take the drift into account. Then the UAH data going back to the start of the problem were recalculated. So this error was dealt with and eliminated from the system.
As a final note, diurnal drift is only a problem with the older satellites. The magnificent Landsat satellites have station keeping thrusters which maintain their orbits without drift.
For more information you can surf over to Dr. Roy Spencer’s blog, link in the WUWT blogroll. Roy has a page listing some of his publications. All you ever wanted to know about satellite temperature remote sensing.
Correct. I have a number of the NASA datasets, which start back at 1880. The more recent data sets show that 1880 is now colder, than we first thought and of course the more recent years temperatures are warmer than we thought. So the trend line becomes steeper. It’s useless trying correlate this junk data up with CO2 .
UAH6.0 1979 – 2021 precisely accords with HADSST3 sea surface trend 1979 – 2021.
The satellite sensors have drifted and UAH and RSS don’t agree on which ones are correct. About 2015 they were close, now about .5 C difference. Seriously far enough apart that neither can be trusted until a new comparison to weather balloon stats is issued. Check WoodForTrees site for graphs.
At about that time, one of the major players updated their surface air temperature series. To absolutely nobody’s surprise, the new version showed even greater warming across the record. {as had happened so often in the past}
A prediction was made – That Dr. Mears would become under pressure to modify the RSS record to keep pace. Sure enough, within 9 months a new version of the RSS data set was announced. Surprise, the new version showed more warming than previously. Dr. Mears explained that the change was made to make RSS come into greater agreement with the surface record. Dr. Mears was quite candid and open about it.
So where are we now? RSS is no longer an independent measure of anything. As of now it is just a data set which is modified as needed to match other data sets.
The whole episode caused quite a stir at the time, although most of us were familiar with these types of games getting played in Climate Science. I guess 2015 was far back enough that not everybody is familiar with the story.
Satellite sensor drift had *nothing* to do with it.
“ *nothing* to do with it”
Then I refer you to Dr. Spencer….
https://www.drroyspencer.com/2019/04/uah-rss-noaa-uw-which-satellite-dataset-should-we-believe/
One point I didn’t emphasize enough in this video but am adding here, is as the re-charging of the warm pool increases heat in the Great Ocean Conveyor Belt, and that heat gets transported into the Arctic, it creates a positive temperature feedback that melts more Arctic sea ice which allows the great quantities of heat stored in the Arctic Ocean to more readily ventilate. It is that short term ventilation of heat that has biased the global average temperature. Like an El Nino event, that heat ventilation paradoxically cools the ocean while warming the air yet this “dynamical warming” is falsely attributed to radiative heating from rising CO2.
There are 4 previous videos that discuss heat transport into the Arctic, the first video is at https://www.youtube.com/watch?v=KNT7oB53pRY&t=88s.
And all 4 can be found at https://www.youtube.com/channel/UC7XNHEz2QCJ_Phf2mvDFk0Q/videos)
There is an 8 month lagged positive feedback from El Nino episodes, to major warm pulses of the AMO and hence Arctic warming, e.g. in August’s 1998, 2005, 2010, 2016:
https://psl.noaa.gov/data/correlation/amon.us.data
Also the huge warm AMO pulse in 1878 after the 1877-78 super El Nino.
Where we always butt heads Ulric is you always compare your apples to my oranges.
An El Nino event does not add water to the ocean conveyor belt, just the opposite But an El Nino does push the location of intense convection eastward that alters atmospheric circulation that may indeed increase the AMO, but that’s not thee issue being examined here. So please, stay on topic.
Are you arguing that El Nino events don’t drain the warm pool???
You have associated re-charging of the warm pool (increased La Nina conditions) with increased ocean heat transport into the Arctic. But the reverse is true for the dominant source of ocean heat transport into the Arctic, the North Atlantic, that increases with increased El Nino conditions.
Again comparing your apples to my oranges! Again you confuse short term effects of ENSO with current El Ninos happening every 3-7 years with the much longer term dynamics of the warm pool.
Indeed, I associate increased warm pool re-charging with increased heat into the Ocean Conveyor Belt which ultimately reaches the Arctic . How long do you think the transit from the warm pool to the Arctic takes? 50 years? 100 years? 400 years?
It is estimated that it can take 1,000 years for a “parcel” of water to complete the journey along the global conveyor belt.
https://oceanservice.noaa.gov/education/tutorial_currents/05conveyor2.html
So that is outside of the range of the last 50 years of global warming, where the Arctic has warmed with the warming of the AMO. And to quote your original comment:
“the re-charging of the warm pool increases heat in the Great Ocean Conveyor Belt, and that heat gets transported into the Arctic, it creates a positive temperature feedback that melts more Arctic sea ice which allows the great quantities of heat stored in the Arctic Ocean to more readily ventilate. It is that short term ventilation of heat that has biased the global average temperature.”
You began with short term and then shifted the goal posts to a 1000 years, you’ve turned your own apples into oranges.
Jim, I like the “growing warm pool” concept….but someday, what will be the primary cause of it shrinking again ? The rotation of the planet causing cold deep ocean waters to displace the warm surface over maybe a thousand years ? Salinity gradient changing as northern ice melts ? Reduced SW cloud reflection over warmer ocean ? Milankovitch cycles resetting the temperature clock ?
Jim,
The process of discharge and recharge has been covered extensively by Bob Tisdale.
That process might be dominant within the 60 year periodicity of the underlying ENSO cycle but it does not help with the longer term climate variability of 1000 years or so from Mediaeval Warm Period to Little Ice Age to the Modern Warming.
For that we need to look to variations in the amount of solar energy that is able to enter the oceans in the first place and that involves solar induced cloudiness variations according to my hypothesis:
https://www.newclimatemodel.com/is-the-sun-driving-ozone-and-changing-the-climate/
As for the general proposition that the oceans drive atmospheric temperature variations then I have been mentioning that for 12 years or so:
https://www.newclimatemodel.com/the-real-link-between-solar-energy-ocean-cycles-and-global-temperature/
‘Before it is safe to attribute a global warming or a global cooling effect to any other factor (CO2 in particular) it is necessary to disentangle the simultaneous overlapping positive and negative effects of solar variation, PDO/ENSO and the other oceanic cycles. Sometimes they work in unison, sometimes they work against each other and until a formula has been developed to work in a majority of situations all our guesses about climate change must come to nought.’
Stephe I was an avid reader of Bob Tisdale’s posts.
AndI am not sure why you lecture me on cloudiness when the video clearly states the the equatorial currents that bring heat to the warm pool originate in the subtropical region where less clouds amplify solar heating. Did you watch the video at all? or are you just trying to insert your model ideas?
That said, it is hugely misleading to argue higher temperatures are solely the result of added heat. Average temperatures often rise simply because there was less cooling. The best recent example is the north east Pacific Warm Blob. Hotter temperature were due to still winds situated below a high pressure system that evaporated less water and heat. Likewise the argument here is the Warm Pool is growing, not due to any great increase in heat, but due to a decrease in heat ventilation!
Not trying to lecture you. Just trying to resolve the differences between your hypothesis and mine.
The main difference seems to be that you say there were more El Ninos with a more southward ITCZ whereas I suggest more La Ninas in that scenario.
From a meteorological perspective El Nino releases heat to the air which would push the whole atmospheric circulation poleward in both hemispheres. That means a more northward ITCZ with dominant El Ninos.
In the late 20th century warming spell there were more El Ninos and the ITCZ moved northwards.
Now, the northward progression seems to have stopped with the recent La Ninas.
The position of the ITCZ depends not only on the ‘bottom up’ perspective of El Ninos/La Ninas but also on the ‘top down’ effect of the sun on the atmosphere over the poles. It is a balancing act.
So, I would appreciate more detail supporting your proposition that El Ninos were more dominant during the Little Ice Age as compared to either the Mediaeval Warm Period or during the Modern Warming.
If it helps, I think you are saying that the ITCZ moves first and then El Nino/ La Nina events follow. You therefore need to specify what causes the shift in the ITCZ.
In contrast I say that the El Nino/La Nina balance determines the position of the ITCZ subject to any countervailing top down solar effect above the poles.
Again watch the whole video or read thee transcript. I paraphrase Schneider’s 2014 energy balance that moves the ITCZ.
So what are you again asking, “You therefore need to specify what causes the shift in the ITCZ.” ?????
I guess that answers my question that No you hadn’t viewed the whole video and are just trying to insert your model.
Schneider 2014 that I reference in the video reports ITCZ moved southward by 2 to 5 degrees during El Ninos.
As stated in the video paleo ocean data uses the equatorial Pacific temperature gradient to determine El Nino-like vs La Nino-like conditions. I sited Cobb 2003 coral proxy data whose paper show El Nino-like conditions during the Little Ice Age, Haug 2001 paper showing the ITCZ Holocene southward migration and Oppo 2009 who showed warm pool cooling during the Little Ice Age.I have yet to read a paper that refutes the ITCZ was not further south during the LIttle Ice Age.
There are many, many more papers I can cite. But clearly you didnt view the whole video if you suggest details were missing. The only details you provide are your own papers.
I am beginning to mistrust your integrity. And yes you were lecturing me.
No need to get shirty, there is a lot to absorb in your presentation and this is a discussion not a battle.
What I am saying is that warmer tropical oceans send the ICTZ northward and colder tropical oceans allow it to sink southward.
That seems to be supported by your comment that the ICTZ sank southward during the Little Ice Age and presumably moved norhward during the Mediaeval Warm Period. We seem to be agreed on that point.
I had previously assumed that warmer tropical oceans would have dominant El Ninos and colder tropical oceans would have dominant La Ninos.
Having considered your presentation and previous comments in similar vein from Ulric Lyons I come to the conclusion that such an assumption may be unnecessary.
It is possible to have El Nino dominance in tropical oceans that are overall cooler and La Nina dominance in tropical oceans that are overall warmer.
What really matters for the position of the ITCZ would be the average temperature of the tropical waters overall and not the presence of either El Nino or La Nina conditions specifically.
One would also need to consider any top down solar effect over the poles which counterbalances the bottom up effect of the tropical oceans.
The position of the ITCZ at any given moment reflects the interplay between both those forces.
I have noted, though that the late 20th century warming appears to have been accompanied by El Nino dominance and a northward shift in the ICTZ which does not seem to fit your hypothesis. Likewise the recent La Ninas seem to have put a stop to further northward movement of the ITCZ.
On that basis I prefer the broader proposition that the position of the ITCZ will be affected by the net state of all the ocean cycles in all the ocean basins at the time. That could accommodate occasional diversions from your hypothesis if the other ocean basins combine to offset the effect of the Pacific Warm Pool.
I think that Bob Weber’s comment about cause and effect might have some validity too.
Thank you, now you understanding the video better
Stephen writes, “It is possible to have El Nino dominance in tropical oceans that are overall cooler and La Nina dominance in tropical oceans that are overall warmer.
What really matters for the position of the ITCZ would be the average temperature of the tropical waters overall and not the presence of either El Nino or La Nina conditions specifically.
Jim, thanks for the mention of my work in the comment above.
Regards,
Bob
PS: I have not watched the video or read the transcript, so I have nothing to add.
I like your description of less cooling. It is like changing the composition of a heat sink or an insulator at various times. Sometimes with a given composition, heat is removed more quickly, and at other times not so quickly. Temperatures must change accordingly.
‘The function of the warm pool is analogous to a home’s hot water heater’.
Or better still:
https://www.newclimatemodel.com/the-hot-water-bottle-effect/
Stephen
I remember reading this article over 10 years ago and thinking that it made sense. After trying to find it on several occasions since it’s thanks to your link I have it bookmarked.
LOL, Stephen writes “‘The function of the warm pool is analogous to a home’s hot water heater’.
Or better still: ”
This is why I’m getting “shirty?” with you. You are not sincerely discussing this video, but pushing your own.
I read your hot water bottle article sometime ago and generally agreed. I saw, and still do see, that we share very similar skeptical understanding of climate change. But you got ego issues.
Your “hot water bottle” is not “better still” but it is just another example of you trying to one up other skeptics. I used the hot water heater analogy because it is more dynamic than a hot water bottle and I am trying to show how the warm pool supplies the global plumbing for heat distribution.
I think the analogies are pretty similar with the ‘bottle’ being the Pacific Warm Pool and the thermohaline circulation being the pipework.
We are all in the business of correcting the egregious errors of the radiative physicists and I often see what I consider to be a bit of healthy competition between hypotheses.
May I suggest that you lighten up a bit ?
I love newclimatemodel.com…better than the old site oldclimatemodel.net
I like the home hot water analogy.
My house has two natural gas fired 50 gallon water heaters, 40,000 BTU each I believe. Anyway, I can turn one off when my son goes back to college and we have enough hot water then.
I believe it’s due to carbon emissions.
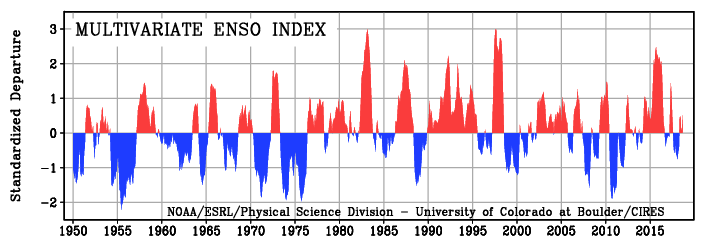
“The resulting El Niño events then drain the warm pool and cool the ocean’s sub-surface waters.”
According to data, it’s the other way around, ENSO leads the Pacific Warm Pool.
In contrast to the data the video presents from Dang 2020 comparing warn pool and surface temperature time series , you present a graph is not very clear what it is measuring. Walk us through the details of your graph please.
It is a graph of the cross-correlation between the ENSO Index MEIv2 and the Pacific Warm Pool, which lags MEIv2 by about 6 months.
This cross-correlation plot below of Niño4 leads Pacific Warm Pool indicates a higher statistical significance of r~.5 and also a lag of 6 months, clarifying that the warm pool recharges from El Niño events.
The same cause of El Niño event, the sun, also warms the rest of the ocean including the Warm Pool, so heat does move into the Pacific Warm Pool from elsewhere besides the ENSO region.
Sun-heated tropical waters seasonally effect the polar regions, as NH sea-ice extent is highly correlated to Niño3.
I didn’t read Dang 2020, did they do any cross-correlations with lags? The psl.noaa.gov analysis tools show the GMT (NASA GISS land+ocean) also leads the Pacific Warm Pool by about one month.
I am sorry Bob, but it is absolutely IMPOSSIBLE to have an EL Nino event and the simultaneous increasing volume/heating of warm pool water. Impossible!
Any statistic that claims otherwise is just statistical gibberish that reinforces Twain’s admonition: there are lies, damn lies and statistics!
Your statement “clarifying that the warm pool recharges from El Niño events” can only be correct if it reads “the warm pool recharges AFTER El Nino events”.
And again I think you are confusing short term correlations with long term correlations.
You may not have read Dang 2020, but from their graphic in the video and transcript, can you really not see how sea surface temperatures lagged Warm Pool temperatures???
You’re correct on that, Jim. Bob Weber obviously has little to no grasp of the processes that take place for El Nino events to occur.
Regards, Bob
PS: For Bob Weber, here’s a link to post I wrote a while ago that provides a reasonably simple explanation of those processes:
Does The Climate-Science Industry Purposely Ignore A Simple Aspect of Strong El Niño Events That Causes Long-Term Global Warming? | Bob Tisdale – Climate Observations (wordpress.com)
It was cross posted here at WUWT around the same date. It includes lots of links to even more-detailed discussions.
Neither of you got what I said; you’re both confused.
“…can you really not see how sea surface temperatures lagged Warm Pool temperatures???”
Jim, using paleo alone will get you into this kind of situation where you now have a bias against this obviously correct result from the more accurate modern data can give.
Dang 2020 lacks the temporal resolution to make valid cross-correlations on a monthly scale basis. You must admit the best we have is modern era data that indicate Niño4 significantly leads the Pacific Warm Pool and that it means the heat for the Pacific Warm Pool is controlled largely by Niño4.
Bob Tisdale you just are being rude, and you are showing me you have no grasp of what is forcing all these processes in the first place, which is the solar cycle influence on the tropical ocean.
After seven years of me talking about the solar cycle influence on the ocean here at WUWT this is still the best you can do, you can’t even politely talk to me and you can’t even consider that the changes in irradiance matter?
The solar maximum of SC24 caused the recent big El Niño:
Successive ENSO events drove SST growth:
If the two of you do what the IPCC does and flat-out reject the solar influence you’re no better than them.
A swing of 1W/sq.m in solar constant is significant for the globe.
The orbital changes over the last 400 years have increases June insolation over the NH by 0.6W/sq.m and that long-term trend is already visible in the observed temperature changes.
Well, if ocean heat content can be increased by a reduction in cloud cover it would be possible for the enhanced solar input to exceed the rate of venting during an El Nino event.
Could be. Does it? Do we know?
Maybe sometimes & sometimes not?
As another remarks, time to think more.
heh, today is the day to do what we’ve been doing, thinking.
Well I think so, any day in any way, thinking is getting better & better!
=========
This could be the beating heart of the great oceanic circulation, rippling the flows from the torque of global twirling.
Conjecturely, this variable cloudiness and Subsequent entry of energy into the ocean may(May as in May) both magnify and damp any solar effect.
I’ll dangle bait for our Mr Sun and say that of these things we may speak, though we know so little.
========
Bob Weber, when Jim is talking about the Pacific Warm Pool, he’s not simply talking about the surface. The Pacific Warm Pool extends to depths of about 300 feet.
Part of El Nino Basics:
It’s the massive volume of subsurface warm water from the Pacific Warm Pool being transported east by the Pacific Equatorial Undercurrent that fuels an El Nino, which takes place when that warm water rises to the surface.
Regards,
Bob
Thank you Bob, I know that. As part of my 2020 Sun-Climate Symposium poster that you probably never saw, I discussed the subsurface currents carrying heat and dissolved CO2 from the western tropical Pacific to the Americas:
Like you, I watched the sub-surface activity as it happened in 2015/16, and I saw the ENSO meet my solar predictions very precisely (see Fig. 10 above). I made an animation then of the subsurface kelvin waves moving eastward as the water was warmed by absorbed high solar irradiance from the solar cycle 24 maximum – I’ll have to find it. It’s the same as the ones you were showing back then.
You showed us what these things were; I keep up with them monthly:
Bob, Indeed the ENSO leads changes in the warm pool. An El Nino vents arm pool heat and the result is a cooler warm pool as I stated.
That should not be confused with the results from the Dang 2020 graph. The graph shows over the long term the warm Pool warmed first and then surface temperatures warmed. The dynamics that cause a hotter warm pool are a series of short term ENSO dynamics during which more more frequent La Nina-like conditions add more heat than less frequent El Ninos can drain
A question is as to why the Warm Pool warmed first.
My guess would be from more sunlight into the tropical oceans which Jim seems to agree with since he mentions a reduction in cloud cover.
What causes the reduction in cloud cover ?
Svensmark proposes decreased cloud nucleation from less cosmic rays when the sun is more active.
I proposed less wavy jet stream tracks from a contraction of the stratospheric polar vortex when the sun is more active which allows the ITCZ to shift northward AND the mid latitude jet stream tracks both move more poleward so that more solar energy gets into the Oceans either side of the ITCZ.
On that basis the increased temperature of the Pacific Warm Pool would be a consequence of solar variability when the sun is more active,
Whatever the cause the shift in the circulation patterns is the system working normally to neutralise radiative imbalances which is why Jim is correct to assert that climate variation has little to do with our CO2 emissions.
Each solar cycle peak adds enough energy to raise the eastern tropics by nearly 1C, the “step-up” everyone attributes to water sloshing back and forth, and conversely, there is a tropical step-down from each solar minimum.
The net SST gain or loss from each solar cycle operates according to my sun-climate threshold work, v2 SN of 95, for decadal-scale ocean warming, ie the solar cycle influence on the ocean.
You heard it here first from me as far back as 2014.
“. During the Little Ice Age, El Nino events were more frequent and reduced the warm pool.”
–
The temperature of the earth is almost entirely due to the amount of radiation reaching the earth each day.
This varies due to the solar output changes in intensity and the albedo changes due to clouds and surface changes.
–
El Niño and La Niña are no more than reflections of that change in power input.
El Niño is not a new heat generating source making more energy go into space and hence reducing the amount of energy and temperature the Earth has.
–
When the energy reaching the earth and working its way back out is lower we have La Niña conditions and cooler global temperatures.
–
Less clouds in the Pacific mean more energy in but more energy out.
The basal gobble temperature is determined by the amount of energy reaching and being radiated by the earth.
The actual surface global temperature is a measure of the radiation output of the atmosphere at a defined surface level ( say first 2 metres) where our instruments are.
–
Less heat in produces cooler conditions produce less clouds so allowing more energy to reach the surface than the hotter conditions.
This is a positive feed back on surface temperature .
Counteracting the negative effect of less sun power.
But feedbacks cannot naturally be greater than the causative effect (Lucia).
Hence the overall effect of a decrease in Sun energy in is a decline in Global Temperature.
–
Instead of pretending that El Niño and La Niña dictate trends we should reflect that they are the trends dictated by the energy input.
.
As has been recognized here and elsewhere, without brief intervals of heating preceding El Ninos, there is no global warming.
https://wattsupwiththat.com/2019/01/20/does-the-climate-science-industry-purposely-ignore-a-simple-aspect-of-strong-el-nino-events-that-causes-long-term-global-warming/
https://rclutz.com/2022/01/12/uah-confirms-global-warming-gone-end-of-2021/
It’s safe to say that El Ninos are not caused by CO2.
An increase in El Nino conditions during lower solar periods is correct. But I am not keen on your explanation for the last 50 years of global temperature change, regarding ENSO trends, and with no mention of the AMO which is also normally warmer during lower solar periods.
Three Super Los Ninos stand out, as does the Pause between the second and third and the Cooling since February 2016.
Jim
Thank you very much, great work!
I have watched all of your videos. You did an excellent job putting the pieces of the puzzle together. Your teaching skills speak for themselves.
Jim, in case you have not seen Erl Happ blogs, where he has multiple observational chapters and charts promoting pressure driven temperatures. Mainly southern hemisphere because he lives in western Australia like me.
https://reality348.wordpress.com/2021/10/26/new-book-the-movement-of-the-atmosphere/
Warm pools regulate to 30C annual maximum. They can briefly overshoot to 31C but the regulating temperature, where cloud formation regulates the energy balance, occurs at 30C. There is some limited dependency on surface pressure for the regulating temperature but it requires massive changes in atmospheric mass to alter the regulating temperature such as observed in the cretaceous period.
The area of warm pools regulating at 30C peaks in April each year covering 9% of the ocean surface and reaches a minimum of 4% of ocean surface in January.
http://www.bomwatch.com.au/wp-content/uploads/2021/08/Bomwatch-Willoughby-Main-article-FINAL.pdf
The June minimum in insolation over the northern land masses occurred 400 years ago – the last time perihelion occurred before the austral summer solstice. Boreal summers have been getting more sunlight since then. The increase so far is 0.6W/sq.m but it has only just begun. In 1,000 years it will be 2W/sq.m more than present. By 9,000 years it will be 21W/sq.m warmer before it starts to decline again.
The insolation over the northern land masses has a significant impact on the average global surface temperature. The temperature of land is highly responsive to the insolation it receives.
Orbital changes can be directly related to observed trends.
The flip side of higher boreal summer insolation is lower boreal winter insolation. That will increase winter precipitation in the northern hemisphere at the coldest time of the year; meaning an increasing amount of snowfall. Eventually it will accumulate. The current cycle of glaciation began 400 years ago.
Rick Will you are the first person I have come across in nearly 50 years as an active amateur astronomer (5 ‘a’s’ in a row, that’s berzerk!) that has mentioned the movement of perihelion and aphelion in such a way that is relevant!. It has always intrigued me as to what impact perihelion had on our austral summer (I live in New Zealand) compared to the boreal summer at ‘aphelion.’ I decided that the large land masses must come into play, compared to where I live at 40 south, which is mostly ocean. It has been on the latter basis that I give more credence to oceanic influences on our local climate. Along with my interest in astronomy, I have a deep interest in knowing when it is most likely to be ‘cloud free,’ short term & long term! 44 years ago I was introduced to the term “El Nino,” in relation to the severest drought recorded on the west coast of the Lower North Island of New Zealand, where I live, in the past 100 years. That austral spring/summer was a weak El Nino transitioning to “La Nada.” The end result was the driest 3 months on records which began in 1928. 31mm of rain in 3 months is very dry for any temperate areas on the planet. From that experience I was more physically attuned to similar conditions developing to the extent that I called the even longer “Great Drought” of 2002-03 as soon as the change began, and more than 2 months before the Govt. agency of NIWA finally called a drought for our region. Ten years later history repeated. the difference was by then I had the daily data and called the drought 3 months before the Govt. scientists! ENSO and the SAM are so totally dominant in our climate that I don’t see any room for a CO2 driven climate. It is interesting that some of the leading New Zealand climate scientists promoting Global Warming driven by increasing CO2, produced a paper explaining the increase of 58 New Zealand glaciers during the period of 1983 – 2008 back in 2017. Evidently NZ was undergoing a cooling period (strong El Nino events) while the rest of the world was experiencing CO2 warming! Apparently NZ was exempt, and the theory of CO2 influenced Global Warming is NOT global at all! As you Americans are apt to say, “Go figure!”
Just reading the text transcript referenced at the end of the head posting above, I find that it is hard for a novice like me to even follow what is meant or intended by the “ITCZ”, as the words denoted by the letters of this abbrevation are never even spelled out?
Fortunately I can do a Duckduckgo search and come up with a NASA page that defines this concept, this is at https://earthobservatory.nasa.gov/images/703/the-intertropical-convergence-zone
Now, starting from absolute scratch right there, I can always go back to the head posting and think some more, I suppose ..
Now that I’ve watched the video included in the head post, things are starting to make more sense for me. Quite a comprehensive video, too, with such details as, say, the essential effect of an ‘anti-prevailing winds’ counter current (for draining the oceanic warm pool in an El Nino cycle).
So, if this is starting to become a bit intuitive for me, it might be fair to say that in such a time as that (i.e., in an extended era of El Nino cycles), a drop in average global temperature is the result, since the draining of the Indo-Pacific warm pool effectively means that the Earth overall is radiating heat a bit more efficiently then? This is intuitive that is, or “counter” intuitive maybe, since it is the El Ninos that tend to push “warmer” water, and warmer air too, towards us here in North America?
At the same time, we are saying that we’ve had more of a prevalence of “La Nina” conditions in the last century and a half, with the result that the oceanic warm pool has increased, increasing the global temperature overall — such a huge warm “bathtub” we are all sitting beside?
The bathtub tumbles,
The water curlicues,
Magneto pulse and bumbles
In cosmic barbecues.
===============
Solar heated salt water
Runs around just like it oughter.
=============
The bathtub tumbles, never hits the ground,
In a precipitous precess,
Water spins it around.
Sneaking tendrils, against the wind,
It drains itself, and starts again.
Near perpetual motion
& highly efficient;
a self cooling engine
of thoughtless intent.
===========
Hold on. Weren’t we told there was no alternative explanation?
Nobody ever seems to account for undersea volcanic activity for ocean warming. Have watched same area approx. 600 miles NE of Hawaii for years generate plumes of clouds(volcanic steam) from the same area for a day or 2 at a time while weather systems blow right past it. Look @ur momisugly undersea maps & you will see lots of fissures & undersea volcanoes in that area. Same SW of Baja Mexico where hurricanes form, you will see several supersize undersea volcanoes.
Correction…600 miles NW of Hawaii.
Regarding the ‘Great Ocean Conveyor Belt’, does anybody know the speed of the currents in this belt?
A few centimeters per second. Its globe-circling route is long, taking about a millennium to complete:
https://oceanservice.noaa.gov/education/tutorial_currents/05conveyor2.html#:~:text=The%20conveyor%20belt%20moves%20at,along%20the%20global%20conveyor%20belt.
Thanks,
Interesting.
If I take 5 cm/s and assume a path length of 80000 km, then I calculate a round trip of about 50 years, which is roughly the order of magnitude of the AMO cycle length (65 – 70 years).
You’re welcome.
The whole trip is longer than that, and probably at a slower pace.
That whole long sentence after the word “by” is a very very weird way to spell “sunlight”
Blog sounds very interesting for the readers. You can also <a href=”https://elstel.org/SeaLevelRise.html”>sea level rise</a> from elstel.org