Guest Post by Willis Eschenbach
I got to messing about with the MODTRAN Infrared Light In The Atmosphere model. From the Help file.

Figure 1. Description of the MODTRAN model.
I was interested in the model because I wanted to see the difference between how much energy escapes from the surface to outer space at the equatorial regions versus the polar regions. So in my usual demented style, I wrote a program that downloads the results of a MODTRAN run so I can analyze them.
What I found was that in clear-sky conditions, subarctic summer, about 70% of the upwelling surface radiation makes it to space. And in clear-sky conditions, subarctic winter, about 81% makes it out. Finally, in the tropics, clear-sky, only about 65% of the upwelling surface radiation makes it to space.
This occurs for a couple of reasons. First, at cold temperatures, more of the energy is in frequencies less absorbed by CO2. And second, the poles are much drier than the tropics, and water is the major greenhouse gas.

Figure 2. Water content by latitude.
Having seen the MODTRAN results, I took a look to see how the MODTRAN numbers agree with the CERES data. Here’s the CERES view of how much of the clear-sky upwelling surface radiation makes it to space.

Figure 3. Global view, percentage of the upwelling radiation going to space. Clear skies only.
This shows the tropics as losing 63.7% of the upwelling longwave surface radiation to space. MODTRAN said 65% … close enough.
For the summer and winter subarctic, the subarctic is generally taken as the area from 50°-70° north latitude. To examine this, I took the summer and winter upwelling longwave percentages by latitude. Figure 4 shows that graph.

Figure 4. Percentage to space of CERES upwelling surface longwave (LW) by latitude and season, and MODTRAN summer and winter SubArctic LW percentage to space. Clear skies only.
Again there is excellent agreement between MODTRAN and CERES. And as you can see, there is a large difference in the amount of escaping LW in the tropics and towards the poles. Values are higher at the South Pole because the South Polar Plateau is quite elevated and extremely dry, and thus is above most of the greenhouse gases.
So why is all this important? That brings us back to the title of this post, “Advection”. As opposed to convection, which is a movement of energy in a vertical direction, advection is the horizontal movement of energy. In specific with the climate it is the energy which is carried horizontally by the physical movement of the ocean and/or the atmosphere. And it is a huge movement. Here’s where the energy is moving from and to—it’s going from the tropics to the poles.

Figure 5. CERES average advection. Positive areas are advecting energy to the negative areas.
And this is important because the energy is moving from the location where less of it escapes to space, to the locations where more of it escapes to space.
Next, I took a look at the change in the total amount of energy advected over time. Figure 6 shows that result.

Figure 6. Increase in the total flow of energy advected (petawatts). Seasonal variations removed.
So … how much extra energy escapes to space from this increase in advection from the equator to the polar regions? To calculate that, we take the increase in petawatts, multiply it by the average increase in longwave escape in the polar regions over the escape in the tropics, and divide it by the surface area of the earth … which gives a result of an increase in top-of-atmosphere upwelling longwave radiation of 0.6 watts per square meter (W/m2).
And how does this increase in escaping longwave compare to other energy flows? Well, any increase in CO2 causes a corresponding decrease in longwave escaping at the top of the atmosphere. How much of a decrease? Assuming that the IPCC is correct in its estimate that a doubling of CO2 reduces top-of-atmosphere longwave by 3.7 watts per square meter (W/m2), the change over the 2000-2021 period shown above is … wait for it … a decrease of 0.6 W/m2.
So over this period at least, the reduction of 0.6 W/m2 in top-of-atmosphere upwelling longwave due to CO2 is exactly counterbalanced by the increase of 0.6 W/m2 in top-of-atmosphere upwelling longwave due to increased advection.
Is this coincidental? It’s quite possible that it is. But if so, it’s an interesting coincidence …
And whether it is a coincidence or not, it goes to show that the standard CO2 theory of surface heating is oversimplified.
That theory says that if CO2 cuts down the amount of upwelling longwave headed out to space, the surface temperature perforce must increase to restore the top of atmosphere balance between incoming and outgoing radiation. Or to be more specific, the theory says that:
• The amount of atmospheric CO2 is increasing.
• This absorbs more upwelling longwave radiation, which leads to unbalanced radiation at the top of the atmosphere (TOA). This is the TOA balance between incoming sunlight (after some is reflected back to space) and outgoing longwave radiation from the surface and the atmosphere.
• In order to restore the balance so that incoming radiation equals outbound radiation, the surface perforce must, has to, is required to warm up until there’s enough additional upwelling longwave to restore the balance.
But this analysis shows that, as I discussed in my post “Unbalanced At The Top“, there are more ways to restore the balance than a surface temperature increase … and thus, the usual CO2 theory is falsified.
My best New Year wishes to all,
w.
PS—For those interested, the other ways of re-establishing the TOA balance include:
• Increased cloud or surface reflections can reduce the amount of incoming sunlight.
• Increased absorption of sunlight by the atmospheric aerosols and clouds can lead to greater upwelling longwave.
• Increases in the number or duration of thunderstorms move additional surface heat into the troposphere, moving it above some of the greenhouse gases, and leading to increased upwelling longwave.
• A change in the fraction of atmospheric radiation going upwards vs. downwards can lead to increased upwelling radiation.
MY USUAL—I choose my own words carefully, and I am happy to defend them. However, I cannot defend your interpretation of my words. So when you comment, please quote the exact words that you are discussing, so we can all be clear on your topic.
Quite so.
More goes out from colder unlit areas than from warmer sunlit areas. Contrary to the radiative hypothesis.
That is only possible because climate/weather/advection move energy from lit areas to unlit areas.
Which brings us to the work of myself and Philip Mulholland:
10.11648.j.ijaos.20200402.11 (2).pdf
The greenhouse effect is adequately explained by convective overturning of atmospheric mass.
Try this link instead:
Return to Earth: A New Mathematical Model of the Earth’s Climate :: Science Publishing Group
Puzzled by the downvotes when I have effectively agreed with Willis and simply gone one step further.
I have found myself wanting to see a separate space for upvotes and downvotes, rather than a sum total of them all in one number.
Stephen, How does your theory account for figure 1 above?
Figure 1 is a totally made-up thing. Why would you need to account for fantasy?
Oh no. The Willis fans are upset that I pointed out that figure 1 indicates that Earth is at 47 C.
If you have a problem with my statement then comment.
The text in Fig 1 is small, so easily missed. The black line is explicitly satellite MEASUREMENT over the Sahara.
It’s made up by defaulting all tropics to temperatures 7c higher than what the Sahara alone averages in the summer. Preposterous.
Got it now. Took a wild guess that it was the Sahara, now confirmed.
What is odd with a ground temperature of 47 C in the Sahara? Which is what the satellite measures in “the Window”. You will notice that the air temperature according to MODTRAN is somewhat lower.
Repeating-
It’s made up by defaulting all tropics to temperatures 7c higher than what the Sahara alone averages in the summer. Preposterous.
You didn’t notice the word “ground”? The ground is much hotter than the air in deserts, since the air convects. The highest air temperature ever recorded is 56 C, while ground temperatures over 70 C have been recorded. Check here and you will see that >45 C in Sahara is perfectly normal in summer:
https://earthobservatory.nasa.gov/global-maps/MOD_LSTD_M
Nothing unusual about that temp. in the Sahara.
Presumably, the dark line in figure 1 is measured. Not make up.
I assumed that.
MODTRAN is the standard model for atmospheric transmission It’s pretty well proven.
Indeed. And it wasn’t created for climatology, but rather for military use, for determining the range and penetration of IR seekers under differing conditions.
It seems to give ballpark numbers compared to direct measurement. I guess they made improvements with HITRANS.
There are other alternatives which are equally as proven .. search RTTOV
You need to be careful with “proven” because it usually comes with a set of conditions and you walk outside the conditions and you fall down a hole.
The only “real” experiments are being done by China and it’s quantum satellites no other country currently has the capability.
Instead of crying, do your own analysis and post it here. Let’s go, Brandon.
Convection adjusts to ensure that the dips in some outgoing wavelengths are offset by increases in other outgoing wavelengths so that the average total of outgoing radiation matches radiation coming in from space.
Stephen, exchange “convection” for “advection” and your theory sounds the same as Willis’.
But earlier you wrote, “The greenhouse effect is adequately explained by convective overturning of atmospheric mass.” Which implies (I thought anyway) that you were claiming the greenhouse effect doesn’t exist.
However, figure 1 shows that the radiative greenhouse effect has been observed and measured. Probably the black curve in figure 1 shows the effect over the Sahara because that is where it is hot and water vapor is low, so one can more clearly see portions of the spectrum where CO2 absorbs.
I don’t understand why the MOTRAN model was run for a “tropical setting plus 22 °C with 50% decrease RH.” Why run conditions that are not real?
Of course the earth must be in radiative balance. The CAW folks say it has to heat up to obtain a new balance, both you and Willis seem to be making similar points, that the radiation can leave via areas of the spectrum that are not blocked by greenhouse gasses, and the average tempeature will increase very little, if at all. That makes sense to me.
Note that advection and convection aren’t really two separate effects. The air that rises must come back down somewhere. As you notice Sahara has a radiative deficit, this is made up by air that has risen over the Equator and comes back down over the Sahara. It has lost much of its energy, but after compressive heating as it is sinking it is warm enough to heat Sahara:
 ?resize=842%2C688&ssl=1
Yes, that is the point.
Willis fails to complete the circle. Advection is just part of it.
What justification for: “the requirement for back radiation greenhouse gas heating is no longer necessary.” “Back radiation” is repeatedly observable. Your model would be much improved by acknowledging both upward and downward radiation as well as convection and and advection.
Since I NEVER claimed that advection is all of it, I fear you are once again flailing at a straw man …
w.
Convection causes advection. The Sahara is mostly warm because sunlight heats the ground, and the ground heats the air; through conduction.
Convection is ONE cause of advection. The La Nina pump is a huge driver of advection, as is the wind driving the Gulf Stream current.
w.
What lukewarmers and the climate cult refuse to acknowledge is that an increase in “greenhouse” gases increase atmospheric emissivity along with absorptivity. If you were to compare current satellite data with this 1972 satellite data in figure 1 you would not see an increase or decrease in upward IR under the same weather conditions.
Without “GHGs” the atmosphere would hardly emit any IR at all and the only way to cool the planet would be IR from the surface. Increase “GHGs” and you decrease cooling from the surface directly to space but offset it by radiative cooling within the atmosphere.
If IR active gases caused “trapping” of heat then they would be used in double paned windows, but it has been shown that their increased IR emission offsets their absorption for decades now. If you think otherwise, you might think about starting your own window manufacturing using some IR active gas such as SF6.
Agree!
This is the internet. You can register your dislike/like of someone or their idea without the need for comprehension. No comment necessary. Clicking like or dislike is the best that some people can do. I don’t ‘click’.
Same here. I’d remove the voting altogether.
“Figure 1 is a totally made-up thing. Why would you need to account for fantasy?”
As far as I can tell, you’re just bothering someone for asking a question, there.
“Oh no. The Willis fans are upset that I pointed out that figure 1 indicates that Earth is at 47 C.
If you have a problem with my statement then comment.”
As far as I can tell you’re just bothering people for finding your first comment less than helpful to rational discussion, there.
“You can register your dislike/like of someone or their idea without the need for comprehension.”
As far as I can tell the downvotes might indicate people are not comprehending your comments for good reason, snowflake ; )
Nooo his sentiment is correct. This site has a huge dogmatic & sycophantic problem. Downvotes occur not from the content of the comment but in reactive defense of the OP (Watts/Willis/et al).
First time on the internet?
I think many have missed the point of Figure 1. The measured vs predicted curves are simply trying to prove the value of the model. It clearly states that the model is based on clear sky conditions. Where else are you going to find such consistent clear sky conditions than over a desert? Neither the figure nor the article claim the tropic surface temperature is uniform at 47 deg C. The figure does what it is intended to do – illustrate the model does predict close to measured values in the stated atmospheric conditions to allow its use in further analysis.
“Downvotes occur not from the content of the comment but in reactive defense of the OP (Watts/Willis/et al).”
As your downvote shows. Lukewarmers rule.
I was bothered by the image and questioned it.
Bothering people and being bothered by people is part of the internet, that and cat pictures.
I don’t see myself as a snowflake. I’m not easy to offend.
There is a basic problem with your model .. work out how fast the energy has to move while chasing equilibrium 🙂
It’s also easily falsifiable because it would generate an effect which would be easily measurable and yet doesn’t exist.
So it’s a model with no real world relationship even if it gave the right answers.
And then there is also the difference between a “warm” polar ocean at ~freezing point and one covered with more ice at ~30Kelvin colder. That’s an awful lot of extra energy being radiated by E = σT4
My understanding of the “greenhouse effect” is that it causes the earth’s surface temperature to be warmer than it would be in the absence of any “greenhouse effect”. My further understanding is that this effect is completely due to gases in the earth’s atmosphere which are capable absorbing and re-radiating long wave radiation. If there were no greenhouse gases, then there is no “greenhouse effect”, and the temperature of the earth’s surface temperature would be different. Is my understanding incorrect?
Correct. However, once a steady-state temperature is reached, the further effects of GHGs are far from clear.
w.
I understand. Thanks.
It can be whatever you want. It is a fairy tale so make it how you like.
Earth’s energy balance is regulated by upper and lower temperature limits of the ocean surface. Both are precise in terms of temperature and are driven by processes dominated by the formation of ice – upper limit of 30C by ice cloud formation over tropical oceans and lower temperature limit of -2C by sea ice formation.
The concept of the GHE fails because it is based on a radiation balance that makes the sweeping assumption to disregard 30% of the incoming insolation in that energy equation. It is simplistic nonsense. So you can dream up your own idea and become an expert of it but it will not have any relationship to earth’s energy balance.
You’re taking an extreme position for no rational reason I detect, Rick.
The horrendous reality of lowered greenhouse effect on OLR is evident to anyone who’s been in a desert, from noon to midnight.
Greenhouse effect is also totally obvious and undeniable, to anyone like me, who now lives in the coastal wet-tropics zone, and routinely sees 29C, and 95% rh, at 8 PM through 1 or 2 AM, often with a low cloud layer (try sleeping with that for a summer’s night, or 90, and tell me there’s no greenhouse effect that matters).
You’re also not facing the fact that very large quantities of ultra-dry air can also occur over water, not just over the land, day and also night.
I showed you this image of 1% to 2% rh air (pink area) over the central Pacific, just last week. 34k ft % rh:
Here’s another two examples from midnight last night in the OBSERVATIONS. This is mostly overwater, but this time at 3,000 feet, and then again same area and time at 6,400 feet, near Mexico and Southern California.
3,000 ft % rh

6,400 ft % rh

Note that the brightest pinks are 0% rh levels at 6,400 ft (a total absence of H2O greenhouse effect and clouds due low to no moisture at that altitude range). And as you go higher it gets worse.
Obviously this will affect regional energy balances, via OLR increases, over water, day and night, and far more than a pathetically small CO2 change ever would, nor could.
It will also greatly increase local aridity over water, and also over adjacent land, as we discussed recently, which input of ultra-dry air also has a significant effect on greenhouse energy balances, due to moisture dilutions in the air column, overland, and also over the water.
Don’t over simplify with a principle. We get it.
Greenhouse effect of water in air does matter, over marine area, or over the land, and your unwarranted view here isn’t correct, and seems also irrelevant to your general arguments, I think.
We discussed this, and aridity, here, just last week, so why act like greenhouse will be irrelevant to the energy balance over water?
https://joannenova.com.au/2021/12/tuesday-open-thread-85/#comment-2503772
You are using a local weather observation to make assumptions about the global climate.
The global climate cannot be extrapolated from an observation at a local site. That is how current climate models work and why they are wrong.
There are two fundamental temparature limiting processes that regulate energy input to the earth system. They are ice formation in the atmosphere over the tropical oceans and sea ice formation at higher latitudes. The upper tsurface temperature limit is 30C and the lower temperature limit is -2C. Those two limit conditions can be observed every day on earth.
The idea of a GHE leads proponents down a slippery spiral where they lose sight of the big picture and the two key energy regulating processes.
The GHE theory immediately assumes away that surface temperature is unrelated to cloud formation. This is so naive it is way beyond incompetent.
Sorry, you are kidding yourself here Rick, the climate debate, such as it is, is total BS, as non-one knows how the climate system operates. Self evidently.
The GCMs are a failure.
Plus weather is not climate, as much as some mainstream sat-imagery affectionados and varve readers would like to imagine 30 years equates to significant change period in global ‘climate’.
Nope, the earth does not do climate change on that scale, it does weather noise on that scale. So all you understand is a view of the noise too. All the real planetary climate-change is logged by sediments and rock erosion discontinuities.
Geoclimatology was developed from an understanding of the planet’s climatic zone changeability, from such rocks, there’s no such thing as a 30-year climate-change resolution, outside of Holocene unconsolidated proxies.
So if you tell me that I lost sight of the global climate big-picture, I’m naturally going to tell you that you don’t even have one. But that’s the situation with most scientists, more than 97%, apparently.
The fact is we’re dealing with weather cycles, local, regional and global, and water, as the globe’s primary thermal store and GHG, is not ignorable, it’s an active primary atmospheric variable, on hourly, daily, yearly, decadal, century, millenia, glacial-cycle scales, and whole of iceage scale.
Variable.
A part of the mix of understanding weather-cycles, plus actual climate-change, down to large fractions of 1 millennia time scales.
I’m not clear why you think dismissing humidity’s role is a vital part of your argument when it plays a central role in what humans, animals and plants feel, and the conditions they experience, which either sustains or denies their ability to live and survive.
Which is the very reason we want to understand weather and climate. So I can’t accept an attempt to sideline water as a GHG in the way our earth works, and the life on it. Too absurd for me mate.
Can you not see how silly this statement is – water exists in the atmosphere as a gas, liquid and solid. The solid is the most significant in terms of limiting the upper temperature but you only want to consider the gas phase. You are already on that slippery slope to failure.
-2 to plus 30 is the concept that is so simplistic that it is way beyond incompetent…..
That is the temperature range of the surface of oceans. They a limited by powerful processes that regulate energy into and out of earthy’s system. The energy balance is temperature controlled. The energy balance follows the temperature. Temperature is not the result of the energy energy balance – temperature controls the energy balance.
So simplistic as to be useless…at least invoke Clausius-Clapeyron to be a few percent up to speed.
…disregard 30%…sounds like you dreamt up your own idea….
Now you do not believe that the GHE disregards all the reflected insolation – give me a break. That is its starting assumption – just neglect that.
If you read our paper you will see that the warmer surface temperature would arise in the absence of any radiative gases at all.
Just from the process of convective overturning.
The thing is that such overturning requires energy and so for as long as that energy is tied up in the process it is delayed from radiating out to space.
It is that delay which causes the surface temperature rise.
In the absence of greenhouse gases convective overturning would be much weaker since heat transfer from the ground to air would be limited to conduction, and gases are lousy conductors.
However ultimately a stable lapse rate would presumably be established since this is the most stable state.
However I doubt that there is any planet anywhere with an atmosphere without greenhouse gases. Perhaps some extremely cold planet with a helium atmosphere?
What do you think does the addition of Nitrogen, assuming it does not radiate, but it does, even if little, to the Earth atmosphere do?
Can we exclude Nitrogen as a greenhouse gas, when we know it is equally affected by the lapse rate?
Perhaps all your downvotes were because you posted the link as “file///C:/Users/Stephen/Downloads/10.11648.j.ijaos.20200402.11%20(2).pdf”
So over this period at least, the reduction of 0.6 W/m2 in top-of-atmosphere upwelling longwave due to CO2 is exactly counterbalanced by the increase of 0.6 W/m2 in top-of-atmosphere upwelling longwave due to increased advection.
Is this coincidental? It’s quite possible that it is. But if so, it’s an interesting coincidence …
OK I’m a bit of a stuck record but … emergent thermal homeostasis?
Emergent Climate Phenomena – Watts Up With That?
That would be my best bet, but hey, I was born yesterday.
w.
“…due to increased advection…”
but that means stronger hurricanes ‘n’ badder weather ‘n’ all…or (on picking up a calculator) the winds stay the same but last 3.6 minutes per day longer…
Well yes it cuts both ways, first there’s departure from equilibrium then return to equilibrium (see JCM’s comment below). More heat at the equator initially means bigger equator-to-pole thermal imbalance. So more advection. But the advection results in warmer poles, then a normalised equator-to-pole imbalance. So advection returns to normal. And remember that this meridional advection is not the only player in the climate system, just one of many.
(“Normalised imbalance” sounds like nonsense but it makes sense – sort of – in a complex chaotic never-at-equilibrium system like climate.)
It is actually very well established that the equator to pole thermal gradient was much smaller in the past in intervals with hothouse climate.
This was presumably due to larger advection and probably also due to the absence of ice/snow feedbacks during very warm intervals.
Also we must not forget the effect of oceanic heat transport. At the present time the North Atlantic is the only ocean with a strong poleward heat transport. In the pacific it is stopped by the Aleutian/Bering strait constriction, in the Indian Ocean by land and in the Southern Ocean by the circum-antarctic west wind/current system.
Before the rise of the Himalayas and the opening of the Drake Passage the oceans must have transported much more heat to high latitudes.
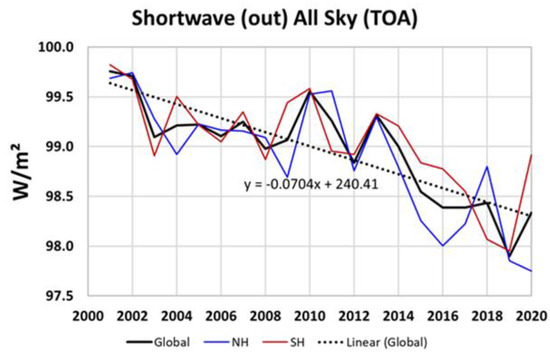
I don’t think the comparison is completely valid without accounting for the increased incoming energy that occurred over the exact same period of time.
“The declining TOA SW (out) is the major heating cause (+1.42 W/m2 from 2001 to 2020)” – Radiative Energy Flux Variation from 2001–2020, Hans-Rolf Dübal and Fritz Vahrenholt, October 2021, Atmosphere
I think Willis is on the right track here however the added incoming solar energy should somehow be factored in. It will lead to changes in the outgoing LWIR.
The .6 W/m2 IPCC value that Willis mentioned is based on a stable temperature. The temperature increase we saw over this period should also increase the outgoing LWIR.
Thank you – here we move closer to acknowledging thermodynamic equilibrium processes.
The focus in these threads is almost exclusively instantaneous radiative balances which happens to ignore a large portion of earth system process.
We now begin to understand the atmosphere operates under hydrostatic constraints.
Eschenbach reminds us of macroscopic heat (or energy transfer process) related to motion and thermodynamics of the atmosphere.
Back to fundamentals we should recall that kinetic energy is a function of specific heat and total internal energy.
It is this “internal energy” that is the bridge between radiation balance and thermodynamics necessary for climate study.
I do not believe that many here have understood the connection between (gravitational) potential energy, kinetic energy, specific heat, total internal energy, and radiative-convective equilibrium.
Many of us here have failed to appreciate the connection between mass or pressure, bulk motion of atmosphere, and flux densities.
Ultimately we should acknowledge that thermodynamics puts a permanent constraint on the IR radiation forcing in the atmosphere.
We can then argue about the specific mechanisms.
JCM
Couple things…
As the base atmospheric pressure changes the effective radiation tempature will change. No one ever discusses this. Not to mention there seems to be little discussion of how the nitrogen cycle affects the earths atmosphereic pressure over time.
If you look at Goody/Young from 61/89 copy rights on Atmos Radiation, it was know then that the radiative-convetice (6.5 K lapse rate) leads to Simpson Global Warming paradox. Only a radiative-convective-cumulus model provides reasonable answers, the subject of many W.E. observations.
So what am I in search of..
All things atmospheric pressure..
What happens to latent heat of condensation. (Tied into all things emmisivity..) Do not think it is correctly handled
When the oceans rise from the last glacial minimum level:
Increased area
Lower atmos pressure at sea level
More evaporation
If water basicly cools the planet, more cooling
Maybe this is the cause of the dominant thermal feedbacks
Add increased ocean circulation and heat transport to poles
Effectively the only free variables are TOA solar incoming and cloud condensation nuclei. This assumes a time period with unchanging global average pressure or mass and gravity. It also assumes a period with unlimited water supply where the triple point of water exists in the atmosphere
Due to the turbulent boundary layer, composed of any and all constituent gases, the heat transfer from surface to the atmosphere is dominated by convection, not by radiation. Generally convective heat transfer involves the combined processes of conduction (heat diffusion) and advection (heat transfer by bulk fluid flow). It is often overlooked that convection is the dominant form of heat transfer within the atmosphere. I believe this is not widely recognized but this thread gives me hope.
The phenomenon labelled as ‘greenhouse effect’ is a parameter determined by specific heat and is a fixed proportion of total internal energy. Its proportion will not vary until you pump enough gas to change the heat capacity of the atmosphere. Greenhouse enhancement does not concern radiative properties of gases.
The observed fluxes are constrained in order that the net solar flux conversion into OLR proceeds with the lowest surface temperature possible, i.e. with the highest entropy production. In this way we should see climate science as a thermal dissipation question.
The dissipative structure of the atmosphere is defined by the amount of sensible and latent heat transfer from the surface (by convection) to the TOA together with the IR radiation from the surface through the IR window. The dissipation process appears chaotic and we see it expressed every day as weather and global circulation. The nature of these dynamics is stochastic and cannot be simulated with deterministic GCMs (they can only be parameterized).
Converting latent heat or water vapor content by condensation into clouds & sensible heat requires cloud condensation nuclei [CCN]. For deep convection, the efficiency of this conversion (or condensation) is essential. When there are more CCN, the atmosphere becomes more opaque and the heat transfer mode in the lower atmosphere shifts into more convective mode. This effect brings a cooling of the surface. The upper atmosphere gets wetter and the cloud cover increases.
The cloudy sky moves to that equilibrium effective optical density whereby the net absorbed solar flux can be reradiated out into space with the minimum ‘greenhouse effect’ and minimum surface temperature (or maximum entropy production). An essential part of this process is dynamic atmospheric water vapor transport and heat transport horizontally from equator to poles.
Nature at work.
JCM
Plenty discuss non-radiative temperature levers. Pressure is key.
Try searching Erl Happ. He posts at https://reality348.WordPress.com/
Exactly, I refer to it as a corollary to Newton’s 3rd Law. For every action (radiation event) there is a reaction (by all energy transfer mechanisms). Whether it is “equal and opposite” has never been studied to my knowledge. It may very well be.
My own feeling is the energy may not be equal but is substantially reduced. The advection discussed in this article is just one of those other energy transfer mechanisms.
Falsifying Hypotheses is the old way of doing Science.
New Science involves getting more funding to support your hypotheses…then publicizing the overwhelming support.
Quit wasting your time with Boomer Science.
You beat me to it Larry. Closest I’ve seen to a falsifiable hypothesis and I think you meant Doomer not Boomer. In fact, I think Willis may be a Boomer, or close.
Brilliant Willis, even more exceptional than usual IMO.
I have this hypothesis, involving various subsets of our society being propagandized into believing that those not in the subset are “the problem”, so to speak. For some it’s a racial thing, for others a generational thing, and for some it’s a gender thing, or a religion thing, or a wealth thing, etc.
If my hypothesis is correct, there is a degree of intentionality involved, in the sense that what are potentially problematic interactions anyway, have been intentionally made more difficult, through various forms of propaganda, for at least a few decades. It involves a “collectivist” mindset being promulgated, Divide and conquer stuff, ya know?
It would have never occurred to me that this “New Science involves getting more funding to support your hypotheses…then publicizing the overwhelming support” was a “boomer generation” caused problem, in particular. Are you sure it’s not an upper-class white male agnostic caused problem? ; )
It is even worse.
New Science these days, in academia, consists and persist mostly in proving and solving hypotheses, theories and theorems via Falsification.
When and where the proper scientific method requires that the only thing to accommodate or achieve via Falsification has to be the disproving and dissolving of hypotheses theories or theorems that meet the condition of the falsification…whenever that arises.
New Science bizarrely a backwards perverse New Science.
cheers
Willis, I don’t doubt the advection heat energy transfer from tropical regions to more polar regions, but this must be a complex process. The most constant and strongest winds are latitude winds (I’m sure the Roaring 40’s, etc, are well known to you), so what a torturous route the this heat transfer must take. Not to mention the contrast between north and south hemisphere, more continental areas versus more oceanic areas.
Global wind patterns are not so much zonal in the lower and denser part of the atmosphere.
That is mostly a pattern seen in winds aloft.
Also, due to Coriolis, the zonal winds result from latitudinal flows turning to the right as they move across lines of latitude.
And surface winds: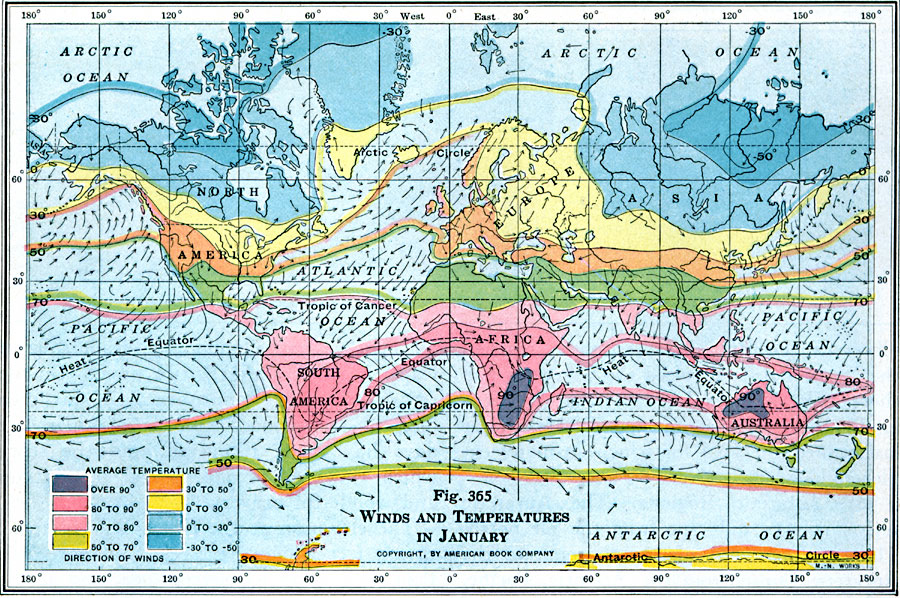
The fizzix of CO2 climate forcing, it’s just like this
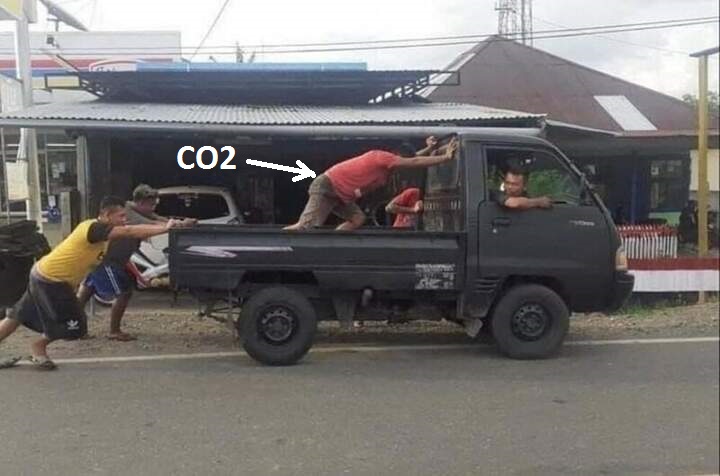
THAT is priceless!
The guy at the top either is either a wise one (which can’t be said for the two at the back) or a fool.
The guy at the top is Willis.
Red shirt CO2 guy is fulfilling Greta Thunberg‘s prophecy: he’ll make the climate collapse. (Fall into two or more pieces.)
Spot on dude.
Being cynical of our government scientists, I wonder if this analysis has been previously performed by any establishment entities only to have it stored away out of sight for obvious reasons?
Stratospheric Intrusions are when stratospheric air dynamically decends into the troposphere and may reach the surface, bringing with it high concentrations of ozone which may be harmful to some people. Stratospheric Intrusions are identified by very low tropopause heights, low heights of the 2 potential vorticity unit (PVU) surface, very low relative and specific humidity concentrations, and high concentrations of ozone. Stratospheric Intrusions commonly follow strong cold fronts and can extend across multiple states. In satellite imagery, Stratospheric Intrusions are identified by very low moisture levels in the water vapor channels (6.2, 6.5, and 6.9 micron).
http://tropic.ssec.wisc.edu/real-time/mtpw2/product.php?color_type=tpw_nrl_colors&prod=namer×pan=24hrs&anim=html5
30-day loop of analyzed 200-hPa heights and anomalies. An eleven-day mean, centered on the date indicated in the title, of 200-hPa heights and anomalies from the NCEP Climate Data Assimilation System (CDAS), is shown for the first 25 days of the animation. 10-, 9-, 8-, 7-, and 6-day running means are shown for the last 5 days, respectively. Contour interval for heights is 120 m, anomalies are indicated by shading. Anomalies are departures from the 1991-2020 daily base period means.
Cool graphics. But what’s your point? Or you supporting Mr E’s presentation, disagreeing, or just completely off topic? Elucidate, please!
In winter, the circulation in the upper troposphere is governed by the polar vortex, especially in the lower stratosphere. Stratospheric ozone falls with extremely dry air to the south, depending on pressure changes in the tropopause at high latitudes.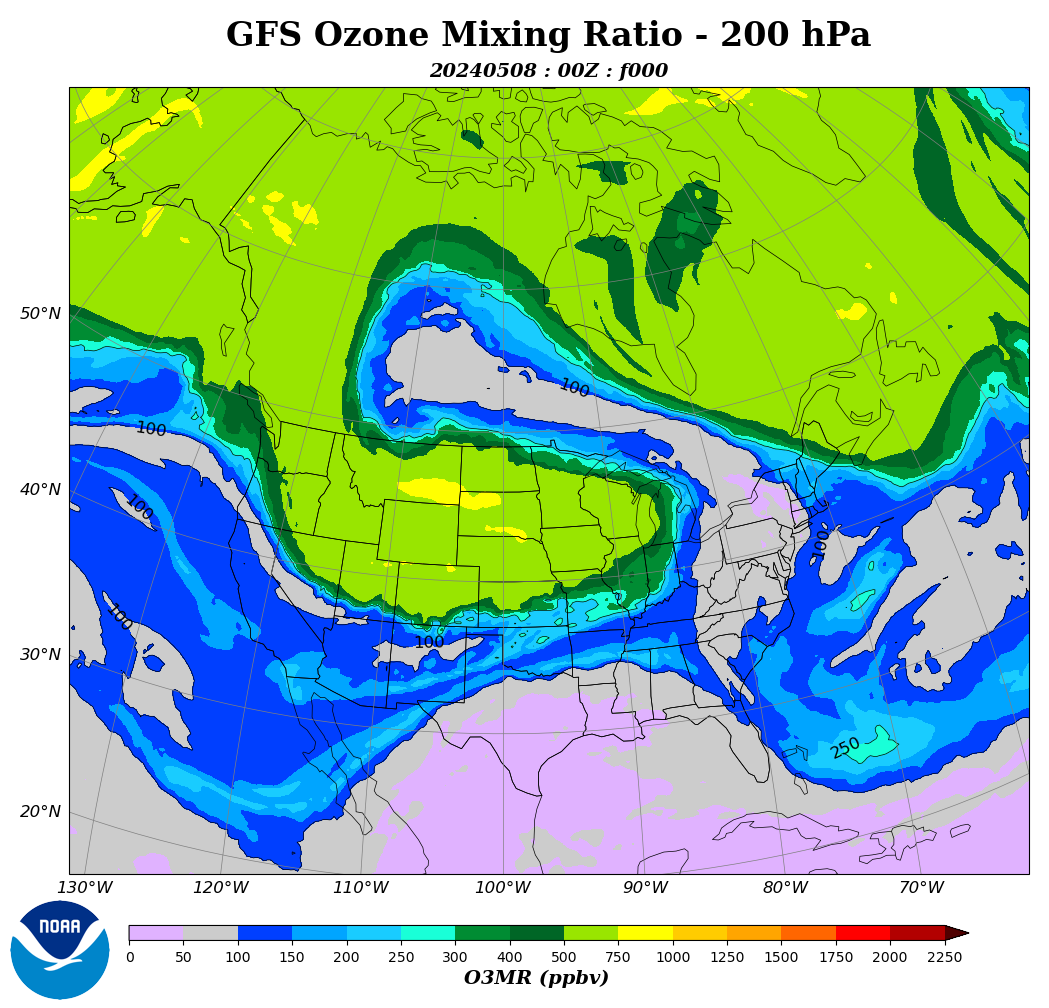
Thank you for highlighting this.
More importantly, you can trace the 0 to 1% rh air from in-falling stratosphere, all the way from variable tropopause altitude, to ocean surface or ground level, as I have done many times since about Dec 2019.
It is a very important factor, and so far an ignored factor, IMO.
And the quantity per unit time of stratosphere sinking into the troposphere, also is a variable quantity, that has been unknown and thus ignored, until now.
This must change. It is not just a surface to tropopause HIGH relative-humidity system, it is also a tropopause to surface LOW relative humidity system, as the stratosphere is donating ultra-dry air even down to ground level in the troposphere. In 2018 no one even thought that was a possibility, but by 2019 I could see and demonstrate that it was occurring within subtropical pressure systems. And also in strong association with the fastest and deepest Jetstream flows, in both hemispheres.
The polar vortex is profoundly stronger in southern hemisphere because no land mass to break it.
Thus pressure differences, ozone and NOx fights, are far more intrusive.
https://reality348.wordpress.com/2021/10/26/new-book-the-movement-of-the-atmosphere/
Do you have any idea as to what causes Stratospheric Intrusions to occur? A rather important question, if their incidence is related to Earth’s increasing temperatures.
(Your description of their effects is the same as that for High Pressure weather systems).
Your Figure 1 is usually the first graph that pops up on me when reading anything on the greenhouse effect. “Data from the NIMBUS3 IRIS instrumentation, 1972.” Why does everyone use the same data, 50 years old? Is it data from the equator, from the poles, from the day side, from the night side, or is it a composite graph from all of the above?
How very yesterday.
The big thing everyone forgets is that their no way to calculate from basics what the emissivity of h2o and co2 is in the atmosphere. There is a lot of work on the atmospheric radiation transfer function. I have seen nothing that leads me to believe the base emisivity numbers are any thing but crude estimates taken a long time ago from measurements.
Anyone who disagrees solve this problem from the basic thermodynamic and quantum chemistry principles?
A n2 base atmosphere at .75 bar
A sparse mixture of with co2 or h2o so that there is no significant self absorption
A temperature of 10c, better yet show a family of curves.
What is the total energy by photon emmision from a small non absorbing sphere described?
Energy per mole
Anyone, give me the base calculated answer and how, not a approximate estimated measurement.
I am not looking for a spectrum
Show me I am wrong….
Staley and Jurica circa 1970 have mostly been confirmed by later work….
so in a sense you are correct, “taken a long time ago”…but with thermopiles, same as today…and still used for measurements of emissivity from anything…
https://journals.ametsoc.org/view/journals/apme/9/3/1520-0450_1970_009_0365_fetfwv_2_0_co_2.xml?tab_body=pdf
and I’ll throw in this one, not quite what you asked, but this stuff really does get used:
https://www.researchgate.net/publication/240642891_Measurement_of_night_sky_emissivity_in_determining_radiant_cooling_from_cool_storage_roofs_and_roof_ponds
If you are correct, how do you explain the fact that the MODTRAN calculations agree so well with the CERES observational data?
w.
I found the calculation description for the NOAA OLR data base. Measurements fed into a simulation.
If you have found same for CERES, i would like to see. How much is measured, and how much is filled in by simulation?
In this world of adjustments and group think. I am looking to convince myself what the emmisivity numbers are and where they came from. Having a theoretical basis to justify difficult IR measurements can not hurt.
Debating the emission spectra for earth with regard the energy balance on earth has as much meaning as debating how many fairies can dance on a pin head. It is irrelevant.
The energy balance is controlled by temperature limiting processes. Upper limit of 30C for surface temperature of tropical oceans and lower limit of -2C under sea ice. The trace amount of CO2 in the atmosphere is not going to alter that. It will only have an impact when the CO2 mass contributes measurably to the surface pressure. Increasing pressure will increase the upper temperature limit.
See my comment to JCM earlier post
We agree more than you might think
So you agree that the GHE is a fairy tale and has not bearing on Earth’s energy balance or climate?
There is no equivocating here. You either believe in fairies or you don’t.
Bringing up concepts like ECS for CO2 is meaningless to a study of Earth’s climate.
As soon as I see people seriously considering any form of GHE in a study on Earth’s climate I know they have no idea.
RickWill:
How someone with (supposed) knowledge of basic thermodynamics and heat transfer can look at Figure 1 – especially the actual measurements – and still maintain the idea that the so-called “greenhouse effect” is a completed fiction is beyond me.
Many commenters here have never had the discipline in analysis of thermal systems that comes from even first-level courses in these subjects, but you claim to have this background.
How do you explain the (predicted and measured) dip in emissive power density in the 14-16 micron wavelength band without the radiative GHE?
Why would I care about explaining something unrelated to Earth’s energy balance in a discussion on Earth’s climate. These are trivia in the system that are negated by the powerful feedback inherent in the temperature regulating processes.
Anything that CO2 does in the atmosphere through its impact on the release of thermalised energy will be completely offset by the powerful ocean surface temperature limiting processs. A minute increase in cloud will offset anything that CO2 can do.
If you take the time to understand the powerful processes that limit ocean surface temperature then you will understand why the spectrum of thermal energy leaving the planet is irrelevant to the energy balance.
GHE theory simply assumes away the reflected component. Modellers even admit they have little idea how clouds work. That is where they fail. Clouds over tropical oceans form and persist to limit the surface temperature to 30C. The temperature limiting process has zero sensitivity to CO2.
No matter how much CO2 ends up in the atmosphere, it is not going to alter the 30C that open ocean surfaces are limited to.
Rick:
When the only method of heat transfer between the earth/atmosphere system and the rest of the universe is radiation, a big “bite” out of the radiative output spectrum caused by the presence of CO2 is “unrelated to the earth’s energy balance”? Seriously???
I agree that the climate system’s reaction to increased CO2 concentration is a very complex issue with many “moving parts” for which the climate models probably do not do a good job. But to jump from this to saying that there absolutely can be no sensitivity and to dismiss the whole idea of a radiative “greenhouse effect” is just ridiculous.
Even with open ocean temperatures apparently limited to 30C, the vast majority of the world’s oceans are well below that threshold, so your argument does not hold for most of the world.
It appears like a single snapshot at approx 37C deg. Has to be over land. Those are not the temperatures you get over 70% of the planet.
Correction: 47 C deg.
Yup, preposterous.
It says SAHARA in the upper right-hand corner of fig.1 – if you aren’t familiar with that term look it up on any old world map. Or in Wikipedia.
Thanks. I’ll look it up.
How did write that entire post without specifically mentioning the arctic surface has warmed up during that period? Surface warming is literally what he’s seeking to show isn’t necessary and he…used the warming polar region to show that fact?
I didn’t say that the surface isn’t warming. I said that the change due to CO2 is offset by the change due to advection.
Yes, that leads to the poles warming more than if there were no advection … but it also leads to the tropics cooling more than if there were no advection.
That’s the nature of advection, heat moves from one place to the other.
w.
And the heat moves from a place where it is difficult for it to escape to space, to a place where it is easier for it to escape to space. It’s a very interesting finding Willis!
Willis, as I mentioned above you missed the increase in solar energy over this period which would affect the 3.7 W/m2 computation. IIRC, that is based on a fixed albedo. The albedo has decreased by about 1.5%.
Richard, I was looking at one part of a large puzzle. I didn’t “miss” the increase in TOA solar. Along with thunderstorms, atmospheric absorption of solar energy, changes in losses of sensible and latent heat, and variations in up/downwelling radiation from the atmosphere, I did not discuss them because they were not the subject of the post.
I cannot discuss everything in one single post—the system is far too complex for that.
w.
Keep in mind it takes a whole lot less energy to warm dry polar air at 250K one degree K than humid tropical air at 300K one degree K. A whole lot less. Your cute little temperature graph is misleading.
Rbabcock: Yes, because temperature is not a measurement of atmospheric heat content. Enthalpy is; BTU/lb of dry air and associated water vapor.
What is the vertical scale exaggeration used?
Anything you would like it to be.
A ‘sigla’ for a very badly peeled watermelon.
🙂
Actually this “polar reinforcement” is exactly what is expected from increased advection which would flatten the equator/pole thermal gradient.
It hasn’t happened in Antarctica because the circum-antarctic wind and current system pretty effectively blocks advection.
“Surface warming is literally what he’s seeking to show isn’t necessary and he…used the warming polar region to show that fact?”
What Willis is demonstrating is a feedback.
The common warmist belief is that CO2 slows the rate of cooling but this effect speeds it up.
The common warmist belief is that water vapour multiplies the warming effect and brushes over any negative feedbacks.
The common warmist belief is that warming due to CO2 radiative theory sets a minimum for the warming and they are so sure negative feedbacks over any time scale could not reduce it below that minimum. That is belief and not science.
WE, I do not think the correspondence you found is a coincidence. Discussed this with Lindzen in his office shortly before he retired. You have just quantified my qualitative understanding from him.
There is a thing called polar amplification. Because the tropics have more humidity, they heat more from GHG. This increases the thermal gradient from equator to poles, which drives an increase in advection. Relatively, the poles advectively heat more and hence can ultimately radiatively cool more since cold and dry.
Of course, this is not a smooth continuous process. It functions via the Hadley cell from equator to mid latitudes, the Ferrell cell from mid to northerly latitudes, and then the polar cell from northerly latitudes to the pole. Ditto for Southern Hemisphere but less well defined because of Antarctica.
Circulation in the stratosphere
http://ds.data.jma.go.jp/tcc/tcc/products/clisys/STRAT/gif/zu_nh.gif
http://ds.data.jma.go.jp/tcc/tcc/products/clisys/STRAT/gif/zu_sh.gif
Hadley and Ferrell ? Old school stuff…. Heat is transported by the Coriolis effect on very large rising and falling air parcels thousands of km across…have a look, identify coriolis effect, then use your imagination to “see” those Ferrell cells, Today’s view….
https://epic.gsfc.nasa.gov/
A lot of heat is also moved north from to equatorial Atlantic the Labrador and Norwegian Seas, thence onward to the Arctic Ocean, by the Gulf Stream and by hurricane storm tracks. Same in the Pacific, but the path is longer and access to the Arctic Ocean, via the Bearing Straight, is much smaller.
Don’t forget the oceans – they transport heat poleward also.
Looks to me that the upwelling radiation from surface to space is controlled by water vapor, highest with dry air, lowest with moist air.
Also seems to me that the dominant effect of increasing CO2 is raising the effective surface for the TOA radiation in the CO2 absorption wavelengths – which would account for the 2C warming that Happer found with HITRAN modeling of cloudless skies.
Provided there is no La Niña.
Advection is not an instantaneous process, it take some time, probably a quite sensible amount of time, to move heat energy from the tropics to the poles.
At least in the temperate zones (where my experience comes from) temperatures are, in large part, a matter of weather. Daytime is generally hotter under a clear sky in still air (energy coming directly from the sun) but moving air often has a very noticeable effect on temperature.
If advection of heat energy from tropics to poles has increased, then the heat energy flowing through the temperate zones has to have increased. This would seem to account for some temperature increases in the temperate zones as the heat moves through, no?
I understand that flow is not simply parallel to the surface. It ascends to higher altitudes due to convection as it flows from equator pole ward, but then descends again long before reaching the poles. It then repeats this basic 3 dimensional motion as it continues the journey.
There are two temperate zones globally. The peak heat uptake has been moving progressively north for 400 years and will continue to do that for 10,000 years. The peak has been declining as well.
There should be a difference in trends between the hemispheres but that is something I have not verified.
It would be interesting to know how your figure 6 compares to a similar graph produced from GCM data.
Excellent work.
Willis,
You say “this is important because the energy is moving from the location where less of it escapes to space to the locations where more of it escapes to space”.
This is by percentage, according to the graphs. Is it also true of the absolute amount of energy radiated to space by location? I would have thought that the amount radiated into space in the tropics would exceed the amount radiated at the poles, even though a higher percentage of surface radiation makes it through the thinner atmosphere above Antarctica, because the higher surface temps. Maybe the tropics aren’t hot enough to make up for the thinner atmosphere above Antarctica? Surprising not to see a higher percentage radiated above the Sahara.
“This occurs for a couple of reasons. First, at cold temperatures, more of the energy is in frequencies less absorbed by CO2. And second, the poles are much drier than the tropics, and water is the major greenhouse gas.”
I wonder, is the atmosphere and especially the troposphere being thicker at the tropics than at the poles also partly the reason?
In five days, stratospheric intrusion will freeze the eastern US.
More big rains and snow coming for many of the areas that have been getting it already. ?1641159335
In the mountains, one inch of precip is about 10″ of snow or more:
A few months back there were people saying a dry water year in California was all but assured.
I pointed out then that la nina conditions have had very wet and very dry years out there.
Your analysis neglected to provide a reason for the increase in advection over time. The core reason for the movement is due to temperature differences. What caused the change in temperature(s) on the planet to account for Figure 6?
Look at Figure 6. From December 2011 to February 2012, a total of 2 months, the amount advected went from 18.9 PW to 20.4 PW, a difference of ~ six times the trend change over the period.
When you can explain what caused that change, get back to us and we can discuss your question. Because obviously … there’s more at play than simple temperature differences.
w.
Natural variation.
.
Now your turn to explain the trend line for 3/2000 thru 2/2021
Here is an example of “natural variation”
https://www.woodfortrees.org/plot/uah6/from:2000/to:2021/plot/uah6/from:2000/to:2021/trend
Yes you are correct, that example too represents a natural variation, a little biased though due to man’s hand influence there, but still natural never the less.
Here’s another view of that same natural variation with the PDO switch removed.
https://woodfortrees.org/plot/uah6/from:1997/to/plot/uah6/from:1997/to:2014/trend/plot/uah6/from:2015/to/trend
“Natural variation.”
Yes but not “Natural Variation within the forcing of CO2” because its the same natural variation that produced a habitable Greenland. A little ice age. Trees well north of the Northern Tree line….any number of historic climatic conditions.
The trend line appears to be due to the PDO change in 2014. That also appears to account for a significant reduction in clouds which allow more solar energy to provide warming.
I agree that Willis needs to account for the increase in solar energy over this time frame.
Earth weather is in the domain of the open system thermodynamics; I did (and that was long time ago) only one physics trimester of thermodynamics with lot of other stuff thrown in.
In this case it involves both matter movement and kinetic, potential, and thermal energy conversions.
Initial energy from the sun heats huge areas of different thermal capacity (land and oceans), moving large air masses in form of wind, lifting huge volumes of water (in form of vapour) to great heights, absorption and release of energy by evaporation and condensation, loss of energy to space, etc.
I’m not sure that there is a clear cut way of the all the above (and other) variables could be easily incorporated, so good luck to anyone having a go at it.
Check out Ilya Prigogine and his nonlinear thermodynamics, dissipative structures etc.
On a global scale with regard energy balance, the thermodynamics is relatively simple.
There are two temperature limiting processes that set the upper and lower limit of ocean surface temperature to a range of -2C to 30C. The climate is dominated by orbital mechanics and the distribution of land surface relative to water.
The temperature limiting processes are powerful and precise. The upper limit of 30C has a slight dependence on surface pressure, which relates to atmospheric mass but the mass of CO2 contributes unmeasurably to the surface pressure so does not impact on the energy balance.
The thermodynamic process that controls the upper limit is explained in the linked paper:
http://www.bomwatch.com.au/wp-content/uploads/2021/08/Bomwatch-Willoughby-Main-article-FINAL.pdf
The ultimate controlling factor after the pressure of atmospheric mass bearing down on the surface is the energy cost involved in the phase change from liquid to gas.
That energy cost is variable with pressure because the weight of the atmosphere affects the amount of energy required to effect the phase change.
The heavier the atmosphere the more energy is required for the phase change and the higher the ocean temperature will rise.
That is why the complete removal of an atmosphere would result in evaporation of all water on the planet. It might freeze first but would then sublimate to a gas.
No downward pressure, no constraint on evaporation.
Excellent investigation, Willis.
It just goes to show that mono-dimensional alarmista thinking is not suited to 3D processes. Water always finds its own level, energy balance likewise.
I agree but I wish to add a discussion point. My own physics degree is 50 years rusty, but I can see that no proper scientific treatment of radiative transfer could be realistically attempted prior to the mid to late 20th century, needing as it does detailed knowledge of spectral energy bands and knowledge of concentration distribution in 3 D of the various greenhouse gases.
Given the exceptional talents of the rather small number of various physicists who are competent to contribute to the field, all the physics and proper cut and thrust of academic hypothesis testing ,duplication or non -replication of others findings etc should have taken place within the learned fora that these rather arcane scientists inhabit- as for instance would happen in various fields of physics and astronomy, and we would not be allowing politicians and those with axes to grind to dominate the discussion with their shrill chatter.
This happened to Quantum Mechanics in the Solveig and Copenhagen conferences for instance back in the twenties without too much blood on the floor. where those who could, contributed and those who could not just shut up.
Can those of you out there with a degree of erudite wisdom , Essenbachs, Shavivs Svensmarks Lindzens, Koonins, Happers, Curries Spencers and Christies possibly Trenberths or to stretch a BIG BIG point Manns Schmidts and Phil Joneses = whoever represents a calm point of view on the alarmist side not get together with your own journal and start treating each other as adult scientists with a very serious global problem (or not) on your hands and do some decent physics in the proper Popperian manner
Eventually you will conclude, correctly, that ECS is zero and the GHE is contrived nonsense.
Solid water on the ocean surface and the atmosphere regulate earths energy balance in conformance with precise upper and lower limits on temperature. Trace gasses in the atmosphere can have no direct influenceuence on the radiation balance.
Water in the atmosphere has a residence time of a week. It varies by 25% over a year. It is a net cooling agent in the atmosphere. The notion of “greenhouse gases” is fundamentally wrong because solid water in the atmosphere literally dominates the energy intake. Sea ice is significant in the energy release. Earth’s is in that happy place where water dominates the surface conditions and controls the energy balance.
RickWill January 2, 2022 2:51 pm
Rather than zero, I would say that the ECS is not a meaningful measure in a system regulated by emergent phenomena. See my post “The Details Are In The Devil” for an explanation why.
However, the very poorly-named “greenhouse effect” (GHE) is indeed real. See my posts “The Steel Greenhouse” and “People Living In Glass Planets” for an in-depth explanation.
w.
I don’t think the two views are really at odds. I think the ECS is more of an immediate measure of the forcing and feedback while your emergent feedback is generally longer term and related to any change in temperature.
I think Rick is close to the truth in that immediate ECS is darn close to zero. That doesn’t mean there are not emergent feedback processes to any kind of warming.
The temperature regulating processes are all that matter with regard Earth’s energy balance. Tropical oceans limit to 30C by regulating the surface insolation and polar oceans limit to -2C by formation of sea ice that reduces energy release to a fraction of what it is from an open surface at -2C.
Neither of these processes depend on or are altered by the presence of CO2 at trace levels. Hence CO2 plays no role in the energy balance.
The emergent phenomena are temperature regulating processes. Open ocean temperature is limited to 30C and is the result of convective instability. Explained in this paper:
http://www.bomwatch.com.au/wp-content/uploads/2021/08/Bomwatch-Willoughby-Main-article-FINAL.pdf
This process is incredibly powerful – as far as feedback systems go it has very high gain and regulates to precise surface temperature with little more than 1C overshoot in the initial response. This process has no sensitivity to CO2. If there was enough CO2 to make a measurable difference to the surface pressure then there would be some slight sensitivity. Convective clouds can turn day into night so they have incredible power with regard the energy balance. The important of convective potential to climate is gradually being recognised but not understood in the detail I have provided in the paper linked above. This link shows the presence of CAPE across the globe:
https://earth.nullschool.net/#current/wind/surface/level/overlay=cape/orthographic=-243.15,-14.61,420/loc=128.633,-13.222
The energy release control process that regulates the lower limit to -2C is just as powerful but not as immediate. It takes time for sea ice to form but it becomes an effective insulator at only metres thick. Look at the temperature difference across a thin layer of sea ice and then recognise what it has done to the surface emissivity. How does the GHE cater for that easily identified and evaluated temperature control and energy regulating process.
Nice Work Wilis,
This has been Ocular’s point as well in his post from 2017 where he reviews the Congo versus Sahara
https://okulaer.com/2017/04/15/the-congo-vs-sahara-sahel-once-more/
Basically the greenhouse has windows in the roof
I wonder if MODTRAN agrees with reality because it was trained / parameterized against reality. I have heard that some climate models have hundreds maybe thousands of parameters to fiddle with.
MODTRAN only measures radiation changes. The problem is when pseudo scientists do not put that in the context of the entire atmosphere and all the other energy transfer mechanisms such as advection as Willis mentions here. They then parameterize the radiation effect without understanding the big picture.
Willis,
Very good! You are completing the circle.
In this article you state:
<So over this period at least, the reduction of 0.6 W/m2 in top-of-atmosphere upwelling longwave due to CO2 is exactly counterbalanced by the increase of 0.6 W/m2 in top-of-atmosphere upwelling longwave due to increased advection.>
In your article from June 14, 2019 – A Second Look at Radiation vs Temperature you state:
<After thinking about that, I realized I’d left one factor out of the calculations above. What the El Nino phenomenon does is to periodically pump billions of cubic meters of the warmest Pacific equatorial water towards the poles>.
In your article from 2021-04-09 ‘Adding it Up’, you showed that all of the major oceanic cycles, such as AMO, PDO, are correlated with ENSO.
From these three articles I would conclude that Advection from ENSO is one of the primary drivers of Global Atmospheric Temperatures.
I have also seen nothing in the literature that shows the ENSO is a function of CO2.