Guest Post by Willis Eschenbach
For some years now I’ve been saying that the largest warming is occurring in the northern extratropics, at night, in the winter … and today I realized that I’d always just taken that on faith because I read it somewhere.
Now, folks who know me are aware that I don’t like to trust any claim until I’ve run the numbers myself. So I set out to do that.
I figured I’d look at fairly recent land data since we have much more of that than older data or ocean data. Overall, here are the decadal trends in the maximum temperatures. I’ve used Berkeley Earth data, although I strongly suspect it exaggerates the warming, for a couple of reasons. First, all the records seem to exaggerate the warming, and second, I’m interested in relative trends, not absolute trends.

Figure 1. Maximum monthly average temperature trends, 1950-2020
We can see that the greatest change in maximum temperature is in the northern hemisphere (0.23°C/decade), with the arctic warming the fastest.
Next, here are the trends in the monthly average minimum temperatures. These, of course, are night-time temperatures.

Figure 2. Minimum temperature trends, 1950-2020
Again, the minimum temperatures in the northern hemisphere are indeed warming fastest. They are also warming faster than the maximum temperatures (0.25°C/decade vs. 0.23°C/decade). It’s also worth noting that there are actually a few areas where nighttime temperatures have cooled …
Finally, I took a look at the summer and winter trends by latitude. Figure 3 below shows that result.

Figure 3. Maximum and minimum surface temperature trends by latitude, northern hemisphere (NH) winter and summer.
Turns out that my claim was right. The largest warming is indeed in the northern extratropics, in the winter, at night (dark blue line). Second largest warming is same location, same season, during the day. As you can see, the winter warming is increasing as you go north of about 45°N latitude.
And what are the average daytime and nighttime NH winter temperatures? Figure 4 shows that result.

Figure 4. Northern hemisphere winter daytime (red) and nighttime average temperatures, by latitude
Note that at about 45°N latitude (thin blue vertical line), approximately where the increased warming starts, the daytime temperature averages just below freezing, and the nighttime temperature average is -13°C (9°F) … cold.
This is good news, because I doubt if the people in Vladivostok are going to be unhappy with slightly warmer winter nights … or days, for that matter
And having slept a few times in my youth on a piece of cardboard on the streets of Manhattan in wintertime, with newspapers wrapped around my legs and arms inside my clothing to help keep out the cold, I can personally guarantee that the homeless in New York City won’t object if the winter nights are a bit warmer.
Makes me glad I’m in my nice warm fossil-fuel-heated house tonight …
Best of the late autumn to all,
w.
Willis Eschenbach
Thanks for this guest contribution, which however wonders me a bit.
You speak about moving from absolute to relative trends, whatever you understand under ‘absolute’ trends: for me they are simply (linear) trends.
*
But if I understand your Figure 4, you moved in fact from (absolute) trends to absolute temperatures instead.
It is the same as if I would, starting from UAH’s 9,504 cell grid data, compute the latitudinal averages for the anomalies
and then do the same job for the absolute data we can obtain by combining the grid anomalies with their current climatology wrt 1991-2020.
I’ll modify some objects and methods to obtain such an ‘absolute grid’, and would not much wonder if its graphical representation looks similar to your Fig. 4.
Conversely, it would be interesting to generate anomaly-based latitudinal averages of a 2.5 degree grid containing the worldwide station data, and to compare them with UAH’s.
*
Last not least, here is the latitudinal averaging of all 9,504 UAH grid cell trends
which looks strangely similar to the latitudinal average of the UAH anomaly values.
Rgds
B.
This clear article shows how a climate trend of unknown cause, which is highly beneficial to all living organisms on Earth, can be turned, by Media concentration and political influence, into a catastrophe of major proportions requiring the expenditure of vast capital resources.
May the water vapor in the Arctic keep the temperature up in winter. More water vapor equals more heating.
Interesting as always.
Are Berkely Earth figures now considered reliable? After the calculations behind each figure are Berkely Earth figures even considered data?
“And having slept a few times in my youth on a piece of cardboard on the streets of Manhattan in wintertime, with newspapers wrapped around my legs and arms inside my clothing to help keep out the cold ……..”
Yes, Willis, but unfortunately that was before back radiation was invented.
Isn’t science wonderful?
I fear you misunderstand the physics involved.
I would have been MUCH colder if I were exposed to the 3 W/m2 back radiation of outer space instead of the ~340 W/m2 back radiation from the atmosphere.
And having spent many cold nights outdoors commercial fishing in the Bering Sea, I can also personally testify that downwelling thermal radiation (aka “back radiation”) is also the reason that when a cloud comes over on a clear winter night, you can feel the immediate increase in warmth.
Let me suggest that you take Maurice Switzer’s excellent advice, viz:
Regards,
w.
Was the cloud the cause or the result of the warmth?
The cause. You can tell because you can watch the cloud approaching. When it comes over you can feel the warmth. When it has passed you feel cold again.
w.
Sorry for this, couldn’t resist:
Joni Mitchell – Both Sides, Now [Original Studio Version, 1969] – YouTube
On a cool, cloudless night anywhere, just walk under a tree. Of course, there are those posting here that deny the GH effect.
“Of course, there are those posting here that deny the GH effect.”
And there are those posting here that do not have a sliver of evidence that the GH effect is a real forcing.
That includes you, Dave Unfair.
Feldman et al (2015) had a go at it. Since then – nothing.
https://www.mdpi.com/2673-9321/1/2/14/htm
Thank you for your fact-less opinion, leitmotif.
I’ll stick with real science like the latest from Wijngaarden and Happer. Unlike you, they are real atmospheric physicists. Argue with them.
Dave,
Real science?
From HITRAN –
“It must be emphasized that the parameters that exist in HITRAN are a mixture of calculated and experimental.”
Can you identify which parts of HITRAN are based on reality, and which parts are wishful thinking? Wijngaarden and Happer just merrily ignore the fact that an unknown amount of HITRAN data is guesswork.
Notwithstanding the possible HITRAN deficiencies, the paper to which you refer is nonsense. Read the first sentence of the abstract, and be prepared to defend it – if you have the courage of your convictions.
Or just turn to water, and run away.
Like I said, argue with Wijngaarden and Happer. Comment on their paper; refute it as non-science. Get your Nobel Prize in Physics.
Again, another paper about CO2 not having much of an effect. Truth will win out.
https://www.mdpi.com/2673-9321/1/2/14/htm
Again, walk under a tree on a cool and cloudless night. Report on that grand experiment.
Willis,
Your observation is correct – although, of course, your temperature does not rise. Your perception of “warmth” changes.
However, your “back radiation” explanation is completely erroneous.
You cannot raise the temperature of something by getting it to absorb the radiation emitted by something colder.
Try raising the temperature of liquid water at any temperature by exposing it to the radiation from ice at any temperature. In reality, of course, not in your GHE fantasies.
Or maybe make molten lead hotter with boilingliquid water?
Are you still claiming the ground temperature increases when exposed to the radiation from colder clouds?
Not terribly astute or scientific. Semantic games do not change physical fact.
Your observation is correct – although, of course, your temperature does not rise. Your perception of “warmth” changes.
Just to be clear: You are saying that the ambient air temperature does not change, only the feeling of warmth? Does that apply to the tree as well or only the cloud?
Seems easy enough to verify if your hypothesis is correct.
Willis,
Maybe you could take your own advice.
You definitely misunderstand the physics involved. Terms such as “downwelling thermal radiation”, and “back radiation”, are just nonsense jargon promulgated by climate crackpots and their gullible followers, trying to sound important.
I assume you are at least bright enough to realise that the temperature of a cloud above the freezing level is below freezing. If you think that the radiation from ice will warm you up, you are living in a fantasy.
Read a little about the physics of clouds, and the interaction between clouds and radiation, and you will find that your “reason” for your observed “warmth” is complete bollocks. The real reason is obvious to anyone with a knowledge of basic physics.
Others are free to make their own determinations, hopefully based on physics, rather than climate crackpot delusional thinking.
Blankets keep you “warmer” without being “hotter” than you – no fantasy “climatological physics” involved. Think about it, if you want.
Swenson, let me recommend my posts entitled “The Steel Greenhouse” and “People Living In Glass Planets“. They explain how the greenhouse effect works.
As to downwelling thermal radiation being “nonsense jargon”, it is regularly measured, not estimated but measured, by both scientists and automated instruments all over the planet. For example, the SURFRAD stations, as the name implies, measure a variety of types of radiation at the surface. From their website:
To ensure the accuracy of the measurements, the pyrgeometers are regularly calibrated. From the same source:
Now, you’re free to imagine that the manufacturers of the pyrgeometers, and the people that calibrate them on a regular basis, and the scientists who use the pyrgeometer-measured downwelling longwave data to write analyses, and the scientists peer-reviewing those analyses, and the scientists who use those analyses in their own work, are all engaged in some gigantic conspiracy, and they’re all just going through the motions to deceive you and others … however, sane folks think differently.
Next, you say:
Wrong question. The question is, warmer compared to what?
For example, if you are exposed to the 3 W/m2 radiation of open space, and then you interpose a sheet of ice between you and outer space, the ice is emitting ~ 316 W/m2, and as a result, you’ll end up warmer than you were when you were exposed to outer space.
Let me recommend my post Can A Cold Object Warm A Hot Object for a discussion of this issue.
If you are willing to challenge your view of the world, read those links, come back, and we can discuss downwelling thermal radiation. If you think anything I said in them is wrong, please QUOTE MY EXACT WORDS and show (demonstrate, not claim) exactly why their wrong.
Or you can just shine it on and perpetuate your misunderstandings.
Your choice.
My best to you either way,
w.
Willis,
Appealing to your own authority is just stupid. You wrote (in that piece of eminent silliness called The Steel Greenhouse) –
“Before we start, however, a digression regarding temperature. The radiation emitted by a blackbody varies with the fourth power of the temperature. As a result, for a blackbody, we can measure the temperature in units of radiation, which are watts per square metre (W/m2). For objects with a temperatures found on the the Earth, this radiation is in the range called “longwave” or “infrared” radiation. See the Appendix for the formula which relates temperature to radiation.
This means that we can denote the temperature of a blackbody using W/m2 as well as the traditional measures (Fahrenheit, Celsius, Kelvin). The advantage is that while temperature (degrees) is not conserved, energy (W/m2) is conserved. So we can check to see if energy lost is equal to energy gained, since energy is neither being created nor destroyed by the climate.”
Unfortunately for climate crackpots, neither the Earth nor a “steel sphere” happen to be theoretical “black bodies”. Temperatures are not measured in W/m2, except by the scientifically illiterate. Pick up a thermometer and look.
You seem to be under the delusion that the Earth magically receives as much energy from the Sun, as it emits.
Nope. Just man up, laddie, and admit you refuse to believe that the Earth has cooled to its present temperature from its initial molten state. In other words, having emitted more energy than it has received, the Earth has cooled. You don’t believe it? It’s a free world – you are free to “believe” anything you want.
Some delusional characters appear to believe that the Earth is somehow “hotter than it otherwise would be”! Really? It has cooled to its present temperature – no more, no less.
No GHE. You can’t even define this mythical creature. Best stop hitting that keyboard, lest you look even more foolish.
You can’t deny the laws of the universe out of existence just to suit yourself – but keep trying if it makes you happy.
Try to heat a teaspoon of water with a billion watts of energy from ice. How hard can it be?
I give up. You’ve proven the truth of the old adage, viz:
You are determined to desperately hold on to your views. That’s fine. I won’t oppose you, but don’t expect me to answer you either. I can’t deal with your level of intransigence.
My best wishes to you, stay well,
w.
Standard radiation physics, take a thermocouple and immerse it in a hot flame so that the measured temperature is about 1700K, make the same measurement when the ThC is surrounded by a transparent quartz tube. Guess what, the measured temperature increases to about 1850K. Just as in the steel greenhouse the radiation balance has been changed, ‘back radiation’ to the thermocouple has increased (losses have decreased).
First, immerse it in a flame is not “radiation”.
Second, show the math, new energy isn’t created, how can it get hotter?
Thirdly, this experiment is so easy to do that scientists everywhere would be using it as evidence. I don’t recall seeing in any paper.
You’re right it is a simple experiment which has been done many times. Plenty of papers on the subject, the earliest I recall was by NACA in 1949. In a flame at a temperature of about 1850K a thermocouple will lose energy to the surroundings by radiation and conduction the largest of which is radiation hence the ThC will be at a lower temperature than the adjacent gas and therefore records say ~1700K. Different methods have been investigated by NACA and others to correct the temperatures. One method was surrounding by a radiation shield (the quartz tube) another reducing the diameter of the ThC. The radiation balance shows an effect similar to Willis’s Steel greenhouse, radiation to the shield from the ThC, radiation from the shield to the ThC and to the surroundings, resulting a higher temperature of the ThC nearer to the actual temperature of the gas. A former colleague of mine wrote a paper on this subject:
https://doi.org/10.1243/JMES_JOUR_1968_010_048_02
You just described the effect of an insulator. Unless the insulator is on fire it cannot raise temperature, it can only affect the energy loss gradient. Energy loss still happens and the temp of the ThC will still fall. That is NOT the same as raising the temp of the ThC.
Yes it is it’s routine energy balance. If you have a ThC in a flame it will heat up until the energy is balanced. So when you put it in the flame it will heat up mostly by convection and at the same time radiate energy to its surroundings, its temperature will stop rising when the energy loss due to radiation is exactly balanced by the convective gain from the flame. That temperature will be below the flame temperature. If you can reduce the loss to the surroundings the ThC temperature will be closer to the flame temperature, i.e. hotter. In order to get a more accurate flame temperature various methods to reduce the losses have been tried including the radiation shield I described. You need to learn how energy transfer works.
“If you can reduce the loss to the surroundings the ThC temperature will be closer to the flame temperature,”
This does *NOT* mean the insulator is warming the ThC! The only energy source is the flame. It is the *flame* that raises the temperature. Lowering energy loss is *not* the same thing as raising temperature.
That’s exactly what it is, lowering energy loss raises the temperature of the Thermocouple. The flame determines the maximum temperature that the ThC can experience the actual temperature depends on the losses.
Tw = Tg – (𝜎𝜖Tg^4 – 𝜎𝛼Ts^4)/h
Tw is wire temperature
Tg is gas temperature
Ts is shield temperature
Energy loss can *never* warm anything. It can’t drive temperature up no matter how much you wish it to be so.
If you wrap the ThC with insulation *after* it has been heated that insulation simply can’t drive the temp back up. All it can do is slow down the cooling.
your forumula shows Tg and Ts as both being negative. That’s a perfect clue that they can’t add heat to the ThC. Without the addition of heat the temp of the ThC can’t co anything but go down. Going down doesn’t *RAISE* the temp of the ThC at all.
Physics of heat transfer refutes your argument. I suggest you look at the equation again, you do understand the function of brackets right? You don’t appear to understand how the experiment works.
I think *YOU* need to look again.
Is 𝜎𝜖Tg^4 > 𝜎𝛼Ts^4 ?
It is highly doubtful that the temperature of the gas around the wire is lower than the temperature of the shield.
Thus 𝜎𝜖Tg^4 – 𝜎𝛼Ts^4 will likely be positive.
Is 𝜖 < 𝛼 or is 𝜖 > 𝛼
If Tg > Ts then 𝜖 < 𝛼 better be true for the gas to be cooler than the shield.
Sorry typo in equation, should be:
(𝜎𝜖Tw^4 – 𝜎𝛼Ts^4)/h
Tw = Tg – (𝜎𝜖Tw^4 – 𝜎𝛼Ts^4)/h is less than Tg.
Thus the closer Ts is to Tw the closer Tw is to Tg, so as I said before to have the Thermocouple represent the gas temperature accurately needs a hotter shield.
Use an unshielded thermocouple in a flame surrounded by a wall at ~500K will cause a significantly lower Tw than Tg because 𝜎𝜖Tw^4 will be much larger than 𝜎𝛼500^4 and therefore net heat loss by the ThC will be large. Put the quartz shield around the ThC and the Ts will be more like 1700K, thus the net heat loss by the ThC will be much smaller and thus: Tw = Tg – (𝜎𝜖Tw^4 – 𝜎𝛼1700^4)/h
Therefore the reduction in radiative heat loss increases the wire temperature.
All you have really shown is that lower heat loss lets the ThC heat driver raise the temperature further. That is *NOT* the same thing as the lower heat loss driving temperature up. The insulating material provides *NO* heat, it is *NOT* a source.
Actually what I have shown is that you lack a basic understanding of the physics of heat transfer. In a system in equilibrium, such as Willis’s Steel Greenhouse or the ThC in a flame, lower heat loss does drive temperature up!
Sorry, insulation is *not* a heat source. It merely lessens heat loss. It doesn’t matter if that insulator is wool, asbestos, glass, quartz, foam, brick, wood, air, or anything else.
conductive heat loss is:
q = [Ak(t1-t2])/x where
A is Area
k is mean thermal conductivity
x is the thickness of the insulator
t1 is the hot side
t2 is the cool side.
You will notice that there is no q_insulator in the equation. That’s because the insulator is not a heat source. It doesn’t matter if the insulator is the gas around the wire or the quartz shield.
If the construction of the ThC is wire inside a quartz tube filled with gas then the heat source is outside the quartz. t1 is the temperature of the heat source and t2 is the inside of the quartz. Then you also have a temperature gradient across the insulating gas where t1 is the inside surface of the quartz and t2 is the outside surface of the wire.
I sincerely doubt that radiation (i.e. T^4) is the driving source of the heat transfer from outside the thermocouple. There simply isn’t enough surface area either from the source or any of the substances making up the thermocouple to transfer much radiative heat. The conductive factor will be much larger.
It still means that the quartz or the gas are *not* heat sources. The heat source is outside the thermocouple. You can make the wire closer to the temp of the heat source by increasing the conductivity of material surrounding it, e.g. by making the quartz thinner which is the “x” factor above. But that is nothing more than reducing the heat loss between the source and the actual measurement device.
The insulator has nothing to do with the system I described. If you’d read the paper I referenced or looked for a similar one you would have seen that.
A fine wire thermocouple is used which has long wires so the main heat transfer mechanism is convection from the flame and radiation loss to the surroundings hence the equation I showed:
Tw = Tg – (𝜎𝜖Tw^4 – 𝜎𝛼Ts^4)/h
Your ‘sincere belief’ is irrelevant, those who have conducted the experiment have found that in the absence of a radiation shield the temperature measured can be ~150K below the flame temperature, addition of a shield reduces that difference.
Try this: https://www.osti.gov/etdeweb/biblio/21099102
“ so the main heat transfer mechanism is convection from the flame and radiation loss to the surroundings hence the equation I showed:”
Slow down and re-read what I said. Insulators cannot be heat sources. That’s exactly what you imply that the main heat transfer mechanism is convection from the flame.
From the abstract: “The energy is transferred by convection to the thermocouple and then dissipated by radiation to the surroundings. :”
Please note that the thermocouple must be connected to something in order to be able to indicate a change of state in the thermocouple. Thus you will also have conductive heat loss through what ever that connection is, it won’t be just radiative heat loss. I don’t have full access to the paper but I have to wonder how they allowed for conductive heat loss. They do not mention it at all in the abstract!
“Please note that the thermocouple must be connected to something in order to be able to indicate a change of state in the thermocouple. Thus you will also have conductive heat loss through what ever that connection is, it won’t be just radiative heat loss. I don’t have full access to the paper but I have to wonder how they allowed for conductive heat loss.”
That was covered in the sentence you conveniently omitted:
A fine wire thermocouple is used which has long wires so the main heat transfer mechanism is convection from the flame and radiation loss to the surroundings hence the equation I showed:
A fine wire thermocouple is used which has long wires so the main heat transfer mechanism is convection from the flame and radiation loss to the surroundings hence the equation I showed:
And you think those “long wires” won’t conduct heat away from the thermocouple?
I don’t see *any* conductive factor in your formula. (Hint: T^4 is a radiative factor, not a conductive factor)
Not significantly, the scientists and engineers who worked on this actually measured the loss due to conduction and determined that it was insignificant compared with radiation. That’s why I didn’t include the term and why authors of various papers didn’t. The reason why one designs ThCs with long lead wires is to reduce the losses from the sensor, the losses are proportional to the length and the temperature drop along the wire which by design is minimized.
Try reading this for example:
https://www.researchgate.net/publication/239774423_Thermocouple_Response_in_Fires_Part_1_Considerations_in_Flame_Temperature_Measurements_by_a_Thermocouple
Since you appear to have difficulty reading papers I’ve included the following:
Thermocouple Energy Balance
At thermal equilibrium between a stably oxidized thermocouple and a clean flame, where the thermocouple can ‘see’ cold surroundings at Ts
outside the flame, the heat balance can be written:
(equation omitted because it would not copy properly but it is the same as what I showed above)
This is a simplified form of the heat balance as transient effects and conduction along the thermocouple are neglected. These effects will be
discussed in the following sections.
From another paper:
In general, the conduction error can be minimized by using small diameter thermocouples or by choosing an appropriate wire length. As an example, a length-to-diameter ratios larger than 200 is suggested in Heitor and Moreira (1993) to minimize this effect.
I’m fully aware that T^4 is a radiative effect thank you, I’ve been working on the subject for ~50 years!
“This is a simplified form of the heat balance as transient effects and conduction along the thermocouple are neglected.”
Sorry to be so long in replying. Life intrudes sometimes.
I started working in my father’s shop at age 14 using an AC Lincoln stick welder and an acetylene welder. Worked on everything including welding sheet metal, tailpipes on cars, and even cultivator frames on tractors. I’ve used a forge to make a knife and an acetylene torch to harden chisels, scrapers, and mower blades. I’ve even used hair-fine wire to solder directly to SMT parts on a prototype circuit board.
Anyone that ignores transient effects and conduction on *anything* is likely to catch the grease buildup under a car on fire when heating a tailpipe or melting a hair-fine wire connecting to an SMT element. Even when hardening a chisel you don’t rely on radiation to cool the edge, the heat will conduct up the chisel and harden the handle as well thus making it brittle and prone to breakage.
The finer you make the wire the less area it has to radiate heat away and the more it will heat up from conduction (higher thermal resistance because of smaller cross-section). And just how much leeway do you have in making wire shorter? It’s got to be long enough to reach the measurement device! And that doesn’t lessen heat conduction down the wire in the thermocouple as well as connections to thermocouple. That conducted heat will make the connecting wires more brittle and will lessen the life of the device because of breakage.
I suggest you get Planck’s thesis on heat and work through the math so that you can provide some evidence. As Tim has pointed out you must also take into account conduction at least.
Like it or not net heat flows from hot to cold until equilibrium is achieved. It is one direction only. To do otherwise is violating entropy. You need to set up the gradients for each part of your experiment and determine how they change throughout you experiment. If you have had any thermodynamic classes you will know that simple algebra only describes a moment in time, not an ongoing process.
Lastly, ask yourself if the system can ever achieve thermodynamic equilibrium and if so at what temperature. If your math shows a higher temperature than your source, then ask and determine where additional energy is being created. If equal temps are achieved at all points then determine why insulation and back radiation don’t cause a permanent imbalance between the parts.
Are you related to Tim?
Do you understand what ‘net heat flow’ is, by using that term you are implying flow in both directions?
As indicated above the ThC temperature(Tw) is always below the gas temperature (Tg).
The equation:
Tw = Tg – (𝜎𝜖Tw^4 – 𝜎𝛼Ts^4)/h
The experiment shows that Tw will be closer to Tg if the radiation heat transfer from the surroundings, 𝜎𝛼Ts^4 is closer to the radiation heat loss from the ThC, 𝜎𝜖Tw^4.
I can’t access the paper to see how the experiment was set up. I suspect the flame was actually heating the shield directly which then heated the ThC. That’s not an appropriate model for the earth. The sun is assumed to not warm the atmosphere, i.e., the shield.
It’s the same energy balance equation, and yes the sun does warm the atmosphere, about 23% of incoming solar energy is absorbed by the atmosphere.
Willis,
You wrote –
“I give up.”
Nonsense. You still refuse to accept reality. The Earth has cooled to its present temperature. Nothing has managed to stop it.
You also wrote –
“I can’t deal with your level of intransigence.”
Awww, diddums! Are you sure you didn’t mean that you can’t face facts? Grow a pair, Willis!
And then you wrote –
“My best wishes to you, stay well, . . .”
What a peculiar thing to write! Your best is obviously somewhat less than my worst, so what form of mental defect leads you to think that I would value such a bizarre comment?
Carry on with your Magical Energy Multiplier (AKA the Steel Greenhouse). I do not know whether you are scientifically illiterate, ignorant, or just exceptionally gullible with regard to the nonsense promulgated by the likes of Mann, Schmidt, Hansen, Trenberth, and the rest of the climate crackpots.
Off you go now, keep avoiding reality. It obviously suits you.
Pass. I see that I had ignored the first rule of pig wrestling:
“Never wrestle with a pig. You’ll just get dirty, and the pig enjoys it”
w.
“Appealing to your own authority is just stupid. You wrote (in that piece of eminent silliness called The Steel Greenhouse) –”
Astrophysicist Joseph Postma destroyed that piece of junk science but Willis still persists with it.
Very sad.
Please Postma didn’t have a clue!
I think your description is relavent to a point. I’m pretty sure “some back radiation” does exist. Molecules emit as an isotropic readiator, meaning the same energy in all directions via a spherical Electromagnetic (EM) wave. This is modified by the fact that collisions occur quite often where energy is transferred to other molecules reducing the amount of radiation. This does warm the whole atmosphere more than just conduction with the earth.
There are terms being used here that are not precise. To me “surface” means the land and oceans. This is appropriate from a thermodynamic point of view since the surface is what primarily absorbs the short radiation from the sun (that’s ignoring far IR absorbed by H2O). The atmosphere is that substance called “air”. Too many times what is referred to as the “surface” is actually the lower atmosphere. Thermodynamically and traditionally, the atmosphere is another body and is unaffected by the sun’s radiation.
Can a cold body warm a hotter body? No it can’t. However it is more complicated than that. The surface has a gradient (temp / time) of cooling and the atmosphere has a gradient (temp / time) of warming. Basically, the atmosphere acts as an insulator. It warms as the surface radiates. Heat is sent back from the atmosphere to the surface modifying the cooling gradient to make it less. This means over a fixed time the surface will cool less than it would without the insulating affect of the atmosphere. But, here is the rub, the surface still cools, it doesn’t get hotter. What does happen is that the atmosphere will continue warming because of the hotter surface continuing to radiate.
This is one reason simple averages hide things. In reality the sun radiates the earth for about 12 hours and then begins to cool. That means the surface gets warmer faster than the average will show and cools faster than the average shows.
Aha, the great genius nicknamed ‘Swenson’ aka ‘Mike Flynn’ comes here around with his pseudoscientific blah blah blah.
Swenson is the genius who endlessly discredits people knowing about “downwelling thermal radiation” with the amazingly stoopid question:
” Do you think that putting CO2 between the Sun and a thermometer makes the thermometer hotter? ”
But… no wonder. He also belongs to those ignoramuses who think that Cassini, Newton and all their successors were wrong concerning the Moon rotating about its polar axis… Yeah.
Between sound skepticism and pseudoskepis aka denial,there is an unbridgeable gap.
Yeah, when they start out insulting the author it’s a “red flag” to me. They have an agenda.
Your information, giving context, is appreciated.
“Let me suggest that you take Maurice Switzer’s excellent advice”.
Why should I Willis? You obviously didn’t.
Willis,
Please beware poor data quality. Quick example, on your global T summary map, look at the higher detail in North America versus all of Africa. One cannot really infer similar conclusions from each, or make comparisons with Arctic regions.
The big question that arises with this analysis is why T change gradients (as poorly measured) should vary from one region to another. CO2 is a well-mixed gas, so it should react equally everywhere.
One logical conclusion is that the relation between air temperature and air CO2 concentration is not understood adequately to be used as other than Work in Progress and certainly should not be used for formulating action policies. Geoff S
”Please beware poor data quality”
1958 and 2000 was the same temperature globally. I would add that 1940 to 2020 was probably also the same temperature. Errr…where’s the warming?
Why do people continue to ignore these simple facts? Is money involved?
Here’s the late great Proff Bob Carter saying the same thing in 2013….
“Why do people continue to ignore these simple facts? Is money involved?”
I think it has become a habit for many people. It’s not worth their effort to argue over the nuances of the temperature record.
Even though the central claim of the alarmists is the Earth is currently experiencing unprecedentd warming and this is because of human-derived CO2.
If we are not experiencing unprecedented warming, as you are pointing out, then this means CO2 is a minor player in the Earth’s atmospheric temperatures, so the alarmists distort the temperature record (Hockey Stick charts) to make it appear we are living in the warmest times in human history, and many people allow them to get away with it for various reasons.
The written, unmodified temperature record shows we are not experiencing unprecedented warming, contrary to what the alarmists say, and this means we have nothing to fear from CO2.
There is no unprecedented warming today. There is no need to regulate CO2.
Only use radiosondes (1958), satellites (1979) and ARGO (2004). Bob Carter made effective use of a combination of radiosondes and satellites.
I am at 47°N, in the dry central part of Washington State.
Now with 5 inches of snow.
Waiting for warming.
John Hultquist
I’m afraid you’ll have to wait for a (longer) while.
Northern US is, like some parts of Canada, a cold corner with few hope for warming.
I am in Northeast Germany at 52°N, and… zero or very few snow since many years, especially in November.
5 inches? The entire winter 2020/21 brought us less than 10.
Our last winter that deserved that name, with over 30 cm snow in February, was … in 2010.
But in many places in Germany, located below 50°N, the last winter was quite snowy.
Let’s see how the coming winter shows up.
https://earth.nullschool.net/#current/wind/isobaric/500hPa/orthographic=-99.88,50.96,304
It looks like the Polar Jet Stream is pulling back to the north over the U.S., so the U.S. should have fairly mild temperatures until the next dip in the jet stream circles around this way.
The Subtropical jet stream is bringing moisture into the south-central U.S.
I think this shows it best:
https://www.cpc.ncep.noaa.gov/products/CFSv2/htmls/usT2me3Mon.html
All these poor people living in Northern CONUS, Western Canada and Alaska, who still keep thinking that NOAA only produces fudged data, might have a big surprise in a few months:
That’s not data, that’s a climate forecast. Is it right? Who knows.
w.
Willis
That was just a bit of irony concerning John Hultquist’s statement:
” Waiting for warming. ”
*
Btw: I’m making the interesting experience that since the beginning of the current La Nina, many people discredit NOAA’s forecasts concerning temperatures as something ‘speaking about the unknown’, but conversely fully agree with the NINO3+4 forecasts coming from the very same institution:
Strange days…
Here in England any warming during the winter months l think has largely been down to changes in the weather patterning. With more warm coming from the Atlantic and less cold air been drawn down from the Arctic or the east due to a decrease in northern blocking. But there has been little to no change to the timing of the onset of winter over the last 40 or more years here in England. As there has been no real delay in the timing of the first winter’s snow since the late 1970’s
Willis. I thank you for your contributions to the discussion. If you will forgive me, I would like to make a general comment on global warming and not just your specific post. Just this day, I read about a place in northern Algeria, that would be the Sahara Desert, and that 8,000 years ago it was named either the place between the rivers or the river plateau. Lots of grain raised there, lots of African Crocodiles. Lots of rivers, Hippos, and so on. That caused me to think about the many inland lakes in the U.S. that used to exist and are now dry lakes. Think Bonneville and the many dry lakes in eastern Oregon, Washington, Western Utah, Nevada, Southern California, Arizona and so on. Lots of evidence of Native American settlement and use of those now gone features. (oh, about 8,000 years ago) So, it occurs to me that “Global Warming” is nothing new but in fact a long term process that is largely a positive for human kind. Anyone who thinks global cooling is a good thing is an idiot. You welcome the return of continental ice sheets if you like, I choose not.
By the way, as a child, I lived on a farm in the Ozarks with no electricity, no running water, wood for heat, and a hole in the ground for a toilet and I vote no thank you.
Did we do it? Well, not just no, but hell no. This thing has been going on for thousands of years, long before the so called ‘rise of man’ and the earth will do whatever the hell it will do no matter what we do.
For your reading pleasure:
Saudi Aramco World : Last Lakes of the Green Sahara
I also have always heard that it would warm fastest where it’s colder, and at night, but I understood why they were saying this. Most of the predicted warming comes from H2O, not from CO2. Where it is cold it also happens to be dry(er) because cold air cannot hold as much water vapor. If CO2 manages to warm an area slightly, it should be able to hold more water vapor and that will have a bigger impact on air temperature. Makes sense so far.
This means a place that is just naturally dry (like many deserts) will be less effected at night than areas where it is just cold. The desert looses it’s heat and temperature plummets, but without an available source of water vapor it just will not retain as much heat as it might have done had additional water vapor been available.
The big problem with nighttime warming is it is also a predicted outcome of the Urban Heat Island (UHI) effect. How does one tell the difference? Actually it’s straight forward – just compare nighttime warming of rural areas versus nighttime warming of urban areas and you can easily identify the UHI effect. This has been done with U.S. data and most of the supposedly CO2 induced warming just disappears – it is instead UHI. Since almost all warming in the U.S. has occurred due to a rise in maximum nighttime temperatures and not in a rise of maximum daytime temperatures one is left wondering just how much impact CO2 really has.
” This has been done with U.S. data and most of the supposedly CO2 induced warming just disappears – it is instead UHI. ”
I would enjoy a valuable source. Not something like the (No?)TricksZone.
Here you go. Heating/cooling degree days in the U.S. Funny how the heating degree days are falling faster than the cooling degree days are rising.
This reply, Gorman, is – as so often when you were the author – one more time a perfect non-sequitur: is has nothing to do with what Robert of Texas wrote about.
He wrote:
” Actually it’s straight forward – just compare nighttime warming of rural areas versus nighttime warming of urban areas and you can easily identify the UHI effect.
This has been done with U.S. data and most of the supposedly CO2 induced warming just disappears – it is instead UHI. ”
1) Your graph barely could be put in any relation to that. it’s useless in this discussion.
Moreover, this 65 °F threshold is ridiculous, based on a subjectively set benchmark.
What you should have presented – and what I still expect from Robert of Texas – is a paper discussing a separation of night time minima between rural and urban stations – in CONUS and anywhere else.
*
Thus, the very first would have been to consider minima, as did John Christy in January 2021 in a paper (that soon disappeared due to a stupid gov seal problem). Here is a screenshot:
This evaluation, based on lowest measurements, is for obvious reasons much better than the threshold-based evaluation of CONUS maxima temperatures (above 95 resp. 100F) he presented on Roy Spencer’s thread in 2018.
Here is his maxima evaluation:
Already on these graphs you begin to see that yours does not hold water.
That graph is based on actual measurements dude. Every commercial HVAC installation residential and building is based on cooling/heating degree days. It is used to estimate power consumption, etc. You want to see changes, look at these, not fudged temps.
2) But what I miśsed in John Christy’s CONUS evaluation is a stat concerning not only the lowest minima but the highest ones as well.
I did that for CONUS on the base of GHCN daily (because USHCN of course is restricted to the US), switched from colums to line display and showed the time series with a percentile scaling allowing a better comparison:
And here is the same output for the Globe.
On this graph, we see clearer that the low minima decrease over tine, and that high minima and maxima go hand in hand since the 1970s.
If there was any distinction between rural and urban stations in the 20,000 US and 40,000 Globe stations in GHCN daily, I would of course separate them.
This distinction existed in the GHCN V3 data set, but the rural marks in the metadata are in between completely outdated.
Yes, Mr Gorman: here I go.
Read this! There are two sides to every argument. Declaring yourself the winner is probably premature!
https://link.springer.com/article/10.1007/s00382-021-05626-x
Look at a colorized map of changes in temperatures across the Continental U.S. (CONUS). It will show the bulk of any warming is in urbanized areas. “Average” U.S. temperatures are polluted by UHI.
More like “Warmer where nobody can look outside at the thermometer and call bullshit.“
Thanks for an informative article Willis.
You have a point when you suggest that people living in the north may see it as an advantage to have slightly milder winters.
I still think it’s a dangerous experiment to continue to emit billions of tonnes of CO2 though.
The CO2 level is higher than it has ever been in the last 3 million years, and it continues. to increase by 2 to 3 ppm each year.
We must start on the path towards replacing fossil fuels with nuclear power and renewables.
It will not be easy or cheap, but we have to go in that direction. If not for any other reason, the amount of fossil fuels are after all limited so the use has to stop sooner or later.
The problem, as I see it, is that this topic has become so polarized that any reasonable discussion of viable solutions is poisoned by extremists on each side.
/Jan
Where is the proof that current CO2 levels are higher than have ever been in the last 3 million years? Also, why bleat about a “problem” to which every solution appears to be impoverishment of western democracies?
Jan, not sure why it’s a “dangerous experiment” to increase atmospheric CO2. Nature has already done the experiment without catastrophic results. Here’s a bit of history:

Next, you say:
We “must”? We “have to”? Sez who?
Fossil fuels are not “limited” in any practical sense. As we use them, we find new sources … and we haven’t even touched the methane clathrates.
Always good to hear from you,
w.
Well, you show that CO2 was slightly higher, 23 million years ago, and much higher 65 million years ago.
That is a long time.
Most of the current plant and animal species did not live in that time. Our current flora and fauna are not prepared for a higher CO2 level.
Furthermore, the high CO2 level results in lower alkalinity in the ocean surface water.
Our current marine species are not prepared for that PH level.
Therefore, it is a dangerous experiment.
I agree that there are still quite a lot of fossil fuel reserves left in the ground. It may last another hundred years, but it is nevertheless limited, and it must eventually end.
Therefore, ending it is a “must” in the long run.
And we should do it smart.
China plans 150 new nuclear reactors over the next 15 years. Both the US and Europe should do the same.
China Climate Goals Hinge on $440 Billion Nuclear Power Plan to Rival U.S. – Bloomberg
And we need to catch up with China on renewables as well.
Always interesting to talk to you Willis.
/Jan
“Our current flora and fauna are not prepared for a higher CO2 level.” Proof? Since current flora and fauna developed under higher CO2 levels, why would they suffer under lesser levels of atmospheric CO2?
“Our current marine species are not prepared for that PH level.” Proof? Since current marine species developed under higher CO2 levels, why would they suffer under lesser levels of atmospheric CO2?
Jan, as Dave Fair said below, “Proof?”. Mammals and birds came into existence when CO2 levels were five times their current value. Fish came into existence when levels were 15X current value. Greenhouse owners routinely pump CO2 into their greenhouses to increase production. And humans live quite happily at 3,000 ppmv.
I see nothing in there to support your claim that “flora and fauna are not prepared for a higher CO2 level”.
Regards,
w.
There is no proof either way.
It can be okay to live with twice the CO2 level we have today, but it may also not go so well. Most scientists believe in the latter, but they can of course be wrong.
Ultimately, it is a risk management problem; whether it is worth spending some of our income today to reduce the risk of a bad outcome in the future.
I think so, and I also think many of the technological solutions look promising and quite exciting.
/Jan
Co2 feeds plants and cools the atmosphere to space.
That’s it.
That dogmatic statement should have a citation with it.
Yes, there IS proof. Increased CO2 is PROVEN to increase plant growth. Humans are PROVEN to live happily at 3,000 ppmv. It is PROVEN that mammals and birds emerged at much higher levels of CO2.
On the other hand, there is vitually no proof that CO2 is the secret temperature control knob, and there is lots of proof that it has been warmer in the recent past with much less CO2.
Finally, when people talk about “spending some of our income today”, somehow it always comes down to increasing energy prices, the most regressive tax available which hits the poor the hardest … while the wealthy don’t give up their private jets.
So the general mantra is “let’s screw the poor today on the off chance that it might make the world half a degree cooler in fifty years” … sorry, not interested in the slightest.
w.
You are right that birds and a few early mammals developed under higher CO2 level. Furthermore plants in greenhouses grow better with higher CO2 level.
But nature is more complex than that.
That some species tolerate higher CO2 level does not prove that we will be without other negative consequences.
What I mean in a more wider perspective is that there is no proof that we will not see huge negative effects of higher CO2 levels when we consider all aspects of our descendants well-being on the planet.
If we had proof of that, there would not be any climate debate. No reasonable scientists would then worry about it.
However, most scientists think it can become a huge problem so it is not proven not to be one.
I totally agree that the poor should not pay the price for this.
Todays economic ineqality is in my view obscene, and we need less of that, not more. If we want to find solutions, it is possible to find them such that we both reduce CO2 emissions and economic inequality.
Jan, if you wish to worry about things for which we have no evidence, and in fact for which we have evidence that they are not true, like the idea that higher levels of CO2 will harm animals and plants, hey, go for it.
And no, “most scientists” don’t think high CO2 levels will harm plants or animals. They think that higher temperatures will harm them … but we have little evidence for that either.
I say again—for FIFTY YEARS we’ve been told that doomsday is just ten years away … and NOT ONE of those predictions have come true.
How many failed predictions is it gonna take to convince you that “most scientists” don’t have a clue about what the effects of either CO2 or a degree or so of global warming will do?
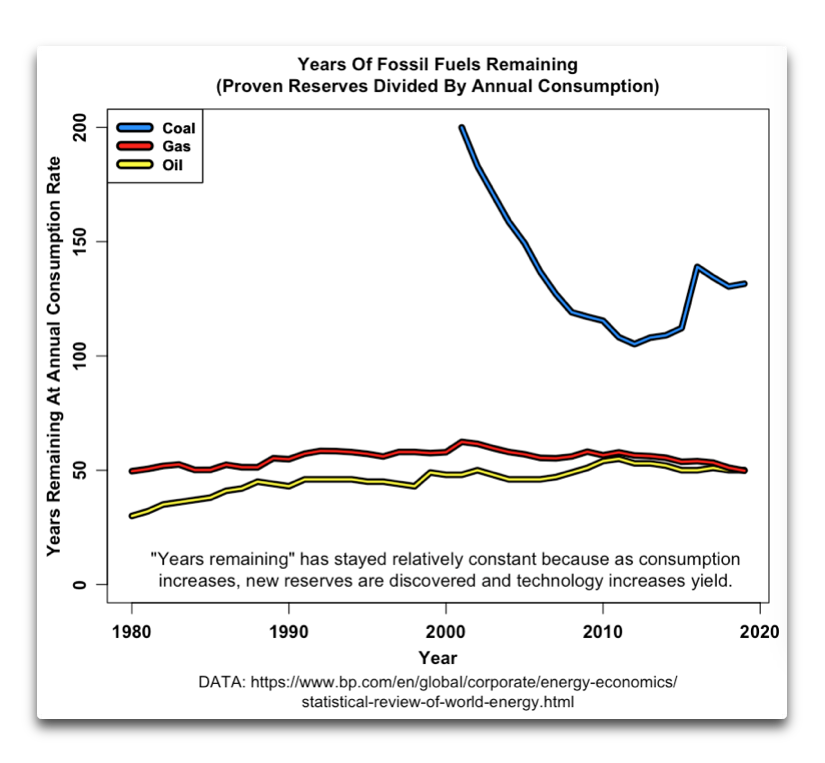
Not only that, but here’s how successful the actions of “most scientists” have been in fighting the eeevil CO2 menace …
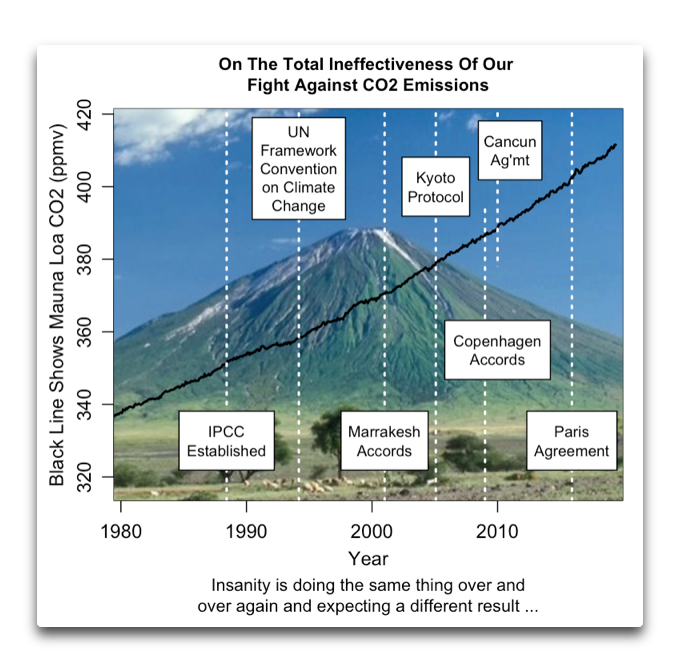
Point out where their actions have had any effect at all.
So … just how are you planning to reduce CO2 without harming the poor? The plans of “most scientists” HAVE harmed the poor, and have been totally ineffective. What’s your brilliant plan?
And if you don’t have one … then how about you go away until you do have one. Because waving your hands and saying that most scientists predict doom and destruction goes nowhere.
w.
I love that graph! 🙂
If we want to reduce economic inequality then implement the Free Market. The Free Market raises all boats.
What is wrong with CO2?
“I still think it’s a dangerous experiment to continue to emit billions of tonnes of CO2 though.”
Jan,
At least you didn’t call it pollution! Of course, CO2 is essential for life on Earth. Perhaps the best proof that the “climate crisis” is mad is that people who call themseles green demonise the very thing that makes the planet green. Many of them do indeed call it “carbon pollution”, which is about as mad and ignorant as it’s possible to be.
CO2 really is the gas of life. Increased CO2 is literally increasing the abundance of life and making the planet dramatically greener (e.g. a major NASA study from a few years ago which attributed the greening to enhanced CO2 and – what irony – global warming). If this is indeed an “experiment” then it is certainly not dangerous, it has been a huge success.
Remember that Nature emits roughly 30 times more CO2 than humans.
As Willis’ graph shows, when the dinosaurs vanished about 65 million years ago, atmospheric CO2 was about 4 times higher than today, and in earlier epochs, when there was often more abundant life than today, far higher.
So, sorry, I don’t lose any sleep because of increasing CO2. But I do lose sleep because of the anti-human climate madness that is sweeping through much of the western world.
Chris
Thanks for comment Chris
Nature emits a lot of CO2 from rotting plants, especially grass and leaf which dies and rot every rear. Next spring nature sucks it up again. That is the short carbon cycle. It is between atmosphere and plants.
However, plants cannot store infinitely much carbon.
When they die the carbon is released again.
Humans are short circuiting the long carbon cycle.
That is the cycle between fossilized plants and atmosphere.
The natural emissions in the long carbon cycle comes from volcanos and is small compared to the human emissions.
/Jan
So what? What is the problem? A slightly warmer and wetter world with CO2-greening seems to be a boon to Mankind. That is all that is “predicted” by the UN IPCC.
There are more bad things.
The projections shows more flooding in some areas and more droughts in other.
Probably fewer but stonger hurricanes.
There will also be continued sea level rise, especially in the next century.
In last interglacial, 125 000 years ago, the sea level was 8 meter higher than today.
https://www.e-education.psu.edu/earth107/node/1496
Millions of years ago, when the CO2 level was higher, the sea level was also much higher.
What you are stating as fact are opinions mostly based on models of questionable validity.
“There will also be continued sea level rise, especially in the next century.”
Really? Are you related to Nostradamus? Maybe you have access to sea level models that have been proven correct in their forecasts?
I don’t have access to models,
I just referred to what the published scientific articles say. I have linked to them above.
UN IPCC CliSciFi “projections” are based on models that don’t even reflect the past accurately.
The fact that sea levels were higher during the last interglacial proves CO2 is not the climate’s driver.
Please note that the Earth’s continents have been all over he place in the past. Not the same climate!
No, it does not prove that because there can be more than one climate driver.
The fact that temperatures went up in the last interglacial just proves that there also exist other climate drivers than CO2.
OK, Jan, please describe those other climate drivers and their importance in relation to CO2.
Over the Holocene, interglacial temperatures have varied significantly, with no concommitment significant variations in CO2 concentrations. Please explain the drivers of those variations.
Wait … hang on … seems like I heard those dire predictions somewhere before …
Oh, yeah, I remember now … I’ve heard them every friggen year for the last half century!
Could you at least find some new boogeyman to try to scare us with? ‘Cause in addition to being booooring, that one is waaay beyond its use-by date …
w.
When an independent «citizen scientist» like you go out against the entire scientific community, they can be right, but that is rare.
In almost all cases the contrarian is wrong, and the community is right.
Just be aware of that.
After 50 years of failed doomcasts by “the entire scientific community”, anyone still thinking they are right isn’t paying attention.
Me, I learned something important from my friend Tom Morey, the inventor of the Boogieboard. He said he used to think of inventions, and his mom always told him “If that was such a good idea, someone would have thought of it already”.
“One day,” he said, “I kinda woke up and thought, wait a minute! There are lots of great ideas out there that nobody has ever heard of.”
You are arguing from consensus. Michael Crichton put it best:
Just be aware of that …
w.
“What is relevant is reproducible results.”
Climate scientists and Scientific Organizations should take this to heart.
If your results can’t be reproduced, then you have nothing.
The alarmist climate scientists who claim today is the warmest period in thousands of years have either been debunked (Mann), or refuses to provide the data necessary to duplicate his results (Jones).
Scientifc Associations know this is true, but they pretend it is not. This makes them Anti-Science Associations.
There is no evidence for unprecedented warming today. Scientific Associations should be the first to question people who won’t or can’t prove their results. Especially considering the negative ramifications of going ahead with trying to regulate CO2. Instead, they stand with the Data Manipulators/Data Concealers. Something is very wrong with this picture.
Jan,
I’m familiar with the history of science. It is basically the story of how one concensus after another turned out to be completely wrong.
Some famous “contrarians”:
Galileo, who had the ridiculous idea that the Earth circled around the sun.
Bruno (who was burned at the stake for his beliefs).
Wegener, who clearly saw that the continents were not fixed.
Einstein
Some scientific concensuses from the past:
Phlogiston
The Ether
Meteors created in the atmosphere
Lunar craters all volcanic
Continents fixed and unmoving
The Milky Way galaxy being the entire universe.
The Steady State theory of the universe.
Eugenics.
Global cooling in the 1970’s
etc etc
A complete list would be very, very long.
Science does not work by concensus. It works – or should work – by evidence and proof. The very essence of science is scepticism. The beauty of this is that it is self-correcting – it often initially gets things wrong, but as the evidence and proof accumulates, it changes. This will almost certainly happen with the present climate concensus, but sadly I probably won’t live to see it.
Your faith in the IPCC is touching. Some scientists worked for the IPCC and became sceptical when they realised how corrupt the IPCC is. Many commented on how angry they felt because they had been misled.
I’m not aware of a single substantive prediction made by the IPCC, climate science or the climate models that turned out to be right. The list of failed predictions – e.g. summer ice free Arctic, the tropical hotspot, the predicted amount of global warming – is very, very long.
Surely, if someone keeps on making predictions that all turn out wrong, you wouldn’t continue to believe any more predictions. Would you?
Chris
I agree that a lot of rubbish is said in the mainstream media about climate change. Some scientific articles are also questionable.
But there are also high quality scientific reports which tells us that we have reason for concern. We also have the IPCC reports which I regard of credible.
IPCC do not say that we have a catastrophe or that “we have x years left before it’s too late”. They say their projections just tells us that we most probably will see some serious negative consequences if we continue emitting so much CO2.
Theuy also say that the elevated CO2 level will stay in the atmosphere for centuries.
It is possible to avoid those problems if we choose to do so.
In my view we should do that.
Their “negative consequences” mostly have to do with higher temperatures. And none of those “negative consequences” have ever come to pass. We are not seeing crop failures due to higher temps. We are not seeing higher levels of hurricanes and tornadoes. We are not seeing increased desertification. We are not seeing Artic/Antarctic ice completely disappearing. We are not seeing polar bears going extinct. We are not seeing massive migrations due to rising sea levels.
When people look around and see absolutely none of the predicted “negative consequences” occurring they begin to question the “scientific consensus”.
Remember, the IPCC predicts a higher *average” global temperature which most people take as the earth turning into a cinder. And the IPCC never does anything to change that perception. If the higher “average” temp is due to higher nighttime temps then the “negative consequences” will never happen because that is a good thing! But it won’t generate as much grant money and it won’t generate as much FUD in the populace leading to a gain in power for governments to provide “solutions”.
The IPCC should be forced to have climate models predict both max temps for the globe as well as minimum temps for the globe. Don’t hold your breath waiting for that to happen!
Jan Kjetil Andersen
Please, good sir, stop with the handwaving. If there is a scientific report that you think is “reason for concern”, link to it.
And if you think the IPCC reports are “credible”, you haven’t done your homework. You could start with “Caspar And The Jesus Paper“.
w.
And human emissions are small compared to out-gassing from the oceans and biogenic respiration.
The net CO2 balance between oceans and the atmosphere goes the other way, the oceans absorb more CO2 than they emit.
https://hahana.soest.hawaii.edu/hot/products/HOT_surface_CO2.txt
Concerning the biogenic respiration, that is the short carbon cycle, which I answered to Chris on above.
In late November, residents of Europe may find that winter temperatures depend on the strength and pattern of the stratospheric polar vortex.

There is an apparent delay of several days before the pattern from the lower stratosphere moves into the upper troposphere.
Greetings to Willis.
Precipitation in British Columbia.
https://www.accuweather.com/pl/ca/kitimat/v8c/weather-radar/52734
“An area of high pressure is expected to build across the interior western United States, and a strong jet stream will bend southward over the Southwestern states, setting the stage for a round of strong northeasterly winds in Southern California, known as Santa Ana winds, into Monday afternoon.”
Here’s the the high-pressure system (center, marked) that will cause the Santa Ana winds. The winds are circulating in a clockwise manner around the center, blowing from the mountains (east) to the ocean (west) along the southern part of the high-pressure system. This will cause increased temperatures as the winds blow down the mountains to lower elevations to the west.
https://earth.nullschool.net/#current/wind/isobaric/500hPa/orthographic=-82.26,47.78,304/loc=-114.026,40.271
And notice there is a low-pressure system (counter-clockwise rotation) southwest of and right next to the high-pressure system and its circulation pattern will enhance the strength of the winds coming off the southern part of the high-pressure system.
Nicely put. I’ve been trying to explain this to people for years and they don’t get it. Bhr a graph is worth 1000 words.
Most of the climate anomalies we will experience this winter will be related to ozone anomalies and decreasing UV radiation.

https://www.iup.uni-bremen.de/gome/gomemgii.html
The focus should not be on the beginning of the cycle, but on the current levels of high energy UV and galactic radiation, as these values will affect the stratospheric vortex during the winter.
Win win!
This is absolutely pivotal, warming is an increase in average temperature driven by warmer minimum temperatures. It is NOT hotter, it is LESS cold.
GH gasses moderate extremes, they damp out temperature fluctuations. Therefore life is exposed to LESS extreme temperatures.
CO2 and GW are beneficial to the planet.
0.04% of the atmosphere does not have sufficient mass to do diddly.
The sun heats the surface, the surface heats the air.
The albedo cools the lit side.
The thermal resistance warms the dark.
No atmos and the Earth becomes much like the Moon, 400 K lit, 100 K dark.
That is NOT what RGHE theory says – cause it’s simply flat wrong.
“Thermal resistance warms the darkness.”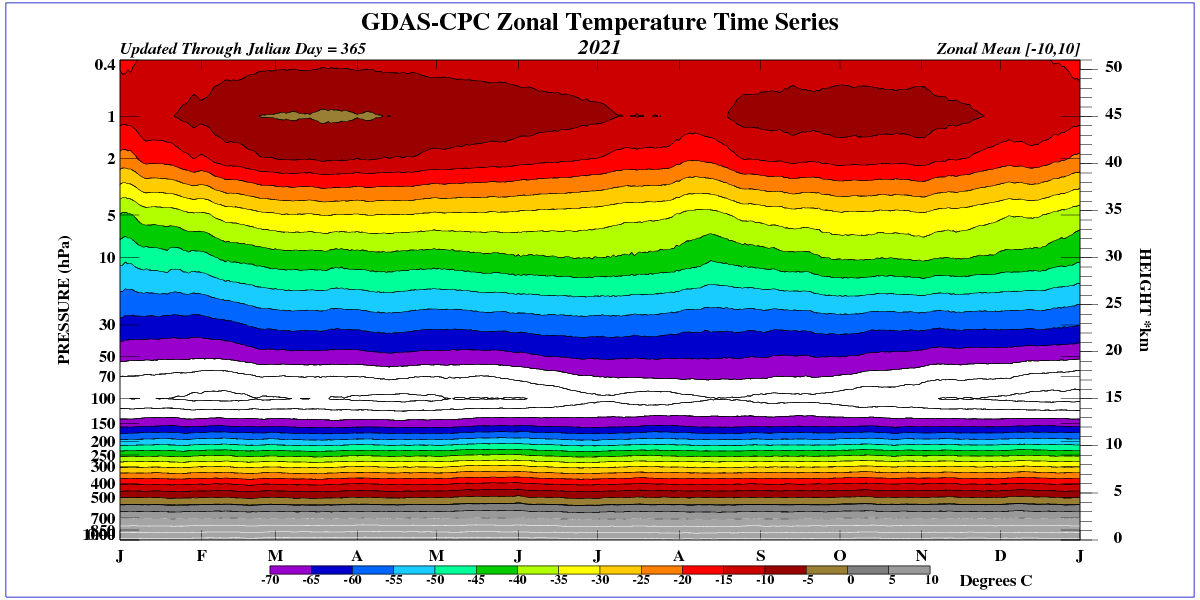
Thermal resistance is nothing more than the vertical temperature gradient in a relatively dense atmosphere. Unfortunately, on planets with atmospheres it only acts up to a level of about 100 hPa, which in the case of Earth reaches a maximum of a dozen kilometers above the equator. Such a thin atmosphere is unable to raise the surface temperature in winter.
http://ds.data.jma.go.jp/tcc/tcc/products/clisys/STRAT/gif/zt_nh.gif
So simply put, Nick.
Extratropics in an odd word to use
As far as I cab tell, it means middle latitudes.
But I would say your charts show
the most warming at higher latitudes of the N.H.
So extrtropics is difficult to understand, and misleading.
Meaning readers must ignore the whole article !
Just kidding, it is a great article, and you make
climate science appear to be simple.
The only thing that tops a Willis article
is when some comments annoy him,
until he blows his top in the comment section !
My nitpicking will hopefully contribute to that
great entertainment.
Mr. E. is among the best writers
at this website, with the best charts.
A Mr. E. mid-2019 chart of warming by latitude,
using HadCRUT and UAH data, for January 1979
through February 2019, needs an update.
Intra, inside. Extra, outside. It is an odd term when used in English, as we have an ‘extra’ already, but it just means ‘outside the tropics’ ie 20-90 degrees.
If anyone thinks that the polar vortex will strengthen, they are sorely mistaken. The ozone blockade in the north of Pacific will strengthen again, which promises a harsh winter in eastern North America.
https://i.ibb.co/SfWNCYw/npst30.webp
Glad to see this I have been telling people this for over a decade. so its gratifying to see WUWT have it. Points the finger at Water Vapor
also has many calming weather effects to numerous to rehash here in the many posts over the years trying to get people to understand this, Maybe now it will get traction
Hi Willis
As it happens, I also investigated this subject, on the Dutch blog.
My colleague in Holland reported warming of the waters around Holland of about 0.03K/annum since 1970.
‘Luctor et non emergo’ – Ik worstel en kom niet meer boven – Climategate Klimaat
Indeed, I see warming of up to 0.07K/annum in the arctic waters
https://arctic.noaa.gov/Report-Card/Report-Card-2017/ArtMID/7798/ArticleID/698/Sea-Surface-Temperature
Carefully analysing these data:
https://www.woodfortrees.org/plot/hadsst3nh/from:1970/to:2022/plot/hadsst3sh/from:1970/to:2022/trend/plot/hadsst3nh/from:1970/to:2022/trend/plot/hadsst3nh/from:2005/to:2013/trend
I get to an average of 0.008K/annum in the waters of oceans in the SH and 0.017K/annum in the NH since 1970.
I am confused as to what happens in Antarctica:

It seems the ice surface is increasing:
https://www.woodfortrees.org/plot/nsidc-seaice-n/from:1970/to:2022/trend/plot/nsidc-seaice-s/from:1970/to:2022/trend
and it is getting cooler, measured a few meters above the ground::
That leaves me in a puzzle as to total ice loss.
Let us assume at least half of the warmth of the SH has arrived at Antarctica, causing some nett loss of ice.
Then we have, from 1970
90: 0.004K/yr
-90 tot 0 : 0.008K/yr
0 tot 90: 0.017K/yr
+53 : 0.03K/yr (NL)
+90: ca. 0.07K/yr (Arctic, most northern)
You see where I am going with this? The heat is coming from the northern waters and slowly expanding to the southern oceans.
Nothing to do with CO2.
Best wishes.
Henry
90: 0.004K/yr
-90 tot 0 : 0.008K/yr
0 tot 90: 0.017K/yr
+53 : 0.03K/yr (NL)
+90: ca. 0.07K/yr (Arctic, most northern)
should be
-90: 0.004K/yr
-90 tot 0: 0.008K/yr
0 tot 90: 0.017K/yr
+53 : 0.03K/yr (NL)
+90: ca. 0.07K/yr (Arctic, most northern)
(I am talking about the warming in K/yr of water versus latitude)
Of course, the alarmists would say this is evidence of warming that will cause a loss of the fragile permafrost. But, an increase of a fraction of a degree when the ground is well below freezing won’t have any impact.
How about going to Yakutsk in Northern Siberia, PaulH, and explaining what you mean to the people there … I am sure they will welcome you with open arms.
Where is the backup for your assertion? Do you spend time in Northern Siberia? Don’t make assertions about things you don’t have direct knowledge of.
Bindidon,
I am guessing you are just trying to be gratuitously insulting to PaulH.
If not, how about going to Yakutsk in Northern Siberia, Bindidon, and explaining what you mean to the people there … I am sure they will welcome you with open arms.
Especially if their village has lost its idiot recently.
Perhaps like Willis, I should ask commentators to quote the exact words of my post. Otherwise, what they say is just background noise. 😉
” But, an increase of a fraction of a degree when the ground is well below freezing won’t have any impact. ”
Was that not 100 % evident, PaulH?
Noise??? Dir you ever view on TV a so-called ‘alarmist’ report about what happense since over a decade in Northern Siberia due to the loss of permafrost there?
May I guess you never did?
” I am guessing you are just trying to be gratuitously insulting to PaulH. ”
YOU, Swenso, speak about insulting?
You, one of the most insulting posters at Roy Spencer’s blog, who calls nearly everybody an idoit?
You are yourself an arrogant twat.
Willis,
I just read some more detailed reports of global trends for October which seem to comply largely with your interpretation. From Ole Humlum, here:
http://www.climate4you.com/Text/Climate4you_October_2021.pdf?fbclid=IwAR04uImwNmVSJjHb8aNN89oNnlH8OBmtLqLzhm5681c2gEYfiPrJzK5jt_A
My reading of it is some warming between the poles and higher latitudes but cooling across most of the ocean areas, where most of the heat is, especially in the tropics, which means the planet is losing surface heat, as it should be now, at peak glacier thaw in most places, as new archeology and the remains of forests dated to 1,000 and 2,000 years ago emerge every day from beneath the ice as evidence of these warmer periods of human history. Who says it is warmer now than in the MWP, RWP and earlier cycles?
For sure not the natural observations of glacial advance and retreat, nor the ice cores, nor the historical observations of human observers of those times. What to believe, the observations or the models?
I don’t see the “unprecedented ” and dangerous heat waves in that data. ANYWHERE!
Another point I can’t understand is that Willis tells us that the following map
and its minima counterpart show exceeding warming, while a quite similar map is visible at UAH for the trends of the lower troposphere for 1979-2021:
Of course: we see when focusing at the Antarctic, that BEST gives 0.21 °C / decade on land whereas UAH shows only 0.09 °C.
That’s a huge difference.
But in many places, the correlation is stronger, especially in the Arctic.
And that though the lower troposphere inspected by UAH should be, with 264 K average absolute temperature, about 4 km about the surface.
Interesting to see that UAH shows Antarctica’s most warming place in its middle part, while most surface series give the Peninsula as the hotspot.
Interesting as well to see, even this is an infinitesimal part of the Globe, that of the 144 topmost cell trends in UAH’s grid (that is a complete latitude band in a 2.5° grid),
and, to my own surprise