Charts by Kirye
Text by Pierre
The October, 2021 mean temperature data are in for Tokyo and its Hachijojima island out in the Pacific – no warming in 30 years!
All the private jet-flying climate doomsday loonies now meeting in Glasgow would all like to have us believe everything is getting hotter and the planet is about to blow up, and so us taxpayers need to use only 1/1000 instead of 1/100 the energy they guzzle as they practice their gross policy incompetence.
They also want us to cough up a lot more tax dollars for their nutty schemes. We really ought to be getting a much better deal for the trillions in tax dollars we’re paying annually. The job performance of our leaders has been crap since the Iron Curtain fell, we could easily and convincingly argue.
They’re supposed to be serving us, and not trying to put us in servitude. The claim they’re trying to serve us? It’s bullshit.
Tokyo
Here’s the latest plot of October mean temperatures for Tokyo since 1990.
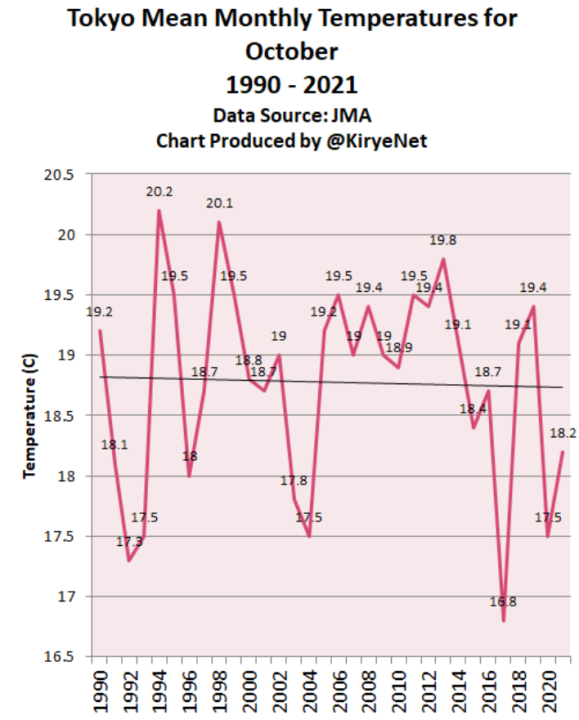
Data: JMA.
Over the past 30 years, October temperature in Tokyo has been declining moderately. Not even the city’s massive urban heat island effect is able to keep autumn from starting earlier than previously.
Hachijojima
Moving away from the urban heat island of Tokyo and over to the relatively rural Pacific island of Hachijojima, some 275 km off the Japan mainland, we plot the latest October data going back to 1987:
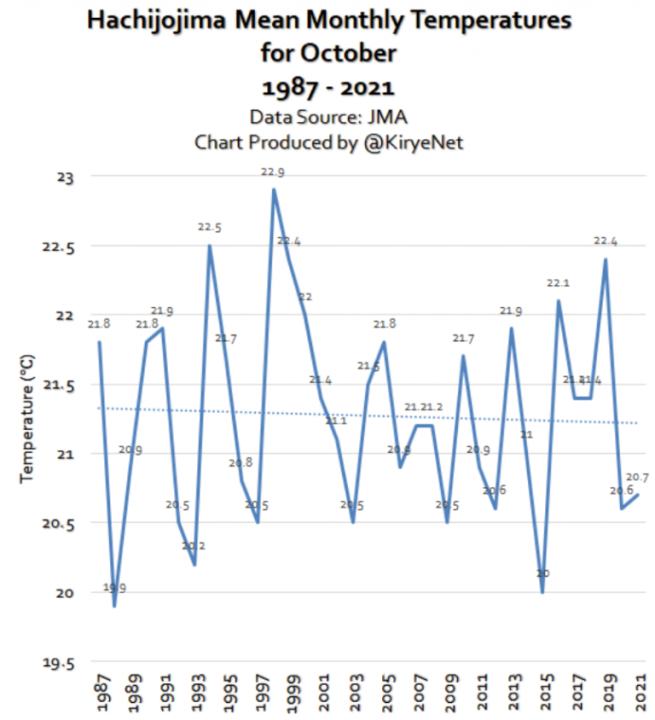
Data: JMA
Here as well there has not been any warming for the month of October since 1987, according to the data from the Japan Meteorological Agency (JMA)
Sapporo
Over at the site of the European Institute for Climate and Energy (EIKE) in Germany, Stefan Kämpfe plotted the October data for Sapporo, Japan:
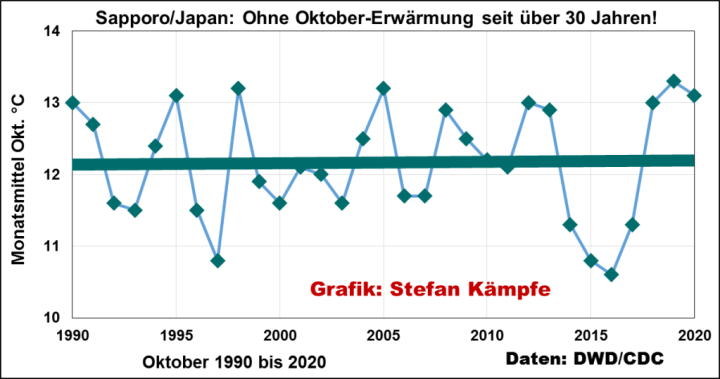
Data source: German DWD national weather service
Here we see there’s been no warming in October in 30 years. The data for October, 2021, are still pending.
Of course, there are many other places across the globe where the story is the same: Other than the usual natural variability, nothing unusual is happening climatically.
Never mind this cherrypicking…
‘The heatwaves and wildfires that caused devastation in Europe this summer would not have happened without global heating, new analysis shows.
The summer of 2021 was the hottest on record in the continent, with average temperatures about 1C above normal. The elevated heat caused wildfires and premature deaths.
Researchers have calculated how much more likely the climate crisis made the high temperatures. For almost all of the past 150 years, the expected frequency of a European summer as hot as 2021 was no higher than once every 10,000 years.
But since the 1990s, as carbon emissions continued to soar, the expected frequency has rocketed to reach once every three years.’
Europe’s record summer ‘impossible’ without global heating | Climate crisis | The Guardian
Griff, mate, Europe is not the globe.
Who’s cherry-picking now?
Redge
” Europe is not the globe. ”
You are right.
But why don’t you say: Tokyo is even less?
Global average temperatures is a bullshit term used to pull the wool over the eyes of gullible fools.
Temperatures are measured locally on a daily basis and vary throughout the year. I can accept an average daily or monthly temperature for a single location.
Temperatures should not be measured globally on a yearly basis to “prove” we’re all going to die
Global temperatures, average or otherwise, are irrelevant
Tell that to the UAH fans, not to me.
Temperatures are sparsely measured, frequently adjusted/infilled.
There are many conflicts in alleged global averages and anomalies that prove temperatures should not be measured or averaged globally on a yearly basis.
Slight suggestions.
Ah, but, if the oceans are warming, it is logical that Japan would also warm. And it is not.
Charles Higley
Why should Japan warm just because the oceans are warming on average?
Paraphrasing you, one could then write:
” Ah, but, if the oceans are warming, it is logical that Antarctica would also warm. And it is not. ”
I suggest that you start thinking about the difference between global and local, by very first looking at Roy Spencer’s latitudinal and regional data:
http://vortex.nsstc.uah.edu/data/msu/v6.0/tlt/uahncdc_lt_6.0.txt
Maybe you look at the columns “NoPol ocean” and “SoPol ocean” and compare them?
The oceans have only warmed by 0.003C, even if all the nonsense is correct.
Are you that clueless, or purposely lying?
Japan is an narrow Island nation strongly affected by sea temperatures. Antarctica is isolated from sea temperatures, except the small area of the peninsula.
False analogy fallacy. Japan and Antarctica have nothing in common.
Well, Japan and Antarctica do have one thing in common: They are both currently cooling. 🙂
Sigh, Pierre never said anything about global at all, he talked about two cities in temperature detail.
It is YOU and Griff who whines about a simple well supported observation, of which you have no argument against at all.
It’s only cherry picking when skeptics do it.
It’s called SCIENCE when a climate scientist does it.
It’s called SEANCE when a climate scientist does it.
You’re welcome 😉
More lies from the lie spewing liar.
Never mind this cherrypicking…
___________________________
Rather than picking just one city and island and just one month, and while you’re at the issue of how warm did it get, then actually look at the data that says how warm how warm it got. So look at a larger area that has good data, the USA 48 is a large area and the warmer months of the year tell a story. Here’s what that looks like:
For many of the states in that map the May-October cooling extends back to the 19th century. Is looking at the maximum temperatures and the months that they would be the greatest a cherry pick? It paints a more accurate picture than the fuzzy image produced with average temperature.
A favorite quote:
Beware of averages. The average person has one breast and one testicle. Dixie Lee Ray
That chart is four years old. Here’s a quick and dirty from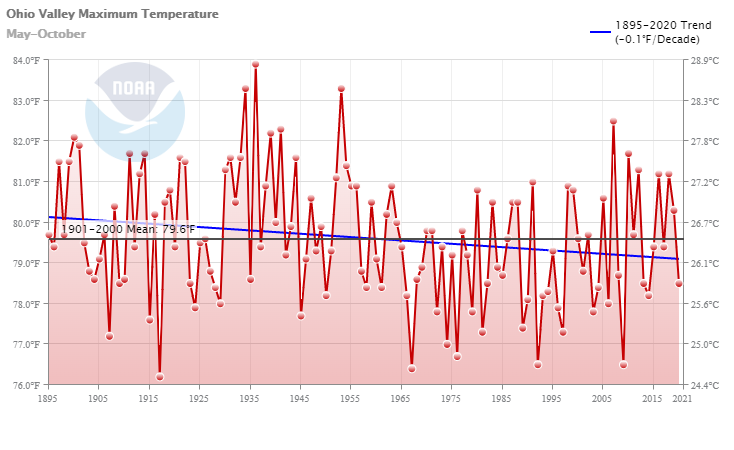
https://www.ncdc.noaa.gov/cag/regional/time-series
that shows the Ohio Valley Max Temps May-Oct trend since 1895:
Grrrrrrr! My quick & dirty update is waiting for approval
Don’t mind! Mine is too…
Steve Case
Like Redge said: CONUS is not the Globe!
Et moi, j’ajoute: Ohio Valley is, like Tokyo, even much less.
Btw, Steve: what about publishing the same Ohio Valley graph for the minima?
But… less cooling isn’t warming you sure will say, n’est-ce pas?
The world has warmed up since the end of the Little Ice Age.
Rational people celebrate that.
How does that contribute to more forest fires in the middle of the summer?
That’s right, night time temperatures are increasing just like the IPCC says. Winters temperatures and the higher latitudes are on the increase in temperature as well. Here’s the quote from the IPCC:
IPCC AR4 Chapter 10 Page 750
Temperature Extremes
It is very likely that heat waves will be more intense, more frequent and longer lasting in a future warmer climate. Cold episodes are projected to decrease significantly in a future warmer climate. Almost everywhere, daily minimum temperatures are projected to increase faster than daily maximum temperatures, leading to a decrease in diurnal temperature range. Decreases in frost days are projected to occur almost everywhere in the middle and high latitudes, with a comparable increase in growing season length.
____________________________________________________
So, Almost everywhere, there’s a decrease in diurnal temperature range. That isn’t a recipe for the extreme storms the Climate Crusaders are always telling us about. Isn’t that so?
I don’t regard fewer days below freezing and an increase in the length of the growing seasons an Existential Crisis. Do you?
By the way, the increase in CO2 is causing a well documented increase in the greenery and food production. You can Google these two titles from NOAA and NASA:
“NOAA Satellite Data Used in Study Finding Significant Greening in Earth’s Vegetative Areas”
“Carbon Dioxide Fertilization Greening Earth, Study Finds”
And sea level is going up at about the same rate as it was 200 years ago when tide gauge records first began to be recorded.
And beside that, the polar bear population hasn’t decreased for the last 15 years.
More: If you do follow the link to that IPCC Chapter & Page, you will find that “Globally averaged mean water vapour, evaporation and precipitation are projected to increase.” Which throws water on the droughts the Climate crusaders are always going on about.
The “Climate Crisis” is false on its face but anyone who brings the foregoing points up has to deal with the cancel culture:
The “globe” is unimportant because there is no such thing as a global climate. Climate is a local condition. That is why “climate change” is an equivocal term … utterly meaningless. The entire “climate change” narrative is so much bafflegab intended to pervert science into saleable sound-bights for those with limited intellect and even less knowledge.
So you think the growing season starting sooner and lasting longer is a bad thing. Should we be spending trillions of dollars to go back to shorter growing seasons and smaller harvests?
Not even 1deg C in a century for the minima, and you find it worth mentioning
So how does the minimum going up but not the maximum contribute to the earth turning into a cinder? If the earth is not going to turn into a cinder then why all the fear-mongering?
Is it “Code Red for Humanity” because the highs are lower, and the lows are higher?? I call it a Win for Humanity!
Growing season longer – win!
Earth about 20% greener – win!
Plants needing less water because more CO2 – win!
Crop yields ever higher and higher – win!
And the sources of that alleged global warming?
Sparse polar temperature sensors that frequently fail to submit data causing the various government agencies to happily infill temperatures swaged from other temperature sensors up to 1200 kilometers distant.
Then your horrendously misleading graphic magnifies a miniscule range of anomalies to make small differences appear alarming. All image fakery.
Then there is the fact that you use a graphic that combines multiple temperature sensor readings from 1895 to present.
Steve Case
” Beware of averages. The average person has one breast and one testicle. Dixie Lee Ray ”
Well, I personally have nothing against them.
Here is a chart I made during the last spring:
And this, though restricted to CONUS+AK, is a comparison of averages too:
What do you want to do with single USCRN stations, Steve? Comparing them with the UAH grid cells encompassing them?
Strawman loaded questions.
Thanks for the simple-minded answer, Steve Case.
Recognizing when someone is making a strawman argument or posing a loaded question is a useful skill.
Do these tell you which is increasing, Tmax or Tmin? What are the variance and standard deviation of your average (mean) for the temperature distribution you have used? If I tell you that I have an average of 83, what does that tell you without knowing the statistical parameters that go with it? Was the distribution normal or was it skewed?
Jim Gorman
Jesus, man.
It is no problem at all for me to generate graphs comparing TMIN and TMAX.
It is, where it is possible, no problem for me to compare TMIN, TMAX, the median and the full average of hourly data.
I did no more than to show how near to eachanother averages of surface and lower troposphere can be, and what do you do?
You misuse, as usal, my comment to show off with your self-centered meaning.
He didn’t ask if you can graph minimums and maximums. He asked if you can calculate each of those from the average. If you can’t then the average is useless for making policy decisions about anything!
You may call it misuse but it is not. As I have worked with these temps I have grown weary of people quoting averages without also giving the statistical parameters associated with a mean. Even Tavg for a single day has a mean and a variance that describes how well the mean describes the distribution. It is totally unscientific to only calculate a mean of means of means and totally ignore the variance.
Look at the Tokyo graph. It is based on real temps and not anomalies. You can SEE the daily variance. Do you think that variance just disappears when you calculate an anomaly and then average that anomaly with others?
Your graphs are based on anomalies which hides the variance that goes on. Why do you and others propagandize graphs that makes the rise look enormous? Tell us what the variance is from daily temps all the way through to your anomalies.
Here is a paper on combining populations (stations) and computing the overall variance. I suspect you and many, many others never even consider this, you just add the data and divide in a simple spreadsheet formula.
https://core.ac.uk/download/pdf/326020336.pdf
There are many other references on the internet for “calculating variance when combining populations”. However, they basically say that variance adds when you combine populations into one, i.e., start taking averages of different stations added together.
“Look at the Tokyo graph. It is based on real temps and not anomalies. You can SEE the daily variance.”
It’s a graph of monthly mean averages. Where do you SEE the daily variance in it?
Duh, I attempted to demonstrate this to you previously, and you dismissed it without a thought.
Sorry, I must have forgotten it. Can you refresh my memoey, where does the daily variance appear in the graph?
“Here is a paper on combining populations (stations) and computing the overall variance.”
It’s about combining samples of the same population. But the formula is the same apart from Bessel’s correction.
“There are many other references on the internet for “calculating variance when combining populations”. However, they basically say that variance adds when you combine populations into one”
I went through this with Tim last month. Combining populations does not simple add the variance. It will depend on the means and sizes of the different populations.
In the example in your paper the variances are 2 and 71.04, and the combined variance is 125.33.
Here’s another example
https://www.emathzone.com/tutorials/basic-statistics/combined-variance.html
There combining two populations with variances of 81 and 36, gives a combined variance of 81.
So you reject the entire premise of this article; that Tokyo temperatures haven’t changed in 30 years, because Kirye only uses mean temperatures?
Who says the temperatures haven’t changed? The MEAN hasn’t changed. That could easily be because min temps went up the same amount max temps went down. Same mean!
How do you tell? If either min temps went up or max temps went up the mean would go up also. If both went up the mean would go up also.
But the mean didn’t go up so none of those scenarios happened. Either max/min temps stayed the same or max temps went down while min temps went up. Do either of those scenarios represent a reality that supports fear-mongering that the Earth is going to turn into a cinder?
It’s this article that says temperatures haven’t changed. “Tokyo Hasn’t Seen Any Warming In October In 30 Years”.
Maybe ma or min has warmed, but the article avoids asking these questions, just as it avoids looking at any station that might show mean warming, just as it avoids questioning how much the station move might have biased the result.
What is so scary about half a Celsius degree over the past 40 years??
And it’s barely nothing over the 1940-2020 time frame.
I have to put up with a -20 to +35 °C range over one year – why are there people soiling themselves about a couple or even a few degrees per century – especially if the equator will hardly be affected and it’s mostly the frozen North that will be driving up the average – if the computer models are worth even 10% of what they cost.
I cancelled my Telegraph subscription because in contradiction of their own complaints procedure they have not responded to my complaints and to make their bias more explicit whenever I use observed data numbers and facts to contradict and repudiate the nonsense trotted out by the demented green fringe in comments my comments are deleted immediately but they still expect me to subscribe to fuel their absurd betrayal of science.
I have written to Boris Johnson and commented directly Contact Number 10 (no10.gov.uk) on his absurd confected adoration of Attenborough Prince Charles and Lord Debens inane beliefs that Co2 poses a threat to the planet, as if. I told Boris that unless he listened to me then he would get no further donations but I received another begging letter. I phoned Conservative HQ and asked why would Boris expect anyone with half a brain to donate cash for the re election of someone who believes Co2 poses the same mass extinction threat as the 9 mile wide asteroid that hit the Yucatan peninsula 66 million years ago? The response I got was “well its only logical that Co2 poses an existential threat isn’t it” and the phone was slammed down in disgust.
So I decided to confront the issue again directly with Boris at contact no10 and having clicked send got the message “you have been blocked”. This is typical behaviour from the freaks who for some absurd reason believe estimated 0.85C of warming since 1880 – BBC Climate Change by Numbers, 95% based on proxy data from mud and ice core samples crustaceans and tree rings – poses an existential threat “to the planet” or that wild fires can be directly related to a supposed 1C of warming now when observed data shows in America they were five times worse a century ago, painfully stupid. Cherry picked?
A Short history of environmental madness: Desrochers, Pierre. (Population Bombed!): Exploding the Link Between Overpopulation and Climate Change . as a response to overpopulation.’75 Confucius (551–479 BC) and some of his followers argued that excessive population growth may reduce output per worker, lower standards of living and create strife.76 Some ancient Indian writings similarly showed ‘profound appreciation of the problems of food and populations’77 while Plato (427–347 BC) warned that ‘exceed[ing] the limit of necessity’ and the ‘unlimited accumulation of wealth’ would trigger expansionary wars, especially in light of the populace’s fondness for meat, which would result in struggles over pastureland. Interestingly, his solution was a vegetarian diet.78 Writing half a millennium later, the Carthaginian Christian theologian Tertullian observed that: [What] most frequently meets our view (and occasions complaint), is our teeming population: our numbers are burdensome to the world, which can hardly supply us from its natural elements; our wants grow more and more keen, and our complaints more bitter in all mouths, while Nature fails in affording us her usual sustenance. In very deed, pestilence, and famine, and wars, and earthquakes have to be regarded as a remedy for nations, as the means of pruning the luxuriance of the human race…79 Over a century and a half later, another important figure in the early Church, Saint Jerome, commented that ‘the world is…full, and the population is too large for the soil,’80 a problem he believed best addressed through the creation of monasteries. The first true population catastrophist theorist is generally acknowledged to be the Italian Giovanni Botero (1540–1617) who, two centuries before another lapsed Catholic cleric, Giammaria Ortes (1713–1790) and the better-known Malthus, argued that human population would increase to the maximum extent permitted by human fertility, that the means of subsistence wouldn’t keep up, and that the unavoidable result would be poverty, starvation, war, diseases and population crashes.81 For his part, Malthus is best remembered for arguing in the first edition of his essay that, in a world where food production grows arithmetically and population – when unrestrained – grows geometrically, mass want and population crashes are unavoidable.82 “As early as 1864 George Perkins Marsh, sometimes said to be the father of American ecology, warned that the earth was ‘fast becoming an unfit home for its “noblest inhabitant,”’ and that unless men changed their ways it would be reduced ‘to such a condition of impoverished productiveness, of shattered surface, of climatic excess, as to threaten the deprivation, barbarism, and perhaps even extinction of the species.’” —MIT professor Leo Marx..
1C? Please provide PROOF that that amount of change causes anything.
How does such a small change cause widespread drying out of plants to the point where they will burn uncontrollably?
And who has data that is accurate to +/- 1C for 10,000 years? Heck, I bet the thermometers of a few hundred years ago weren’t even that accurate.
Get me to 5C +/- and I’ll start believing you have something to report.
“1C? Please provide PROOF that that amount of change causes anything.”
Here in California, it appears to have made arsonists loonier and more prevalent.
griff, by the way, a big thank you to yourself and your fellow countrymen (and women, etc) for your sacrifices in destroying your once beautiful countryside to stabilise the climate. We have the effects of you impacting the California drought already. Since your tribe is well beyond the intelligence of normal scientists, and you can do it without even using calculators, I have a favour to ask. Do you think you could just have it rain during the week, and not on weekends?
philincalifornia,
Praising the griffter for his sacrifices to the climate gods is like praising ants or termites for their sacrifices to the colony queen! Actually, the social insects have a better case to be made for the logic of their attempts to survive! There is no rational thought behind the alarmist Climageddon hoax; just a guilt laden belief that humanity is irredeemably sinful!
Useful idiots like the griffter try to blame CO2 for all weather and climate related matters, while ignoring the sun and ocean cycles! That is like only being concerned about the stubbed toe of an accident victim with multiple injuries including a compound fracture!
Most alarmists don’t have the cognitive abilities to discern the view from 100,000 feet or years! They can only repeat what they are told to think, and push the officially approved agenda! CO2 is all powerful, the “vaccines” are completely safe and effective, and there was no election fraud in 2020!
Now it’s even Global Heating, wow, aren’t you exaggerating ?? 😀
If you look into data for the respective regions, you won’t even find a moderate warming, so, what will you tell us ???
griff, instead of parroting the Guardian’s fantasies why not do something socially useful like persuade them to pay their taxes?
As you are well aware they had to change from the Scott Trust into the Scott Trust Limited just before the first Autotrader sale. And after the second sale they had made a profit of over £1 billion and they paid £0 in tax
Then the paper was built on the proceeds of the slave trade.
You have some jolly warped values, mate.
This year has been far cooler than last year – a fact easily seen in the reaction of primary production.
Your collander like theory cannot explain that, so you decide to misinform people.
It wasn’t a record summer, that nonsense is for the gullible and FLOP26
But since the 1990s, as carbon emissions continued to soar, the expected frequency has rocketed to reach once every three years.’
If you will be so kind to have a look at the CO2 date you will realise, that human contribution to CO2 is very small, and even reaching zero CO2, the increase will not stop, may be with a very small probability the increase will slow down, so the effect will be near zero.
Does it worth billions of money of what ever currency ?
Imagine the possible effect, it will continue to rain, to burn, what ever, but eventually three days later 😀 😀
“….would not have happened without global heating, new analysis shows….”. Such analysis is ridiculous and easily manipulated into valid-looking graphs….no different than comparing sea level rise to the number of swimmer drownings….the missing parameter of number of beachgoers not mentioned and the duration cherry-picked…..
What Has caused this “global heating”? If you were keeping up you would know it is global ocean cycles affecting the cloud cover (Loeb et al 2021), due to an almost 2% reduction in cloud cover during the 21st century. We now know the energy that caused this warming came from increased “absorbed solar energy” and there is no evidence of any warming from greenhouse gases.
Please explain how humans will control this perfectly natural climate mechanism.
The Guardian is not to be trusted…I refuse to read anything from their biased twisted coverage. Fake News.
For wildfires, the first thing to look at is forest management. In the US West, they have caused their hot and large wildfires through egregiously bad forest management and fire suppression, which allowed decades of underbrush and fuel to accumulate. Then, only then, can one look for other causes. Do not forget that the US forests also suffer from arsonist activists who set many fires.
Speaking of cherry picking here comes griff.
The mere fact that similar heat waves have been happening in Europe for at least as far back as records have been maintained, and from the proxies, much longer, doesn’t matter to the alarmists.
The fact that something was different from last year is enough to prove that CO2 is the master gas and we are all going to die.
Speaking of cherry picking, you seem to have a lot of experience with it. I’ve never known you to do a personal analysis of any claims, pro or con.
For example, it is commonly accepted that the global average temperature is increasing about 1 deg C per century. Yet, your sources suggest that a 1 deg C average for the European Summer, which was at best only 0.1 deg C warmer than 2010 and 2018 [with unstated uncertainties], is a 1 in 10,000-year event. Essentially 3 equivalent events in a decade and someone claims it is a 1:10000 event! What’s wrong with this picture? Perhaps you could explain and not just copy and paste things that you find supportive of your world view.
And an increase of 0.1 deg C over 2010 and 2018 causes unprecedented wildfires? It should be obvious that average temperatures are not a good predictor for fires. Was it instead a heatwave? That is weather, not climate. The last time a comparable weather pattern occurred was in 1977, when CO2 and any supposed warming associated with it was much lower.
Yes, cherry picking you do well.
Clyde,
The griffter HAS TO cherry pick; his oversized blinkers prevent him from ever seeing the larger picture! Most alarmists sound as if they have had the full humorectomy, as well as blinkers and earbuds surgically implanted!
Thus they can’t see anything other than what is placed in front of their face, or hear anything besides what their programmers whisper into their ears! There may also be ball gags involved, but I decided against looking any deeper at that point!
Your reading skills needs some work since all he stated was THIS:
He ends with these words:
That was it, nothing about global cooling claims at all.
He makes a simple point that there are areas in the world that hasn’t been warming for many years.
Wrong so many ways. Globally fires are decreasing over past century. Fires are caused by fuel, ignition and drying. They are not ignited by hotter days and if warming increases precipitation there will be fewer, not more fires. The CAGW theory has increasing atmospheric humidity built in as an assumed feedback. Saying the fires couldn’t have happened without global heating denies what we already now from history. None of this will convince you I know but had to say it.
Believe the Guardian and next you’ll believe the BBC.
Sorry Griffy, you’re crying wolf over nothing far too often now. I’m not really interested in your public airing of your personal shortcomings so I’ll just let you ramble on about some non-existent blah, blah, blah until you realise how much of your life you’ve wasted on nothing whatsoever.
The a guardian? Lol. Talk about cherry picking
New “analysis” is full of shit – if the world is cooler now than it was 1000, 2000, 3500, and certainly 8000 years ago, how does the gentle warming over the past 300 years, from the cold depths of the Little Ice Age, have anything to do with humanity use of vital fuels?
Guardian!?
The Guardian is not a source for honest news. For advocacy, extremism, anti-establishment vitriol false news source?
🤣 🤣
And what does the Guardian say?
In spite of their extremist anti-CO₂ hatred, what the Guardian has identified is that every portion of their statement is whining about weather. Weather events repeated for hundreds of years.
Guardian determines weather events are “impossible”? Riiigghhtt. 😂😂
Show me a video of climate change starting a fire.
Waiting………………………….
Liar.
You climate cluckers are experts at cherry-picking…always pointing to some bad weather somewhere in the world as evidence for GW.
Whenever there is a hurricane its “See! See!, we told you that GW is true. Were doomed! doomed!”
I live in Tokyo and we have had the coolest summer on record…So obviously you cluckers are full of shit.
Here should be an easy one for you…Please tell us what the ideal temperature of the planet should be…is it 72 degrees? 74.475 degrees? 98.6? What? Give us a number.
COP 26 just ended…China and India won’t commit to CO2 emission reductions.These two countries are interested in pulling their populations out of poverty, not in satisfying Western eco-freaks. They will continue to build fossil fuel power plants. COP 27 will be the same thing, no progress toward CO2 reduction agreements and therefore COP 27 will be another failure. Pick any year in the future you want COP will be a failure. I will say however, that there is a place for Wind Mills in today’s world, in a land fill.
The interesting thing about global warming (as many have commented) is that it is not always global.
The biggest fallacy being perpetuated by he warmunists is that there is such a thing as a global climate. “Climate change” is a logical fallacy all by itself. So, what they are selling is the fallacy of a “consensus” telling us to be afraid of a non existent “global” climate based on failed models, adulterated data and weak conjecture.
But the latest UAH reading for October was a bit of a disappointment to this climate obsessive who is aching for the La Niña crash to below the 30 year mean.
Actual La Niña temps will be seen in UAH date a month or two later.
What ? warmest October on record ?!
The CET shows it to be 12th warmest October in the last 60 years.
Big deal !
Are they burning up in Glasgow? In August there was one.
https://www.thescottishsun.co.uk/news/scottish-news/7503091/glasgow-park-pollok-police-human-remains/
Who’s claimed it was the warmest October on record? UAH only shows it to be the 3rd warmest.
As far as CET is concerned, October has been the slowest warming month over the last 60 years, but it’s still warming at a statistically insignificant rate of 0.14°C / decade.
Graph of October CET since 1960.
Just what is the gray area supposed to represent? 1 sigma? If so, then it would appear that there was a 4 sigma October cooling event about 1992.
The Empirical Rule suggests that the standard deviation (SD) should be about +/- range/6. That is, for your graph, the SD should be about (13.2 – 7.8)/6 = 0.9 The gray area is about twice that. Just what are you showing us?
It’s the 95% confidence interval, but not taking into account auto-correlation so I wouldn’t take it too literally.
“…there was a 4 sigma October cooling event about 1992.”
It’s the confidence interval, not the prediction interval. It should be clear there’s a lot of variance in the monthly temperatures.
“…..but not taking into account auto-correlation so I wouldn’t take it too literally.”
You’re selling yourself short. Auto-correlation would tighten those bands.
Pretty sure it is just the hyperbolic confidence envelope for t = 0.05.
Bellman.
“warming at a statistically insignificant rate”
means
‘no discernible rise in temperature’.
Putting numbers to no discernible change is meaningless and dishonest.
Richard
No it doesn’t. It means there is insufficient evidence to say with a degree of certainty that the observed warming might not have happened by chance.
The warming rate is 0.14°C / decade, meaning in 60 years the temperature is on average about 0.8°C warmer, but this might just be caused by the random occurrence of more warmer Octobers in recent years. It could also be that the true trend is much larger, but masked by randomly cooler months.
This is the problem of looking at just one calendar month from a very changeable part of the world. If you look at annual averages from 1960 to 2020, the trend is a statistically significant 0.22°C / decade.
Is it really? You should know that quoting a mean implies that you have a distribution of temperature. What are the statistical parameters associated with that distribution? Variance, standard deviation, skewness, kurtosis? A simple excel command will give you these along with the mean.
Completely irrelevant. The statement was about the rise in annual mean CET temperatures.
Granted I’m only using a simple test for significance, not taking into account and if you’d like to show your workings to demonstrate the warming was not statistically significant, I’m not stopping you.
I don’t need to. You are refusing to do what real scientific researchers must do when combining populations and that is propagate variance through the calculation. I suspect you have never even payed attention to variance or what it means.
It is not up to me to show what your variance should be, it is up to you. If the reference you choose doesn’t show it, perhaps you should question why they don’t. If you are using your own averages, then it is incumbent on you to provide the calculations.
Averages (means) with no statistical parameters are truly meaningless. There is no way to determine how well the mean represents the distribution of data.
Doing simple averages of numbers is something learned in grade school. Doing statistical analysis requires much more.
Of course you don’t need to show why you think the trend is not significant, anymore than I have to take your unsupported allegations seriously.
I’m not doing scientific work, any more than the authors of this article are. I’m just pointing out what the data, in this case CET, shows and I’m only doing that in response to Vuk who was making a claim about the same data.
I’ve no idea what variance you are talking about in the rest of the comment or why you think it’s relevant to the confidence interval of a linear regression. I get the feeling you don’t either which is why you insist you don’t have to do show your workings.
DYOFHW.
I have done, and I say the trend is significant.
Where is your formal uncertainty analysis that starts with the raw satellite telemetry?
CET has nothing to do with satellites. There were no satellites in the 17th century.
Non sequitur, you know what I’m referring to and chose instead to throw up a smokescreen to cover your ignorance.
Anthropogenic warming or the recovery from LIA ?
‘you pays your money and you takes your choice’
Vuk,
The Little Ice Age, when rivers froze and peasants starved from crop failure, is the gold standard for alarmists!
Apparently they, like most Marxists, enjoy seeing poor people starve; and ice skating!
Hmmm … choosing one place and one month as an illustration of ‘no warming’ is not going to carry much weight at all.
UAH satellite data for similar period does show a smallish but definite warming of the globe during similar period. Are we now going to say we don’t accept UAH figures, which have been of some support to sceptics in the past?
We have to wean ourselves away from this kind of example, unless it is put in proper context. There are better examples and better arguments.
We don’t live in averages and they are averages because some places are cooler, such as areas of Japan, and others are warmer.
Well,the interesting thing is that Tokyo is a megaheatisland,therefore one should expect a constant increase in temperatures,no matter which month.
But i would have chosen something else for Tokyo.
If i remember correctly until a few centuries ago significant parts of Tokyo used to be under water.
One should assume that the sea would have taken back those parts ,but just as in Holland,nothing happens.
Quote:”warming of the globe”
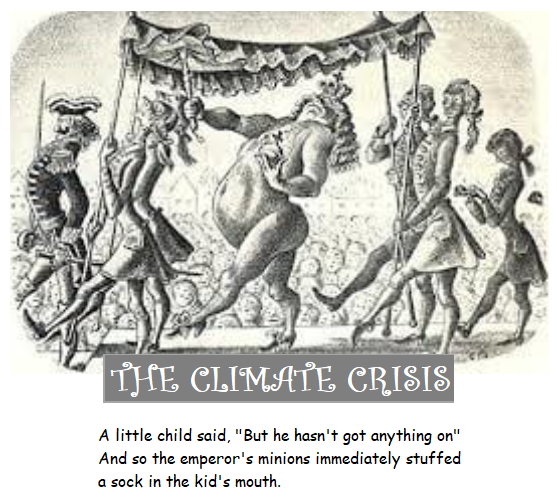
Can I be the little boy at the Emperor’s parade and ask:
What is ‘globe’
Spencer from UAH goes out of his way to clarify that he is recording the temperature of the air.
Just The Air.
The very fact that the UK not least has such variable weather is because warm air, heated by land, sea or plants many thousands of miles away makes it that way and that is what Spencer’s Sputniks are measuring.
By example: Just because Spencer says there is a lot of traffic on the motorways of any given country – does that mean all the cities, streets and car-parks of that country are permanently grid-locked?
Because that is the assumption you, and many others even around here, are making.
I got that analogy, believe or not, from Zinc and its role in the human immune system. Presently under a lot of stress but whator who ins’t these days? Boris knows the answer – equal measure of Pinot-Grigio and pasta
Becase Zinc is reclusive stuff and ‘hides’ inside all of our cells until it is needed (or until alcohol, seriously, washes it away)
It is thus very difficult to measure or assess anyone’s Zinc status, especially via blood test.
That is what Spencer’s Sputniks do = test the blood
That motorway analogy is quite good even if I say so myself..
Because the cars in there equate to energy
And, just like energy, there are only ‘so many’ of them
Thus, if they are all ‘out on the motorway‘ they are thus NOT staying at home in the cities, streets and car-parks
But where cars and energy differ, is that energy can only go one way.
The cars can go home.
The energy can not ‘go home‘ – it can only go, as per the 2nd Law, to A Colder Place
As regards energy in the Troposphere that leaves the Stratosphere as the only place it can go
geddit
It’s what I keep raving about= A warming atmosphere is a cooling Earth
Thus what Spencer is recording is actually The Cooling Of Planet Earth – he is counting the Joules as they ‘leave the premises’
neat huh
Good job ‘air’ has such low heat capacity innit?
yet another edit PS
When I get home and onto my other lappy, am gonna post my Excel of the Manchester UK city-centre weather station – 20 years of continuous cooling
Not just a little bit of cooling either
Manchester is getting cold – watch this space
Unless all places are exactly the same, then a mean implies that there is a distribution associated with it. If some place has no warming or even cooling, then somewhere else must have twice as much warming to achieve the average. Accepting a 1 degree average change over whatever time frame means that if Tokyo has no warming, then somewhere else must have 2 degrees of warming over that same time frame. Where is that? The only other option is if the entire distribution is totally skewed toward higher temps which should be even more apparent.
The apparent decrease in specific humidity at the top of the troposphere (300 hPa) since 2000 primarily signifies the strong influence of decreasing solar activity on wind strength in the tropics (20N – 20S). Especially during the La Nina period, this will cause a decrease in water vapor in the mid-latitudes. Therefore, it is now important to focus on seasonal temperatures because in summer the presence of water vapor decreases surface temperature and in winter it increases. A stationary high over the Grand Prairies in summer will cause record heat and a similar high in winter will cause record low temperatures. This is exactly what will happen this winter. The slowing of jet currents during periods of very low solar activity is already evident in the stratosphere.


Therefore, global temperature over the next few decades will have little to do with weather.
The sun’s magnetic activity is very low, as evidenced by the level of high energy UV radiation that produces ozone from oxygen. This already has consequences in the circulation in the stratosphere, where ozone due to its higher temperature affects the circulation in the stratosphere similarly to water vapor in the troposphere. The difference is that, being a heavier gas than air, it sinks rather than rises as water vapor does in the troposphere.
Figure 4. Comparison of UV solar activity in the three most recent solar cycles (SC) 22-24. The thick curves show the Mg II index timeseries twice smoothed with a 55-day boxcar. Dates of minima of solar cycles (YYYYMMDD) were determined from the smoothed Mg II index.
The Wilcox Solar Observatory’s solar dipole plot shows a steady decline in the Sun’s magnetic activity.
Quote:”A stationary high over the Grand Prairies in summer will cause record heat and a similar high in winter will cause record low temperatures. This is exactly what will happen this winter.”
Nice try but no – It is exactly what happens in deserts.
If there was perennial greenery on the ground and perennial ‘blackery’ (water-retetentive organic matter) in the ground, the stationary high would not have happened
It is what I learned at age 15 in school nearly 50 years ago.
What’s changed
What about the Burmuda High?
In Oklahoma, we have greenery on the ground every year, but we still get persistent high-pressure systems hovering over us for long enough to dry us out seriously, and heat us up seriously.
In 2011-2012 we had persistent highs that wouldn’t go away for months. When it began, the land was green, but after a few months it was dry as a desert.
I see no evidence that greenery prevents persistent high-pressure systems from establishing themselves over an area.
Plasma Climate Forcing | Vortex and Jet Streams

The mainstream media will not report the no warming in 30 years events. They, in support of the CAGW/Socialist crowd, utilize both the Texas Sharpshooter Syndrome and the Goldilocks Fable: somewhere it is too hot, somewhere it is too cold, and somewhere it is just right…run with the too hot story!
They can perceive the warming (h/t nyolci) in Glasgow as the temperature rises from 0C to 9C They can then experience cooling as it goes back down to 0C
9 degrees of warming and cooling and all in a single day!
They won’t realise it indoor.
… and they are having good laugh about it, since any cost to them is a pittance but not to the rest of us.

HRH: I told them that time had quite literally run out.
BoJo: I told them it’s one minute to midnight on that doomsday clock.
Actually, it is 100 seconds. Closer to two minutes than one minute. It is the same as last year, when it was advanced from two minutes.
Nobody is dying from Global warming™.
In Scotland in 2020 there were 1,339 drug-related deaths, a 5% increase on the previous year and the largest number ever recorded.
Apparently it’s easier to fix the climate.
+1000
CB- You probably just set some climate zombie to work. Next trend in climate madness will be proving how drug deaths are caused by climate chaos.
Sun Controls Climate | Part 1 – Upper Atmosphere – YouTube
Interesting.
Thank you. I used the information above.
Somewhere hasn’t warmed. So what?
Somewhere has warmed. So what?
This may have policy implications for the need to prepare to adapt to what happens rather than mitigate – seek weather control.
But it says nothing about AGW.
Nothing can possibly say something about AGW … because it does not exist. It’s an unsupported fantasy intended to scare the punters.
Not to worry! The lie spewing liars will simply change the data to show what they keep lying. That way they can steal more money since they are too stupid to have actual jobs that actually are productive or useful to the human race. Just look at griffie jumping right in the spew the same lies it always does. Greentards lie, it is the only way their leftist political agenda/religion can be forced on people, all of whom are far too busy making a living and raising children.
Hasn’t anybody ever been to a winery’s vineyard?
What is the first thing they brag about? The MICROclimate that is UNIQUE to THEIR vineyard.
I had a cousin with an orange grove where the land was a few feet higher than those around him. He could pick his oranges at the same time as his neighbors and they were the sweetest oranges I have ever had. In a different year, he could pick a couple of weeks early and get the high price due to the shortage.
There is NO planetwide climate. There are billions of MICROclimates. I posit that every “weather station” is in a UNIQUE microclimate making planetwide measurements, even from space, meaningless.
They need a new approach if they actually want to SOLVE anything instead of just making people FEEL bad.
Exactly.
Despite an ever increasing cavalcade of measurements, we can never be sure of what exactly was being measured.
Which renders the whole construct of “average global temperature” a complete nonsense.
Once again, I’ll make the pitch for dealing with daily highs and lows instead of averages, and bin the data by Köppen–Geiger climate regions. Too much information is lost with averages, especially when the entire globe is represented with a single number!
The awake government bureaucrats all realize that one degree of warming in a century is NOT a crisis, but is just opening up a lucrative tax regime for governments around the world. They now have many useful idiots as supporters and it is only a matter of time until carbon taxes, and cross border carbon equalizing taxes on imports result in the tax-collecting power they want.
DMacKenzie,
Those bureaucrats are aligning themselves with the global corporate elites to create a new type of government! Instead of politicians telling businesses what and how much they should produced (Fascism,) the corporations now tell the politicians what to say and do! In return, the corporations guarantee the obedient politicos an election win; those that buck the saddle will have to win by popular vote alone, with NO media or corporate support!
The saddest part is that the useful idiots; like griffter, Simon et al.; are actually working towards a Fascist-like corporate state from a dystopian nightmare; yet they believe they are pursuing some noble purpose!
A mind is a terrible thing to waste; friends don’t let friends become Climastrologists!
“All the private jet-flying climate doomsday loonies now meeting in Glasgow would all like to have us believe everything is getting hotter and the planet is about to blow up, and so us taxpayers need to use only 1/1000 instead of 1/100 the energy they guzzle as they practice their gross policy incompetence.”
It’s weird, another sees as incompetence, what I see as corruption. To me, those are hyper wealthy/powerful (successful) criminally minded people (gangsters) that want to live as virtual gods, proceeding to “make it so”. At this endeavor, they seem quite competent to me. making good progress, while living as mere virtual demigods ; )
Here’s the global UAH data over the same period.
Warming rate of 0.18°C / decade.
WOW! SHOCKING!
More than shocking – it’s able to be accurately measured down to hundredths of one degree C over periods of decades.
I’m astonished.
So astonished that I’m calling bullshit.
I’m just using the existing data, not saying how accurate it is. If you don’t like UAH data you need to take it up with Dr Spencer and those who keep promoting it as the only data set we can trust.
If you’re posting it and repeating it, then you are also culpable for it. You cannot dodge responsibility by saying you have nothing whatsoever to do with it whilst being an accomplice in the distribution of this material. Ignorance is no excuse and no defence; ethically, morally or legally.
Do you complain when WUWT and Lord Monckton publishes the same data? When Lord Monckton net tells us that according to UAH the pause now starts March 2015, will you point out to him that he’s culpable of spreading disinformation because he doesn’t know how inaccurate UAH data is? Is it now illegal to distribute the work of Spencer and Christy?
Lord Monckton blatantly makes it known that he is accepting what is published and is showing how it is wrong using the assumptions implicit in the published information.
More particularly if you think he is wrong to use UAH, then as the old proverb goes “Two wrongs don’t make a right!” You shouldn’t be using UAH (or RSS for that matter) for anything either.
I don’t think he’s wrong to use UAH, I do think it’s a mistake to only use that, and even more of an error to use whichever one gibves him the result he wants. Note he does now mention HadCRUT, but only since I pointed out to him it gives him a longer pause.
I’m not the one claiming global averages don’t exist, or UAH is dishonest, so I’m not sure why you think I cannot use it.
You are the one claiming it’s impossible to know what the trend in global average temperatures is, you presumably also then claim it’s impossible to know if the last 6 years 8 months had a sub zero trend, and I assume, if you are being consistent, you think Monckon’s claim of a pause is at least as dishonest as any positive trend I produce.
Monckton does not “blatently make it known” that his pause is intended to demonstrate that UAH is wrong. If I’ve missed a post where he does, can you point me to it?
Especially when the measurement uncertainty is in the 3 – 4 percent range.
Pity the UK, like Japan, has seen none of it
When can we expect our warming?
Right after the global warming-induced global cooling sets in.
Well, it’s already looking like a cold winter is coming.
That’ll be because a warmer Arctic causes cold winters. And other post-modern nonsense.
Fretslider, do you live under a perpetual cloud or something?
Every month you come on here and complain about how cold the previous month was in the UK. October 2021 was inside the top 15 warmest Octobers in the UK record, which starts in 1862.
You even complained last month that September was cold in the UK – it was the second warmest September on record. Same thing with summer; you said it was cold in the UK, the Met Office showed it was the joint 8th warmest summer on record.
You might want to check that you’re not somehow generating your own personal low pressure system.
So what happened between ’98 and 2011? an extra 24ppm of CO² was added to the atmosphere during that period.
A 13 year period where CO² has apparently a negative correlation with October temperature anomalies.
The same thing that happened between 2011 and 2020, large effects from changing conditions such as ENSO that swamp out the small effect from greenhouse gases over such a short period.
“large effects from changing conditions such as ENSO”
On the 1998-2011 period ONI I can’t see a whole lot of swamping going on.
How tiny is the effect of CO²?
But not the same scale, showing a mere 1C from top to bottom of the graph instead of the 4C range used by the OP. If on a 4C scale, it would look much flatter. And as the individual graphs need a 4C range to show the extent of year-to-year variability, if Tokyo *had* the massive 0.18/decade positive trend it’d *still* look like noise — because it is. Tokyo average mean temperatures in the OP varied by 3.4C within a few decades and nothing terrible happened — and why should it when the *daily* swing of temperatures is 5.3C in October.
To make modern warming look impressive, it is necessary to rely on anomalies, because any graph revealing the daily, seasonal, or even year-to-year variability of actual temperatures will put the insignificance of the supposedly catastrophic warming in perspective.
Global averages show less variation than single stations. Who’s have guessed?
What a buffoon.
And here is the same data with conservative uncertainty bars = +/- 0.7C which assumes a constant temperature uncertainty of +/- 0.5C (RSS with the anomaly subtraction); r^2 is only 0.57 and the regression line could be anywhere in this interval:
Here are the t = 0.05 confidence intervals calculated from the uncertainty limits:
Lastly, the confidence intervals 100 years into the future, showing how meaningless the fit over just a few decades is:
As I keep saying whenever a seven year pause is mentioned. But your plot is made more meaningless when you are only using data for October.
HAHAHAHAHAHAAH!
Its YOUR plot bellcurveman! I just added a few details you glossed over in your rush to claim Burnt Cinder Earth.
When did I claim “Burnt Cinder Earth”. I’m not even sure what it means. Your “few details” are to add meaningless uncertainty intervals, produce a very large uncertainty interval for the trend, and then to project it 80 years into the future. I’m not making any projection on the strength of 30 years of October temperatures. That’s absurd.
The particular absurdity here is using the uncertainty interval for just October values and projecting those into the future. You need to look at all the months. Making a forecast just for October implies all the monthly trends are independent, which of course the are not.
Are you really this dense, or is it just an act?
Commenting here is always such a strange dance.
This article claims that Octobers in Tokyo are getting colder. It does this using a single station which moved to a cooler location in 2014. It plots a trend line which is effectively flat with no confidence interval or attempt to say if the negative trend is statistically significant.
I, in order to give some context to this, show what Octobers have been doing over the same period globally. I use UAH data, because it is the only data people here are supposed to trust, and generally shows the least warming. I include confidence intervals on the graph.
Result – multiple comments saying UAH is wrong, that I’m not taking into account all the uncertainties in the data, that I’m trying to prove we are all about to be turned into cinders, etc. Yet none of this logic is applied to the original post, claiming cooling in Tokyo.
Strawmen seem to be your stock-in-trade.
Could you explain that? I’m not familiar with calculating a confidence interval from the uncertainty limits.
You think the UAH monthly uncertainty is at least 0.7°C? You really don;t have much trust in the satellites, or UAH. Have you explained this to Dr Spencer?
If there really was that much uncertainty, why do you never see it reflected in the month to month changes.
Even if this uncertainty was true, it still wouldn’t mean the regression line could be anywhere in the intervals.
Duh, sqrt( 0.5*0.5 + 0.5*0.5 ) = 0.7
Uncertainty is NOT random variation!
“Duh” is not an answer. All you are saying is the uncertainty of the sum of two independent measurements with uncertainty 0.5°C is 0.7°C. How is that relevant to calculating the uncertainty in the monthly satellite data?
I’m not trying to defend UAH data. I’ve always thought that climate “skeptics” put far to much trust in the reliability of satellite data, and it’s clear that UAH is a bit of an outlier compared with other data sets. But you cannot just make up absurdly high levels of uncertainty without some justification. And, as I’ve already said, you should ask Dr Spencer about it if you think he is misleading the public about the reliability of his data set. Especially considering how often it is used to argue the IPCC models are wrong.
Try this again, slowly:
NO ONE HAS DONE A FORMAL ANALYSIS OF THE UAH DATA!
All I did was assume a value more reasonable than these milli-Kelvin number.
You go ask him.
You claimed that an uncertainty of 0.7°C was a conservative estimate for monthly UAH anomalies, and that this is based on a constant of 0.5°C. Now you are admitting you’ve done no analysis and just assumed the values were better than some other made up value.
Would that be a correct interpretation of your position?
IDIOT!
I never claimed to have done complete analysis, all I did was assume (<<< you do know what this word means??) a value that is a lot more realistic than the reported milli-Kelvins.
And by “conservative” I meant that real values could be significantly higher.
Have you ever personally done ANY measurement work?
Very sorry for OT, but there is no actual blog entry here where it’s actually read, but I believe it worth it.
Covid-19: Researcher blows the whistle on data integrity issues in Pfizer’s vaccine trial
Revelations of poor practices at a contract research company helping to carry out Pfizer’s pivotal covid-19 vaccine trial raise questions about data integrity and regulatory oversight.
I saw this yesterday; Pfizer has a direct pipeline to the US Treasury and will not allow anything to threaten the status quo. Pfizer funds/owns all the US media corps., so they will not honestly report anything with a bad light.
Once again this article ignores the red line in the Tokyo data in 2014, indicating “data inhomogeneity caused by changes in instrumentation, observation methods and/or site location”
And this changes the result, how exactly?
Couldn’t tell you exactly, but you’d think it would be worth mentioning if you are claiming this one station shows no trend in 30 years. Just looking at the graph it seems there was a noticeable drop in temperature after 2014.
And this changes the result, how exactly?
Couldn’t tell you exactly.
So basically, you just wasted everybody’s time with that particular non-point for the sake of it.
If only you could tell us.
Sorry to have wasted your time. Obviously it’s completely irrelevant if a station is moved as long as you cannot say “exactly” how much of an effect the movement had.
However see the comment below. According to JMA the effect of the move is to reduce the minimum temperature by 1.4°C, so a cooling effect of 0.7°C to the mean. But I assume to a true “sceptic” these changes are irrelevant as long as the result confirms your biases.
My biases?
Nobody knows how the climate works. Nobody.
How biased is that?
Here’s the details of the move.
http://www.jma.go.jp/jma/kishou/know/kansoku/info/20141126_relocation_of_the_tokyo_site.pdf
It was moved from JMA’s HQ, to the Kitanomaru Gardens. According to the document, the maximum temperatures are generally the same, but the minimum temperatures are lower. On average the annual minimum is 1.4°C lower.
You would think that someone who talks about the “city’s massive urban heat island effect” would be interested in that move.
And when Los Angeles moved its official station from downtown, to a less urban environment on a nearby UC campus, the temperatures dropped about 2°C. Nobody paid much attention to that either, continuing to claim that the UHI doesn’t impact the temperature record.
Nobody says UHI doesn’t impact temperature readings. That’s why you cannot just use raw data.
I believe that Steve Mosher has claimed that UHI has no impact on surrounding rural temperatures, despite a couple of NASA remote sensing studies showing that the temperature and precipitation are affected downwind for about 20 miles from major cities.
Are you telling me that urban temperatures, and downwind rural temperatures, are adjusted downward for UHI effects, and that the adjusted temps are used for homogenization?
“Are you telling me that urban temperatures, and downwind rural temperatures, are adjusted downward for UHI effects, and that the adjusted temps are used for homogenization?”
Just how many thermometers that are input into GISS/Hadcrut or any of the other global temp. series are “downwind for about 20 miles from major cities”? and 70% of the globe is ocean – the major reason that it’s a nothing-burger for peeps here to chew on.
And on top of that it depends on the weather situation – Wind strength, stability FI.
Precipitation is know to increase in unstable (showery) set-ups downwind of major cities (more convective lift).
Why are the new temps seen as a “bias” and adjusted downward just like others with “bias” are adjusted downward?
So max temps didn’t change. Doesn’t that mean no burning up flames?
Try reading what the document said. Maximum temperatures are the same in the two locations, minimum are not. This seems consistent with the difference being caused by UHI.
You didn’t answer the question I asked!
Your question was
“Doesn’t that mean no burning up flames?”
I didn’t realise you wanted an answer to it, as it’s gibberish. But I’d say burning up flames exist, so no it doesn’t mean no burning up flames.
I would be interested in why the new temps aren’t adjusted upwards to match the old ones. I thought that was what “bias” in the temps records was supposed to correct. This pretty much explains why all corrections are downward doesn’t it.
Here is the data for Tokyo from 1880 to present.
Cleaned, homogenized…
Dirty, filthy data.
It doesn’t say what they want it to say.
What do they want it to say? And who is “they”?
Recovery from LIA, nothing to do with man made and CO2
Can you present your model explaining how “recovery from LIA” works? I’d like to test it out on the Tokyo monthly temperature data from 1880 to present. If the RMSE is reasonably low I’ll consider that test a success and move on to other stations and see how skillful it is with those to.
LIA followed MWP (medieval warm period), bottomed in the second half of 1600s. Consider looking at the correlation of the CO2 concentration and temperature data from peak of MWP to the present day.
Temperature goes up and down due to natural variability of which solar cycles is one. Oceanic cycles (AMO, PDO, circumpolar oscillation etc) are well known but assumed causes are not universally accepted.
For example, there is strong correlation of global temperature and the earth’s magnetic dipole but that is not proof that the magnetic field is the cause.
That’s pretty good. What does it look like if you go further back in time.
Vuk,
I am very interested in finding more information on solar and ocean cycles, and how they impact global temps and CO2! It seems very likely that most of the CO2 increases we are currently seeing are due to outgassing from the ocean deeps as they warm, post LIA!
Are there any sources you would recommend in particular? I’m rather old-fashioned and would rather buy a hard copy than spend time looking at my computer screen!
The ocean is a net carbon sink right now. It is taking carbon mass from the atmosphere; not giving it to the atmosphere.
“Data” is something that has a different meaning to what you think it means.
You should use the term “CONSTRUCT” when presenting numerical values that have been contrived from numerous disparate recordings.
No concrete, steel and bitumen in Tokyo back in 1880. So no urban heat effect in the latter years?
UHI, Bellman just showed us.
Something “new” will eventually cool Europe:
How a Wayward Arctic Current Could Cool the Climate in Europe
The Beaufort Gyre, a key Arctic Ocean current, is acting strangely. Scientists say it may be on the verge of discharging a huge amount of ice and cold freshwater that could kick off a period of lower temperatures in northern Europe.
The explanation is very simple. Japan has not yet homogenised their temperature records.
Im a 30-year resident of Tokyo. I can vouch for this
“Tokyo Hasn’t Seen Any Warming In October In 30 Years”