Reposted from Dr. Judith Curry’s Climate Etc.
Posted on October 6, 2021 by curryja |
by Judith Curry
A rather astonishing conclusion drawn from reading the fine print of the IPCC AR6 WG1 Report.
Well, I’ve been reading the fine print of the IPCC AR6 WG1 Report. The authors are to be congratulated for preparing a document that is vastly more intellectually sophisticated than its recent predecessors. Topics like ‘deep uncertainty,’ model ‘fitness-for-purpose’ (common topics at Climate Etc.) actually get significant mention in the AR6. Further, natural internal variability receives a lot of attention, volcanoes a fair amount of attention (solar not so much).
If we harken back to the IPCC AR4 (2007), global climate models ruled, as exemplified by this quote:
“There is considerable confidence that climate models provide credible quantitative estimates of future climate change, particularly at continental scales and above.”
The IPCC AR4 determined its likely range of climate sensitivity values almost exclusively from climate model simulations. And its 21st century projections were determined directly from climate model simulations driven solely by emissions scenarios.
Some hints of concern about what the global climate models are producing were provided in the AR5. With regards to climate sensitivity, the AR5 included this statement in a footnote to the SPM:
“No best estimate for equilibrium climate sensitivity can now be given because of a lack of agreement on values across assessed lines of evidence and studies.”
More specifically, observationally-based estimates of ECS were substantially lower than the climate model values.
Perhaps more significantly, figure 11.25 in the AR5 included a subjective red-hatched area determined from ‘expert judgment’ that the climate models were running too hot. It is noted that the projections beyond 2035 were not similarly adjusted.

IPCC AR6 – global warming
The IPCC AR6 takes what was begun in the AR5 much further.
With regards to equilibrium climate sensitivity, the AR6 breaks with the long-standing range of 1.5-4.5C and narrows the ‘likely’ range to 2.5-4.0 C. Here is how that range compares with previous estimates and also the CMIP6 models (as analyzed by Mark Zelinka):

The AR6 analysis of ECS was influenced heavily by Sherwood et al. (2020). I agree with dropping the top value down from 4.5 to 4.0C. However, I do not agree with their rationale for raising the lower value from 1.5 to 2.5C. Without going into detail on my concerns here, I note that Nic Lewis is working on an analysis of this. But the main significance of AR6’s narrower range is the lack of influence of the CMIP6 ECS values.
A substantial number of the CMIP6 models are running way too hot, which has been noted in many publications. In its projections of 21st century global mean surface temperatures, the AR6 provides ‘constrained’ projections (including climate models with reasonable values of climate sensitivity that reasonably simulate the 20th century). Figure 4.11 from the AR6 shows the magnitude of the constraints. For SSP5-8.5, the magnitude of the constrained relative to the unconstrained CMI6 is 20%.

For the first time, CMIP6 includes actual scenarios of volcanic activity and solar variability. CMIP6 includes a background level of volcanic activity (no major eruptions) and an actual projection of 21st century solar variability from Matthes (2017) (discussed previously here), although few models are up to the task of credibly handling solar indirect effects. The AR6 only considers these baseline solar and volcano scenarios; the other volcanic scenarios (shown in Figure 1, Box 4.1 of the AR6) and the Maunder minimum scenario from Matthes (2017) are surely more plausible than SSP5-8.5 and hence should have been included in the projections.
The AR6 also acknowledges the importance of natural internal variability, in many of the Chapters. CMIP6 included Single Model Initial Condition Large Ensembles (SMILEs; section 6.1.3). However, there are substantial disparities between the large-scale circulation variability in observations versus most models (IPCC AR6 Chapter 3) – decadal variability that is too strong and multi-decadal and centennial variability that is too weak. A few of the models seem to do a pretty good job, notably GFDL.
Here are the ensemble forecasts for SSP2-4.5, including the projections from the individual models, the ‘constrained’ versus ‘unconstrained’ 90% range, and the AR6 best estimate (note this image was pulled from a CarbonBrief article). The AR6 best estimate is near the lower end of the entire range; this bias doesn’t allow much scope for natural variability (particularly of the multi-decadal variety) at the lower end of the model range to truly illustrate a realistic time range as to when we might pass the 1.5 and 2C ‘danger’ thresholds.

To minimize some of the problems related to constraining the projections, there is an emphasis on assessing impacts at different levels of global warming, e.g. 2, 4 degrees C.
Regional projections
The IPCC AR6 report provides a substantial emphasis on regional climate change (Chapters 10, 12). The focus is on a distillation of diverse sources of information and multiple lines of evidence, and indirectly acknowledges that global climate models aren’t of much use for regional projections.
Climate emulators
Since the Special Report on 1.5 degrees, the IPCC has increasingly emphasized the use of climate emulators, which are highly simplified climate models (see this CarbonBrief article for an explainer) that are tuned to the results of the global general circulation model based Earth System Models. These models are very convenient for policy analysis, enabling pretty much anyone to run many different scenarios.
And there’s no reason why this general framework couldn’t be expanded to include future scenarios of warming/cooling related to volcanoes and solar, and also multi-decadal internal variability. This framework could be very useful for regional climate projections.
However, climate emulators are not physics-based models.
Are global climate models the best tools?
Text from an essay I am writing:
In the 1990’s, the perceived policy urgency required a quick confirmation of dangerous human-caused climate change. GCMs were invested with this authority by policy makers desiring a technocratic basis for their proposed policies. Shackley et al. However, both the scientific and policy challenges of climate change are much more complex than was envisioned in the 1990’s. The end result is that the climate modeling enterprise has attempted a broad range of applications driven by needs of policy makers, using models that are not fit for purpose.
Complex computer simulations have come to dominate the field of climate science and its related fields, at the expense of utilizing traditional knowledge sources of theoretical analysis and challenging theory with observations. In an article aptly titled ‘The perils of computing too much and thinking too little,’ LINK atmospheric scientist Kerry Emanuel raised the concern that inattention to theory is producing climate researchers who use these vast resources ineffectively, and that the opportunity for true breakthroughs in understanding and prediction is being diminished.
Complexity of model representation has become a central normative principle in evaluating climate models and their policy utility. However, not only are GCMs resource-intensive and intractable to interpret, they are also pervaded by over parameterization and inadequate attention to uncertainty.
The numerous problems with GCMs, and concerns that these problems will not be addressed in the near future given the current development path of these models, suggest that alternative model frameworks should be explored. We need a plurality of climate models that are developed and utilized in different ways for different purposes. For many issues of decision support, the GCM centric approach may not be the best approach. However, a major challenge is that nearly all of the resources are being spent on GCMs and IPCC production runs, with little time and funds left over for model innovations.
The policy-driven imperative of climate prediction has resulted in the accumulation of power and authority around GCMs (Shackley), based on the promise of using GCMs to set emissions reduction targets and for regional predictions of climate change. However, the IPCC is increasingly relying on much simpler models for setting emissions targets. The hope for useful regional predictions of climate change using GCMs is unlikely to be realized based on the current path of model development.
With regards to fitness for purpose of global/regional climate models for climate adaptation decision making, an excellent summary is provided by a team of scientists from the Earth Institute and Red Cross Climate Center of Columbia University:
“Climate model projections are able to capture many aspects of the climate system and so can be relied upon to guide mitigation plans and broad adaptation strategies, but the use of these models to guide local, practical adaptation actions is unwarranted. Climate models are unable to represent future conditions at the degree of spatial, temporal, and probabilistic precision with which projections are often provided which gives a false impression of confidence to users of climate change information.” (Nissan et al.)
GCMs clearly have an important role to play particularly in scientific research. However, driven by the urgent needs of policy makers, the advancement of climate science is arguably being slowed by the focus of resources on this one path of climate modeling. The numerous problems with GCMs, and concerns that these problems will not be addressed in the near future given the current development path, suggest that alternative frameworks should be explored . This is particularly important for the science-policy interface.
JC reflections
In the AR5, the emphasis was on the Earth Systems Models, and their ever growing complexity in terms of adding more chemistry and some ice sheet dynamics.
In AR6, these complex climate models are revealed for what they are: very complicated and computationally intensive toys, whose main results are dependent on fast thermodynamic feedback processes (water vapor, lapse rate, clouds) that are determined by subgrid-scale parameterizations and and the inevitable model tuning.
With the very large range of climate sensitivity values provided by the CMIP6 models, we are arguably in a period of negative learning. And this is in spite of the IPCC AR6 substantially reducing the range of ECS from the long-standing 1.5-4.5C to 2.5 to 4C (reminder: I am not buying this reduction on the low end, more on this soon).
So what are we left with?
- Global climate models (ESMs) remain an important tool for understanding how the climate system works. However, we have reached the point of diminishing returns on this unless there is more emphasis on improving the simulation of modes of internal climate variability and advancing the treatment of solar indirect effects.
- We should abandon ECS as a policy-relevant metric and work on better understanding and evaluation of TCR and TCRE from historical data.
- In context of #1, I question whether the CMIP6 ESMs have much use in attribution studies.
- ESMs have lost their utility for policy applications. Policy applications are far more usefully achieved with climate emulator models. However, the use of climate emulators distances policy making from a basis in physics. This is particularly relevant for the legal status in various climate lawsuits of 21st century climate projections and the ESMs in various climate lawsuits.
While this is hidden in the Summary for Policy Makers, it is pretty significant:
“A.1.3 The likely range of total human-caused global surface temperature increase from 1850–1900 to 2010–2019 is 0.8°C to 1.3°C, with a best estimate of 1.07°C. It is likely that well-mixed GHGs contributed a warming of 1.0°C to 2.0°C, other human drivers (principally aerosols) contributed a cooling of 0.0°C to 0.8°C, natural drivers changed global surface temperature by –0.1°C to 0.1°C, and internal variability changed it by –0.2°C to 0.2°C. It is very likely that well-mixed GHGs were the main driver of tropospheric warming since 1979, and extremely likely that human-caused stratospheric ozone depletion was the main driver of cooling of the lower stratosphere between 1979 and the mid-1990s.”
Compare this to the statements in the AR5 SPM:
“It is extremely likely that more than half of the observed increase in global average surface temperature from 1951 to 2010 was caused by the anthropogenic increase in greenhouse gas concentrations and other anthropogenic forcings together. The best estimate of the human-induced contribution to warming is similar to the observed warming over this period.”
Overall, the AR6 WG1 report is much better than the AR5, although I remain unimpressed by their increased confidence in a narrower range of ECS.
The bottom line is that the AR6 has broken the hegemony of the global climate models. The large amount of funding supporting these models towards policy objectives just became more difficult to justify.
“With the very large range of climate sensitivity values provided by the CMIP6 models, we are arguably in a period of negative learning”.
That’s partly because there is no such thing as “Equilibrium Climate Sensitivity” in a multivariable non-equilibrium system like the climate. It is an abstraction of the models.
In the real world, prod it slightly, and it may bounce around all over the place. Or maybe not. They have still demonstrated next to no skills in modelling the entire system, ignoring the cautions of Lorenz.
“negative learning” sums the entirety of the IPCC outputs post AR1 release 30 years ago into one term.
The entire AR6 is just another tome that uses science results and then a whole lot of magic to analyze the question of how many dancing angels can fit of the head of a pin. And then to make the output result sound like science.
“Not fit for purpose” describes not only the CMIP models but the entirety of the IPCC process. Unless of course the “purpose” is to justify a rush to a socialistic One World governance and squashing the West’s economic hegemony of the last 400 years.
Erm, why don’t we just run with the UAH and GSS satellite records which steadily show 1.4degsC a century increase. It’s long enough to have become climate not weather. Given the accompanying rise in CO2 which will continue at c. 2 ppm a year, nothing seems to have changed? All the risks are cooling ones, including the macro Holocene decline. Don’t worry about a Younger Dryas, just keep quite calm.
Oh, and further to. Do take a look at the AR6 Hockey Stick fraud exposed by Steve McIntyre at Climate Audit. For me, that overwhelms any discussion about GCMs. Who allowed it to tarnish the reputation of all those IPCC worker ants?
Ed Hawkins, University of Reading, has updated figure 11.25 in IPCC AR5 annually with the latest observational data. It is here:
Without the recent Super El Nino, even the red-hatched bottom would be in trouble. Give it a couple of years. Anyway, “experts” had to arbitrarily reduce near-term warming, all without reducing the models’ obvious long term fantasies. I wonder how time will treat the CMIP6 speculations.
It’s more of an art form.

This is the RSS satellite plot of global T compared to the 5% to 95% range (yellow) of CMIP-5 climate simulations:
The lows are already exceeding the uncertainty levels of the projections. That should be a tip-off that something is terribly out of whack. As long as the actuals stay in the uncertainty interval, one can always argue there is no evidence to disprove anything. Once they begin to exceed the limits, that argument is moot.
Not to mention that averaging climate model outputs has no technical basis, it certainly doesn’t gets closer to a “true” value.
Your last paragraph – AR5 reported that total global warming between 1951 and 2010 was about 0.5 degC, so the ‘more than half’ caused by humankind is only 0.25 degC, with zero before 1950. So AR6’s estimate of 1 to 2 degC increase caused by us is a massive increase, 4 to 8 times. Judith, is the evidence there to support this?
If modeling climate was anything near to a realistic simulation, there would be no CIMP1, 2, 3, 4, 5 or 6 at all.
The fact that there are is solid evidence of guessing being used to create political policy.
The fact that they only compare their results to each other’s models and not to observation tells us all we need to know about what they are worth.
They’re always keen on volcanoes, even tho hardly any significant activity has occurred since 1992, & even that had minimal effect. The reason is to justify their way-overestimated effects from aerosols, which justifies more & more Draconian regulations.
AND provides their convenient excuse for CO2’s inability to stop the global cooling that induced the last “human induced climate catastrophe” that wasn’t human induced either.
Yes, the alarmists seem to be trying to introduce aerosol arguments into the conversation to explain past cooling and the cooling that looks like it is coming in the future.
They want to cover their bases, but human-derived aerosols, are not like volcanoes which inject large amounts of material into the upper atmosphere where they actually do have an effect on temperatures, cooling the Earth for a year or two if enough material is put into the atmosphere. But human-derived aerosols don’t go high enough in the atmosphere to affect things the way a volcanic eruption affects things. The aerosol promoters just pretend they have the same effect. That’s what they are doing here when they mention aerosols.
I went all through the 1970’s waiting for the Human-caused Global Cooling promoters to provide some evidence for their claims and I *never* saw one shred of evidence. And I’m expecting the same thing this time. It’s all assumptions and assertions, just like the CO2 BS.
As a rule I never expect any good to come from the fine print. Dr. Curry has shown me to be wrong, at least in this case.
The symbiotic relationship between climate modelers and policy makers in government reminds me of the old 1980s television series produced by Jim Henson called “Fraggle Rock”. The show featured several “species” that lived in a cave, called the “Fraggles” and the “Doozers”, among others.
The symbiotic relationship between the Fraggles and the Doozers was that the Fraggles loved to eat rock candy but preferred to stay in their cave, and the Doozers (supposedly emulating the US Army Corps of Engineers, with their little hard hats and industrious ways) loved to build structures out of rock candy in the cave, no matter how useless they might be, other than as food for the Fraggles.
Indeed, the Doozers were ecstatic to see the Fraggles eating and thus destroying their rock candy structures, because that meant that the Doozers then had an excuse to go and build more of them. And of course, the Fraggles were happy as pigs in you know what to have the Doozers constantly creating their favorite treat so conveniently in the cave.
It’s the same symbiotic between climate modelers and policy dweebs – the climate modelers keep building models, and the policy dweebs keep consuming those models, expounding on the profound meaning of the models that just happen to support their proposed policies. And thus the policy dweebs keep ordering ever more and more climate models to be constructed. And the climate modelers are ecstatic to have their models “consumed”, and ever more ordered to be produced.
And on and on it goes.
From the article: ““A.1.3 The likely range of total human-caused global surface temperature increase from 1850–1900 to 2010–2019 is 0.8°C to 1.3°C, with a best estimate of 1.07°C. It is likely that well-mixed GHGs contributed a warming of 1.0°C to 2.0°C, other human drivers (principally aerosols) contributed a cooling of 0.0°C to 0.8°C, natural drivers changed global surface temperature by –0.1°C to 0.1°C, and internal variability changed it by –0.2°C to 0.2°C. It is very likely that well-mixed GHGs were the main driver of tropospheric warming since 1979, and extremely likely that human-caused stratospheric ozone depletion was the main driver of cooling of the lower stratosphere between 1979 and the mid-1990s.””
Total BS.
The warming from 1910 to 1940 was equal to the warming from 1979 to the present, yet the IPCC does not say the 1910 to 1940 warming was mainly driven by CO2. So if one period can warm at the same magnitude without CO2, then why would we need CO2 for a similar warming at a later time. Just because there is more CO2 in the air now than then? That’s not good enough!
These alarmists can say these things because the actual temperature profile of the world has been bastardized and distorted to tell a lie about the climate instead of the truth. If they acknowledged that it was just as warm in the Early Twentieth Century as it is today, then they could not make all these wild claims about the climate.
The Hockey Stick Lie enables even bigger lies. Like AR6.
And there is no evidence that human-derived aerosols are doing anything to the Earth’s weather. There wasn’t any evidence of it in the 1970’s, which the Human-caused Global Cooling crowd was advocating, and there’s still no evidence of it now. The alarmists have just recently found it convenient to put aerosols in the conversation to try to explain away unexplained cooling in the temperature record.
There’s no evidence that human-derived CO2 or aerosols are detrimentally affecting the Earth’s atmosphere. None. These are all unsubstantiated assertions. Assertions are not evidence of anything.
look at their graph above, the 1910-1940 warming has been thoroughly memoryholed
data has been fit to model
people living in the 1970s would have laughed themselves silly if you showed them the AR6 graphs of their era
“look at their graph above, the 1910-1940 warming has been thoroughly memoryholed”
I know it. I’ve been railing against the data manipulation for a long time.
If the alarmists didn’t have these bogus, bastardized, instrument-era Hockey Stick charts, they wouldn’t have anything to promote their Human-caused Climate Change scam.
It seems to me that it is futile to model a chaotic system. The more parameters and physics you put in, the more chaotic the output will become. What’s needed is to model the ‘guard rails’ of this system. Over millions of years, despite swings of every variable including CO2, the climate doesn’t seem to go above or below certain limits.
You would expect a truly unconstrained chaotic system to have spun out in some direction or other, but it hasn’t. What are the constraints (high and low)? Under what circumstances do they kick in? Are they simply negative feedbacks to the current trend, or truly driven by external forces?Classic example: ‘Arctic death spiral’ that appears to have slowed, maybe stopped, despite the so-called theory.
I agree with Dr Curry. What’s needed is funding for true theoretical research on Climate. Then maybe they’ll know WHAT to model.
The IPCC realised this around the turn of the millennium, and actually explicitly laid out their reaction in “the fine print” of chapter 14 of the TAR (2001) :
Note that it is the IPCC that gets to decide what is “essential”, as well as what “must be” done in response.
AR6 merely confirmed the above (as did AR4 and AR5, if you looked closely), albeit indirectly and with a small evolution in the definition of the phrase “long-term” over the last 20 years.
‘Exactly how this ecological enigma came about has baffled scientists. But now, an international, multidisciplinary team of researchers has revealed that this out-of-place ecosystem began growing around 125,000 years ago, when sea levels were much higher and the ocean covered most of the region.
“The most amazing part of this study is that we were able to examine a mangrove ecosystem that has been trapped in time for more than 100,000 years,”‘
Mysterious Mexican mangrove forest is ‘trapped in time’ hundreds of miles from the coast (msn.com)
It’s called climate change boofheads and obviously the plants ate up lots of CO2 or something like that causing global cooling and the sea level to drop. This stuff is common consensus science stoopids. Just ask the IPCC.
A case of reality bites.
The Adjustocene is eminently flexible and contextual.
No one paying attention doubts that the planet has been warming since the depths of the Little Ice Age. The mistake is thinking that CO2 increase contributed to it. NASA/RSS accurately measured and reported average global water vapor Jan 1988 to Jan 2021. http://data.remss.com/vapor/monthly_1deg/tpw_v07r01_198801_202101.time_series.txt As shown in this graphic, measured WV is about 31% more than calculated in GCMs and about twice as much as possible from measured planet warming (net result of all feedbacks and forcings). The GCMs are faulty. The measured WV increase can explain all of the warming attributable to humanity. Basis for the graphic is at https://watervaporandwarming.blogspot.com
In the Church of Warming, climate models are the equivalent of the Oracle of Delphi.
the SSP 2-4.5 graph is a bad joke
in the UAH lower tropospheric data you can draw a straight line that hits monthly temperatures in both 1980 and 2021
lol on the graph above it would be a 45 degree line
sure
but of course any model that actually followed the satellite-era warming trend wouldn’t produce enough policy juice
https://www.drroyspencer.com/latest-global-temperatures/
Min Max
well-mixed GHGs 1.0 2.0
other human drivers -0.8 0
natural drivers -0.1 0.1
internal variability -0.2 0.2
Total -0.1 2.3
So the overall effect of these factors could be negative?
I wonder what the red line means after 2031?
Now the solar flux 10.7 cm looks like this: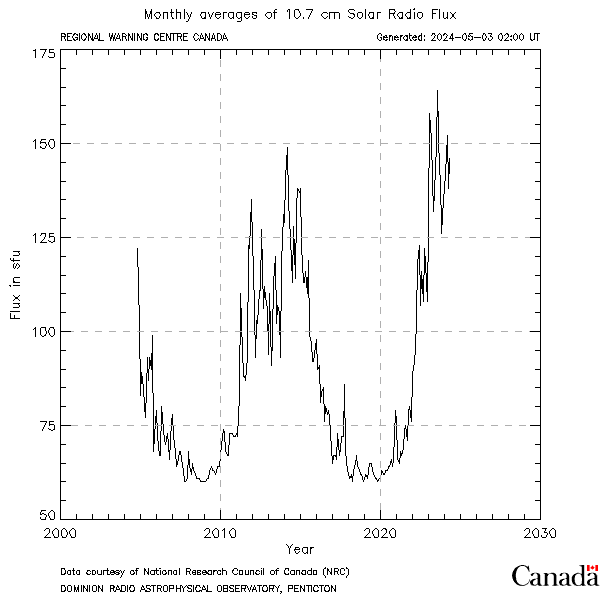
For comparison, a plot of the solar flux F 10.7 cm in the 23rd and 24th solar cycles? Why doesn’t Canada make this graph available? ?itok=0IrM45vm
The stratospheric polar vortex is just developing in the north, and already a strong anomaly is visible. You can see that the center of the vortex is shifted over Siberia, and there is a surplus of ozone over the Bering Sea that is blocking circulation in the stratosphere.
The low seen in the North Pacific will now move toward the Bering Strait.
http://tropic.ssec.wisc.edu/real-time/mtpw2/product.php?color_type=tpw_nrl_colors&prod=alaska×pan=24hrs&anim=html5
During the winter season, the polar vortex determines the circulation in the upper troposphere.
https://www.cpc.ncep.noaa.gov/products/intraseasonal/z200anim.shtml