Mike Jonas
Sep 2021
The BBC’s Matt McGrath has just reported, under the above ‘Climate Change’ headline, the findings of a paper in Nature linking Arctic variability and change with extreme winter weather in the United States (lead author Dr Judah Cohen, a professor at the Massachusetts Institute of Technology (MIT)):
“A new study shows that increases in extreme winter weather in parts of the US are linked to accelerated warming of the Arctic.
The scientists found that heating in the region ultimately disturbed the circular pattern of winds known as the polar vortex.
This allowed colder winter weather to flow down to the US, notably in the Texas cold wave in February. ”.
There are a number of reasons for being highly sceptical – unlike Matt McGrath – about this paper:
- The climate models all show greater warming away from the tropics, and especially more warming in winter than in summer.
- The climate models are known to be particularly weak at regional predictions, which is one major reason why the climate scientists use an ensemble of models for their predictions.
- The scientists have told us repeatedly that no one extreme weather event can be attributed to global warming.
So what is going on, and why are they making these claims?
The answer is in the way that they tune their models.
They have no way of associating the Polar Vortex, or any other major climate feature, with the drivers of climate, other than through their models. So, when an unpredicted event like extreme cold winter weather hits the USA, they go to their models to try to find out why. The way they do this is to tweak the many parameters in the models, until they get a match with what they are looking for. They then analyse how the models got to the answer and proclaim that as the reason for it.
I explained the tuning process a long time ago in How Reliable are the Climate Models?:
“The fourth IPCC report [para 9.1.3] says : “Results from forward calculations are used for formal detection and attribution analyses. In such studies, a climate model is used to calculate response patterns (‘fingerprints’) for individual forcings or sets of forcings, which are then combined linearly to provide the best fit to the observations.”
To a mathematician that is a massive warning bell. You simply cannot do that. [To be more precise, because obviously they did actually do it, you cannot do that and retain any credibility]. Let me explain :
The process was basically as follows
(1) All known (ie. well-understood) factors were built into the climate models, and estimates were included for the unknowns (The IPCC calls them parametrizations – in UK English : parameterisations).
(2) Model results were then compared with actual observations and were found to produce only about a third of the observed warming in the 20th century.
(3) Parameters controlling the unknowns in the models were then fiddled with (as in the above IPCC report quote) until they got a match.
(4) So necessarily, about two-thirds of the models’ predicted future warming comes from factors that are not understood.”.
The same basic process applies in this case – the extreme winter weather in the USA. To explain it, they turned to their models and tried to get the models to replicate it.
When the modellers had tweaked their parameters to match the required extreme winter weather in the USA, they found that all the climate processes involved led back to the increased CO2 in the atmosphere as the cause. Well, surprise, surprise, there was no way that they can ever find any other cause. Why is that? Well, it’s because there are no other possible causes coded into the models.
As I said in the above quoted article, they haven’t coded any of the following into their models as possible causes (mostly because they can’t but partly because they won’t): ENSO (El Nino Southern Oscillation), ocean oscillations, ocean currents, volcanoes, wind, water cycle, sun, GCRs (Galactic Cosmic Rays), Milankovitch cycles, water vapour, clouds. Yes, they have coded some of these into the models to some extent, but not as primary causes of anything, only as constants or almost-constants, eg. the sun, or as features that react to CO2-induced changes, eg. water vapour and clouds (the IPCC calls them feedbacks).
The causes of the extreme winter weather in the USA remain unknown, apart from the obvious reason: the Polar Vortex. The reasons put forward in the above Nature paper are all based on circular logic, because they come only from the climate models when tuned to give the observed result. ie, the result is an input, which is by definition circular logic.
The situation is that the climate modellers do not know what caused the extreme winter weather in the USA, and they won’t get any nearer to knowing while they remain chained to their models.
Extreme weather is uncomfortable weather. And it changes. The cause is always the same. And the cause is the mathematics is broken.
If a warmer Arctic leads to more severe cold weather in the mid-latitudes, shouldn’t the coldest weather come in, I don’t know, spring or autumn?
If there is accelerated warming of the Arctic then where did the cold winter weather come from that pushed into the US and other northern hemisphere regions? And where is this accelerated warming because using a word like ‘accelerated’ means getting warmer and warmer at an increasing rate?
No it cannot be except in very limited circumstances.
Equator hot, poles cold, transitional between the 2.
One thing the models generally don’t consider is multidecadal oscillations such as the Atlantic Multidecadal Oscillation. Even worse, denial of that has lately become fashionable among all too many climate change scientists.
C’mon man! All, that polar warming scares the cold air into moving south! Cold air is notoriously cowardly!
To me this is like filming a video in which I make every possible prediction of the outcome of throwing two dice. Then I record a hundred throws of the dice and splice in the correct prediction before every throw. Behold I am a brilliant prognosticator and I have the video evidence to prove it.
Would be simpler to roll the dice, then call out the results. When you have enough rolls edit the video to revers the order of the roll and the call. This is more akin to how the climate scientists do it. Wait till the results are known, then declare that they predicted it.
Nonsense.It’s a study about simulations. Nothing but a computer game.
Would you fall in love with a Barbie doll? Studies show that men are attracted to beautiful models.
Sounds like one of them averaged model study’s.
No pictures or real women were shown.
The survey had a question similar to, “If you stranded on a desert island, which of the following would you prefer”
A) Biden,
B) A polar bear,
C) Greta,
D) A beautiful model?
Only then would someone choose an unknown.
This article really hits the nail on the head identifying the biggest problem using model. Great Job!
During global warming, there have actually been LESS extreme cold intrusions not more. That makes sense.
The thing that is causing LESS extreme cold intrusions, can’t be causing more of them.
The dynamics and meteorology may have changed and one can make a case for Arctic amplification principles in some situations but if they are more than offset by the opposite happening……….you just can’t have more of something because of the thing that is causing less of it.
Another thing. With absolute certainty, the coldest places at the coldest times of year are warming the most. That by itself tells you that the potential pool of extreme cold for outbreaks is going to be LESS under a global warming regime.
When they are able to pinpoint the causes for all the extreme cold outbreaks BEFORE global warming and rule those out AFTER global warming…………then we have something legit. They can’t do that and this gets to the crux of the fatal modeling flaws.
They only dial into the models what they know(think they know) and its completely lacking in all the reasons for previous extreme cold outbreaks.
Otherwise, it’s much more likely to be from the same forces that have always caused extreme cold outbreaks in the mid latitudes…..those laws of physics/meteorology were not suddenly abolished.
“The situation is that the climate modellers [sic] do not know what caused the extreme winter weather in the USA, and they won’t get any nearer to knowing while they remain chained to their models.”
But it pays well.
So all we need is a Little Ice Age to warm up in the lower 48. I’ll take that but somehow I don’t think it counts for much as another hollow prediction for fun and academic profit.
Bumper sticker: My AMO can whup your honors student (model)
“Can Arctic warming (be) linked to colder winters?”
Of course!
And it can also be linked to everything else!
Why will the polar vortex be blocked over the Bering Strait? Because during periods of weak solar magnetic wind fields, ozone and galactic radiation will accumulate during the winter in exactly the area where the greatest Arctic magnetic field weakening occurs. Ozone as a diamagnetic is pushed away by the stronger magnetic field. The concentration of GCR in this region is obvious, which may influence the temperature rise in this region. Conclusion – North America is prone to frequent stratospheric intrusions to the south of the continent during winter.
The strong magnetic field of the solar wind causes a more uniform distribution of ozone, which can be compared to the shape of the aurora borealis.
http://www.geomag.bgs.ac.uk/images/charts/jpg/polar_n_dy.jpg
Brief Introduction to Stratospheric IntrusionsStratospheric Intrusions are when stratospheric air dynamically decends into the troposphere and may reach the surface, bringing with it high concentrations of ozone which may be harmful to some people. Stratospheric Intrusions are identified by very low tropopause heights, low heights of the 2 potential vorticity unit (PVU) surface, very low relative and specific humidity concentrations, and high concentrations of ozone. Stratospheric Intrusions commonly follow strong cold fronts and can extend across multiple states. In satellite imagery, Stratospheric Intrusions are identified by very low moisture levels in the water vapor channels (6.2, 6.5, and 6.9 micron). Along with the dry air, Stratospheric Intrusions bring high amounts of ozone into the tropospheric column and possibly near the surface. This may be harmful to some people with breathing impairments. Stratospheric Intrusions are more common in the winter/spring months and are more frequent during La Nina periods. Frequent or sustained occurances of Stratospheric Intrusions may decrease the air quality enough to exceed EPA guidelines.
https://www.cpc.ncep.noaa.gov/products/stratosphere/strat_int/
“Stratospheric Intrusions are more common in the winter/spring months and are more frequent during La Nina periods.”
http://www.bom.gov.au/archive/oceanography/ocean_anals/IDYOC002/IDYOC002.202109.gif
As usual, I think you’ve nailed it Ren. The beautiful circular aurora pictured above, is perfectly centred over the North Pole and is a top-down view of the huge energy vortex coming from our sun and the galactic centre.
Interestingly the name Aurora Borealis was first coined by Galilio in 1619, from the Roman goddess of the dawn and the Greek name for a cold north wind. Looks like back in the day they realised what was going on.
Then we should expect it to accumulate over the Equator where the geomagnetic field lines are spread out more than at the polar convergences?
Here is something of interest which just caught my attention.Look at Meerisportal’s graph for the January monthly mean temps for Antarctica. I just noticed that temps in Antarctica spike around one year before global temps spike from any El Nino. Examples are at 2015, 2009, 2005, and 1996. …
Sea ice extent is increasing, which means Antarctic temperatures are dropping. Note that the peak of the 24th solar cycle occurred in mid-2014.

This caused a latitudinal circulation of north and south jet streams (a strong stratospheric polar vortex).
Note that northern sea ice extent also increased in 2014.
At the same time, this caused a stronger east-west circulation along the equator, leading to an El Niño.
“Sea ice extent is increasing, which means Antarctic temperatures are dropping.”
No it doesn’t.
Antarctica is not the Arctic.
It is unbounded by land and sea-ice is free to be wind-blown until eventually melting in warmer oceans.
https://nsidc.org/cryosphere/seaice/characteristics/difference.html
http://www.antarcticglaciers.org/glaciers-and-climate/changing-antarctica/antarctic-sea-ice/
Wind and movementChanges in atmospheric dynamics and winds are an important driver of regional sea-ice trends. Ozone and greenhouse forcings cool the Antarctic stratosphere, which increases the stratospheric vortex and tropospheric zonal winds. This results in an increase in the Southern Annular Mode [6]. Increases in the Southern Annular Mode (SAM) signify increased westerly winds [7] and a rigorous isolation and cooling of parts of the Antarctic continent [6].
Because the Arctic is a semi-enclosed ocean, there is little scope for sea ice movement. Ice in the Arctic is thicker as a result of collisions, which means that the ice will last longer. This means that much of the Arctic sea ice lasts for several seasons, leading to permanent ice cover at the pole. However, in the Antarctic, there are far fewer such constraints. The sea ice is able to move around far more freely. It floats northwards to warmer waters, where it melts away almost entirely. Changes in the winds around Antarctica therefore change ice-concentration trends around Antarctica [8] by influencing sea-ice production and melt rates [9]. The pattern of wind change is complex, but variations in winds can help to explain some of the regional patterns in sea-ice formation [8]. Where the wind blows to the north, the sea ice is blown north where it melts, resulting in increased sea-ice extent. Where the winds blow south, the sea ice is blown towards the continent, resulting in decreased sea-ice concentrations.
The ONI Index dropped sharply after the solar minimum on 2009 and attempted to rise in 2011, but solar activity remained low. Only when solar activity increased strongly in 2014 did ONI spike.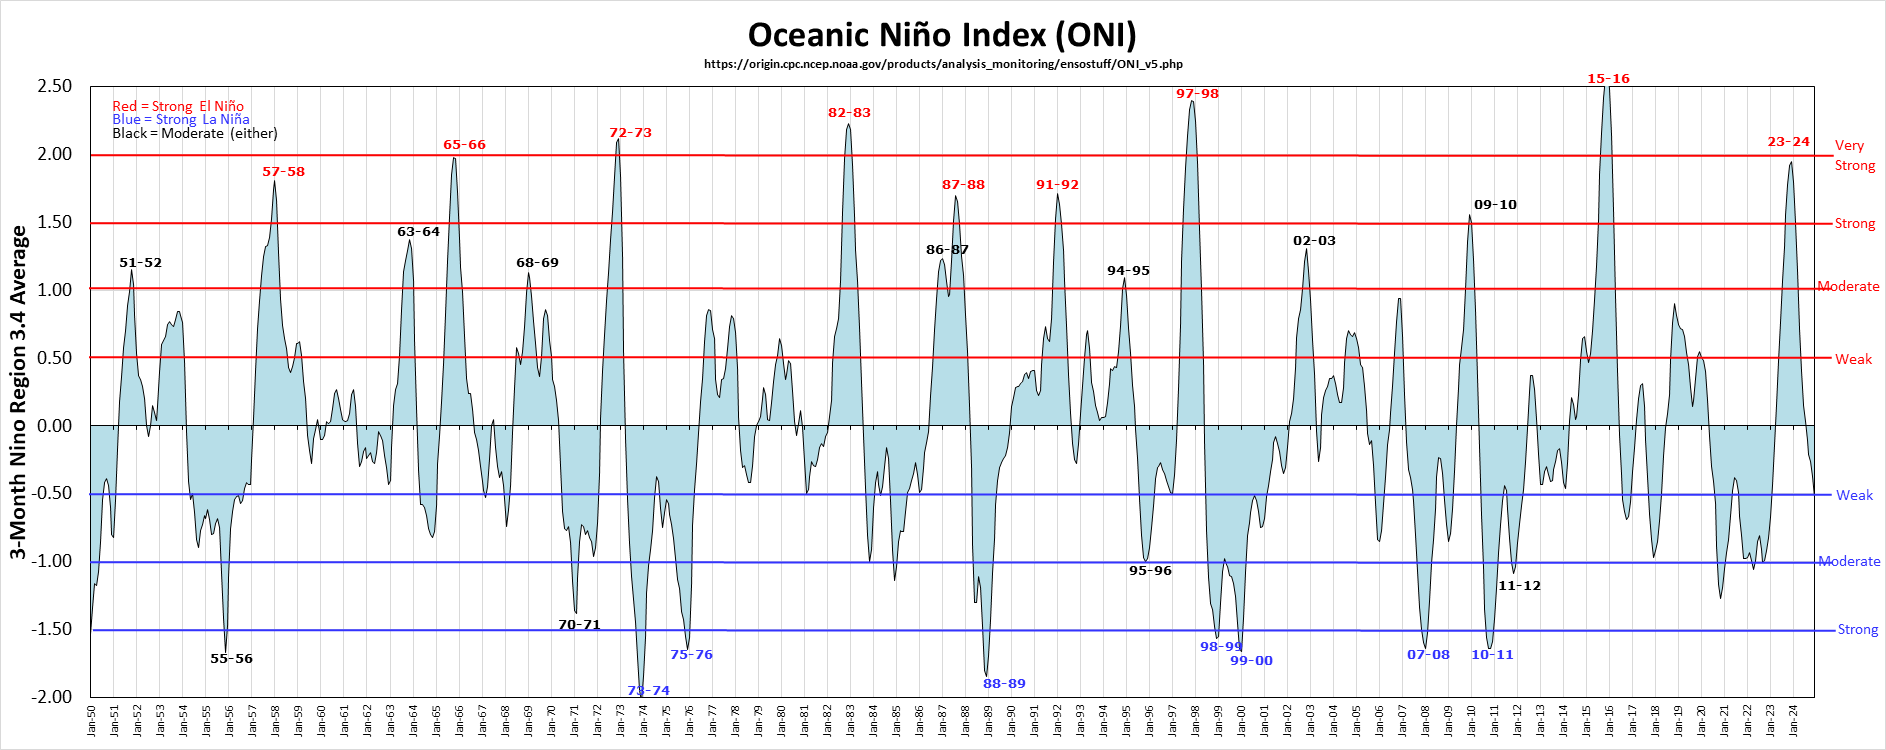

An analogous situation to 2011 occurred in the summer of 2021. The Niño 3.4 index tried to rebound, but solar activity is increasing even more slowly than it did in the 24th solar cycle. Until solar activity increases significantly, no El Niño will form.
It’s worth wondering why surface temperatures drop so slowly when the Peruvian Current brings cold water below the surface? In my opinion, the easterly wind along the equator is not constant. The meridional jet current, which is created by weak spikes in solar wind strength, makes it difficult for La Niña to develop.
http://www.bom.gov.au/archive/oceanography/ocean_anals/IDYOC007/IDYOC007.202109.gif
Surface temperatures in the central Pacific are dropping by leaps and bounds. Each spike means a weakening of the east wind.
The difference in the increase in solar activity in 2011 and in 2021 is very well illustrated by the level of galactic radiation.
https://cosmicrays.oulu.fi/
This article highlights the most important “mathematical modelling” I was taught. I think it’s still more than valid.
NO MODEL IS VALID OUTSIDE IT’S MODELED RANGE”.
The problem for climate models is in “adjusting” it to match a certain data range. Once the modeler does that it ties the model to the arithmetic. When the “data” (i.e. the modeled weather) changes the model no longer necessarily works.
The ass grabber is that weighting the model in certain ways implies an actual link to the weather being modeled that is simply not there. The math and arithmetic does not predict anything except what has been programmed into it. All the modeler can do is wait a few years and “readjust” the model to also fit the newly accumulated data.
A good example is solar effects. Most of the modelling used data from both active and quiet solar atmospheres. A reliable model for sunspots was developed that worked. Now we are at a predicted solar minimum. The insolation has changed in many ways due to the reduced sunspots, changing the earth’s weather.
The solar cycle is actually a very good example of how to predict a future condition. The solar scientists have developed an effective model of solar activity. The future solar “weather” prediction was correct within a couple weeks or so, in a 22 year cycle.
Climate modelers and their supporters should learn a lesson. It’s hard to predict what the money sharks swimming behind the swarms of dollars, pounds, schekels, rubals…… want.