Reposted from the Cliff Mass Weather Blog
More people died last night in the New York area from the “remnants” of Hurricane Ida than over Louisiana and Mississippi as one of the most powerful hurricanes of the century made landfall on a low-lying coastal zone. (Current count: about two dozen in the NY area, about 8 in Louisiana)
Think about that. And as I will suggest in this blog, we can do much better, both in terms of forecasting and communicating serious weather threats. There are investments and new policies that are needed.
Heavy rain, flooding, and even tornadoes struck in a relatively narrow band stretching southwest-northeast from Pennsylvania and New Jersey, through New York, Connecticut and Massachusetts, as shown by a recent precipitation analysis by the NOAA/NWS Weather Prediction Center for the 48-h ending 6 AM EDT this morning (see below).
A fairly large area of more than 6 inches of rainfall, with some locations hitting 8-10 inches.
Much of that rain fell during short intense bursts of precipitation associated with thunderstorms. Newark, NJ, experienced 3.24 inches in one hour, with NY Central Park hit by 3.15 inches in one hour. Both are hourly records for those sites.

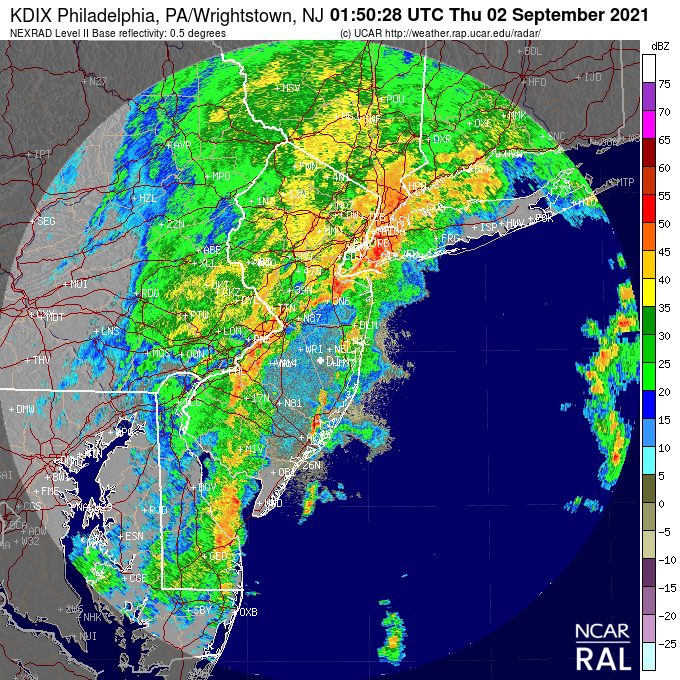
The intense convective (thunderstorm) nature of the rain is illustrated by a weather radar image at 9:50 PM EDT last night, with the red colors indicating extraordinarily high rainfall rates.

After landfall, Hurricane Ida transitioned into a tropical storm and then underwent extratropical transition in which it took on the characteristics of a midlatitude cyclone. The National Weather Service sometimes calls the resulting storm a Post-Tropical Cyclone.But there was a real danger in this transition.
Extratropical cyclones have strong upward motion, often associated with frontal zones, where temperatures and winds change rapidly. And tropical storms undergoing transition often entrain large amounts of tropical moisture that can result in heavy precipitation as the moist air is forced to rise by the storm circulation. This moisture can be converted to rain very rapidly in strong thunderstorms/convection.This is exactly what happened last night.
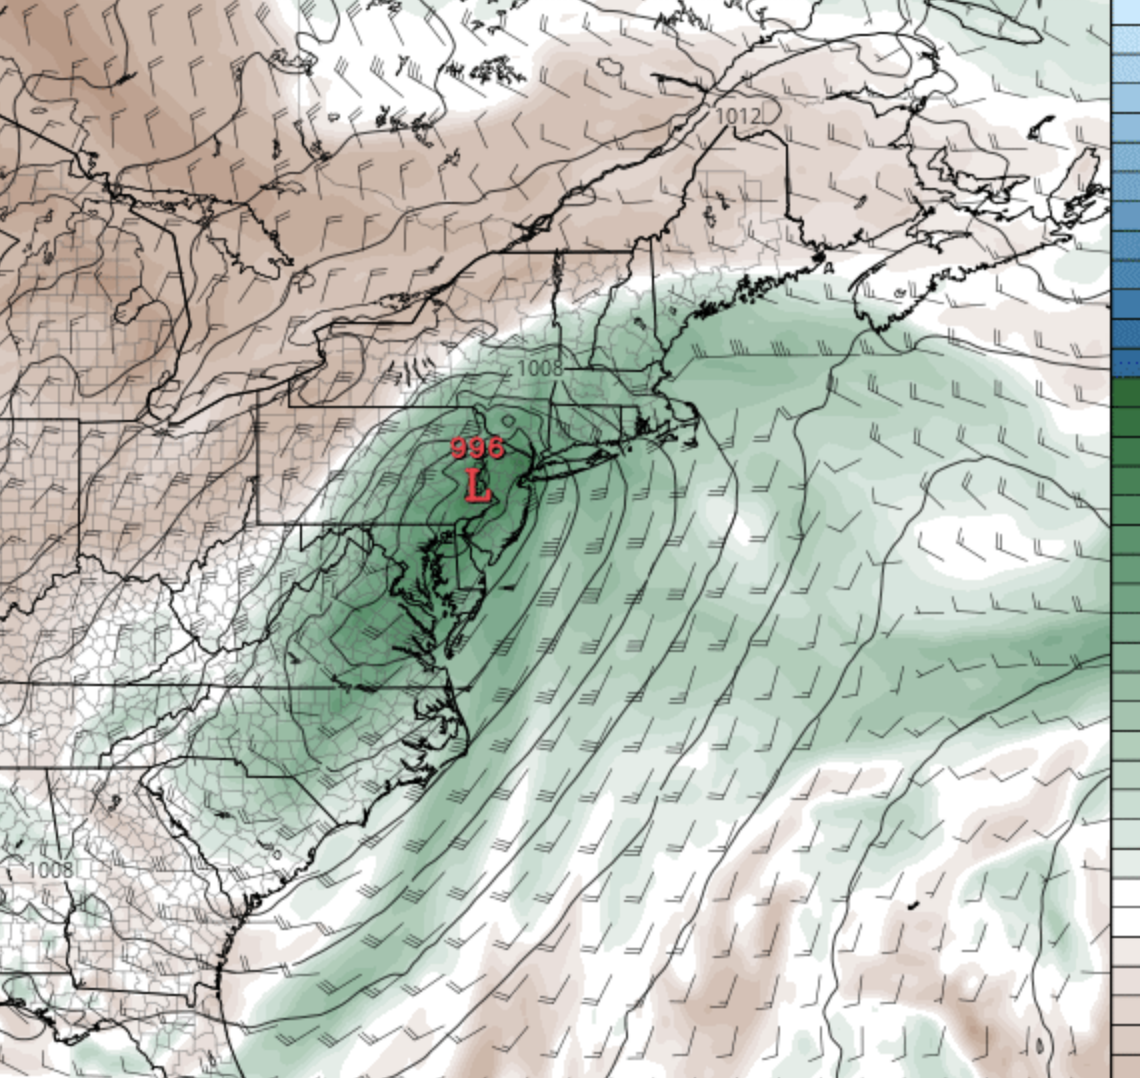
Below is a map of sea level pressure and atmospheric moisture (called precipitable water) for 10 PM PDT last night; you can see the low-pressure center and the plume of moisture (green colors) moving in from the southwest.

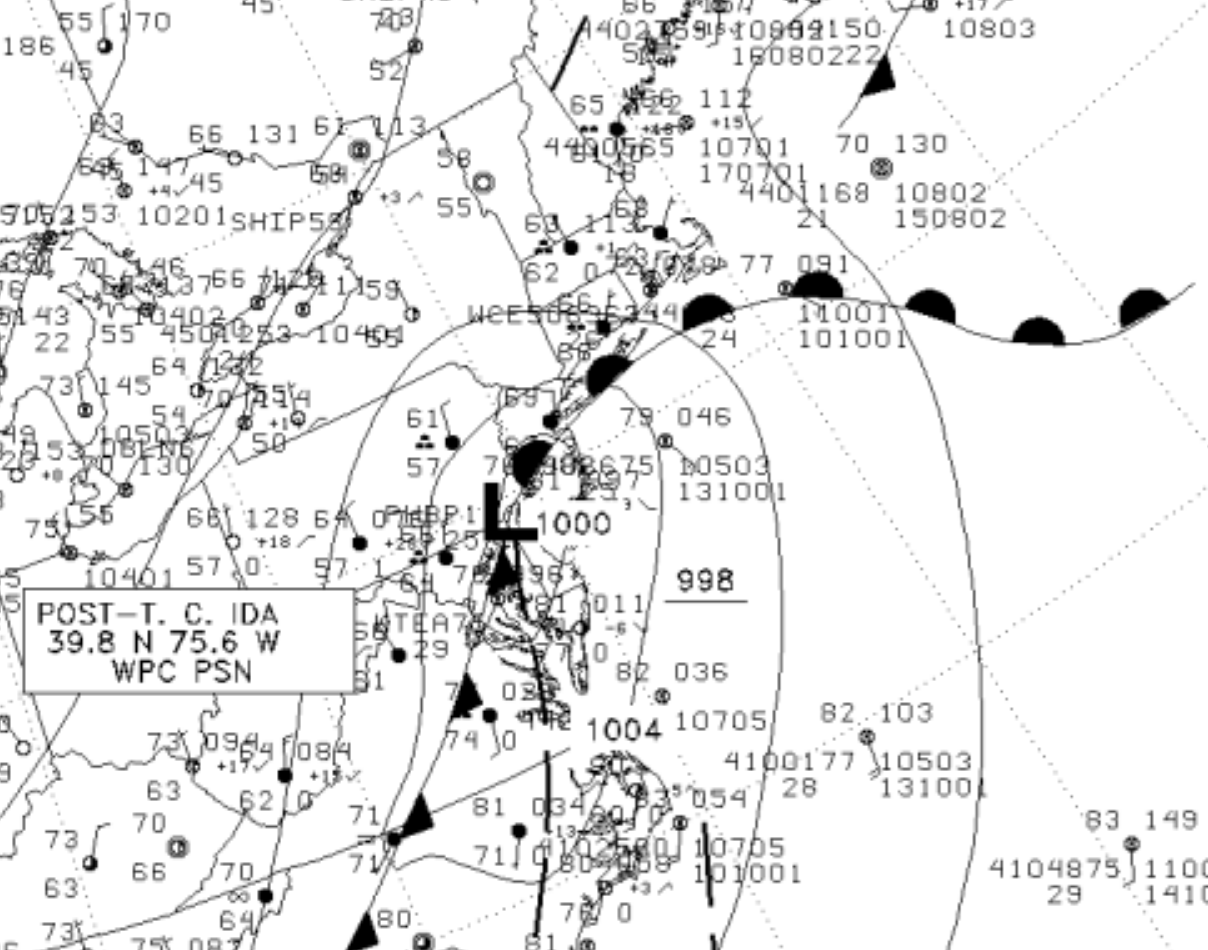
To the east of the low center, there was a warm front, as indicated by the National Weather Service analysis for 8 PM EDT (indicated by the black half circles)

The warm front had warm, southerly winds on the south side and cooler, easterly winds on the north side, with the warm, moist, unstable air to the south forced to rise by the front, resulting in heavy convective showers to the north of the line. That is why the intense precipitation paralleled the front.
The Forecast
My colleagues at the National Weather Service had warnings out much of yesterday for heavy precipitation and the potential for flash flooding, with a flash flood watch out more than a day ahead of time.

Our models were useful but had some issues in both intensity and position. High resolution is critical for this kind of forecast for many reasons, including the convective (thunderstorm) nature of the heavy rainfall, and the sharp frontal boundary that helped produce the rain. 3-4 km grid spacing is a minimum that is viable.
The highest resolution model run by the National Weather Service several times a day is the HRRR model….the High-Resolution Rapid Refresh Model, run with 3-km grid spacing. Its total precipitation for a run starting at 8 AM on Wednesday for precipitation for the next day showed the band, but it was displaced a bit north and somewhat underplayed the precipitation intensity.

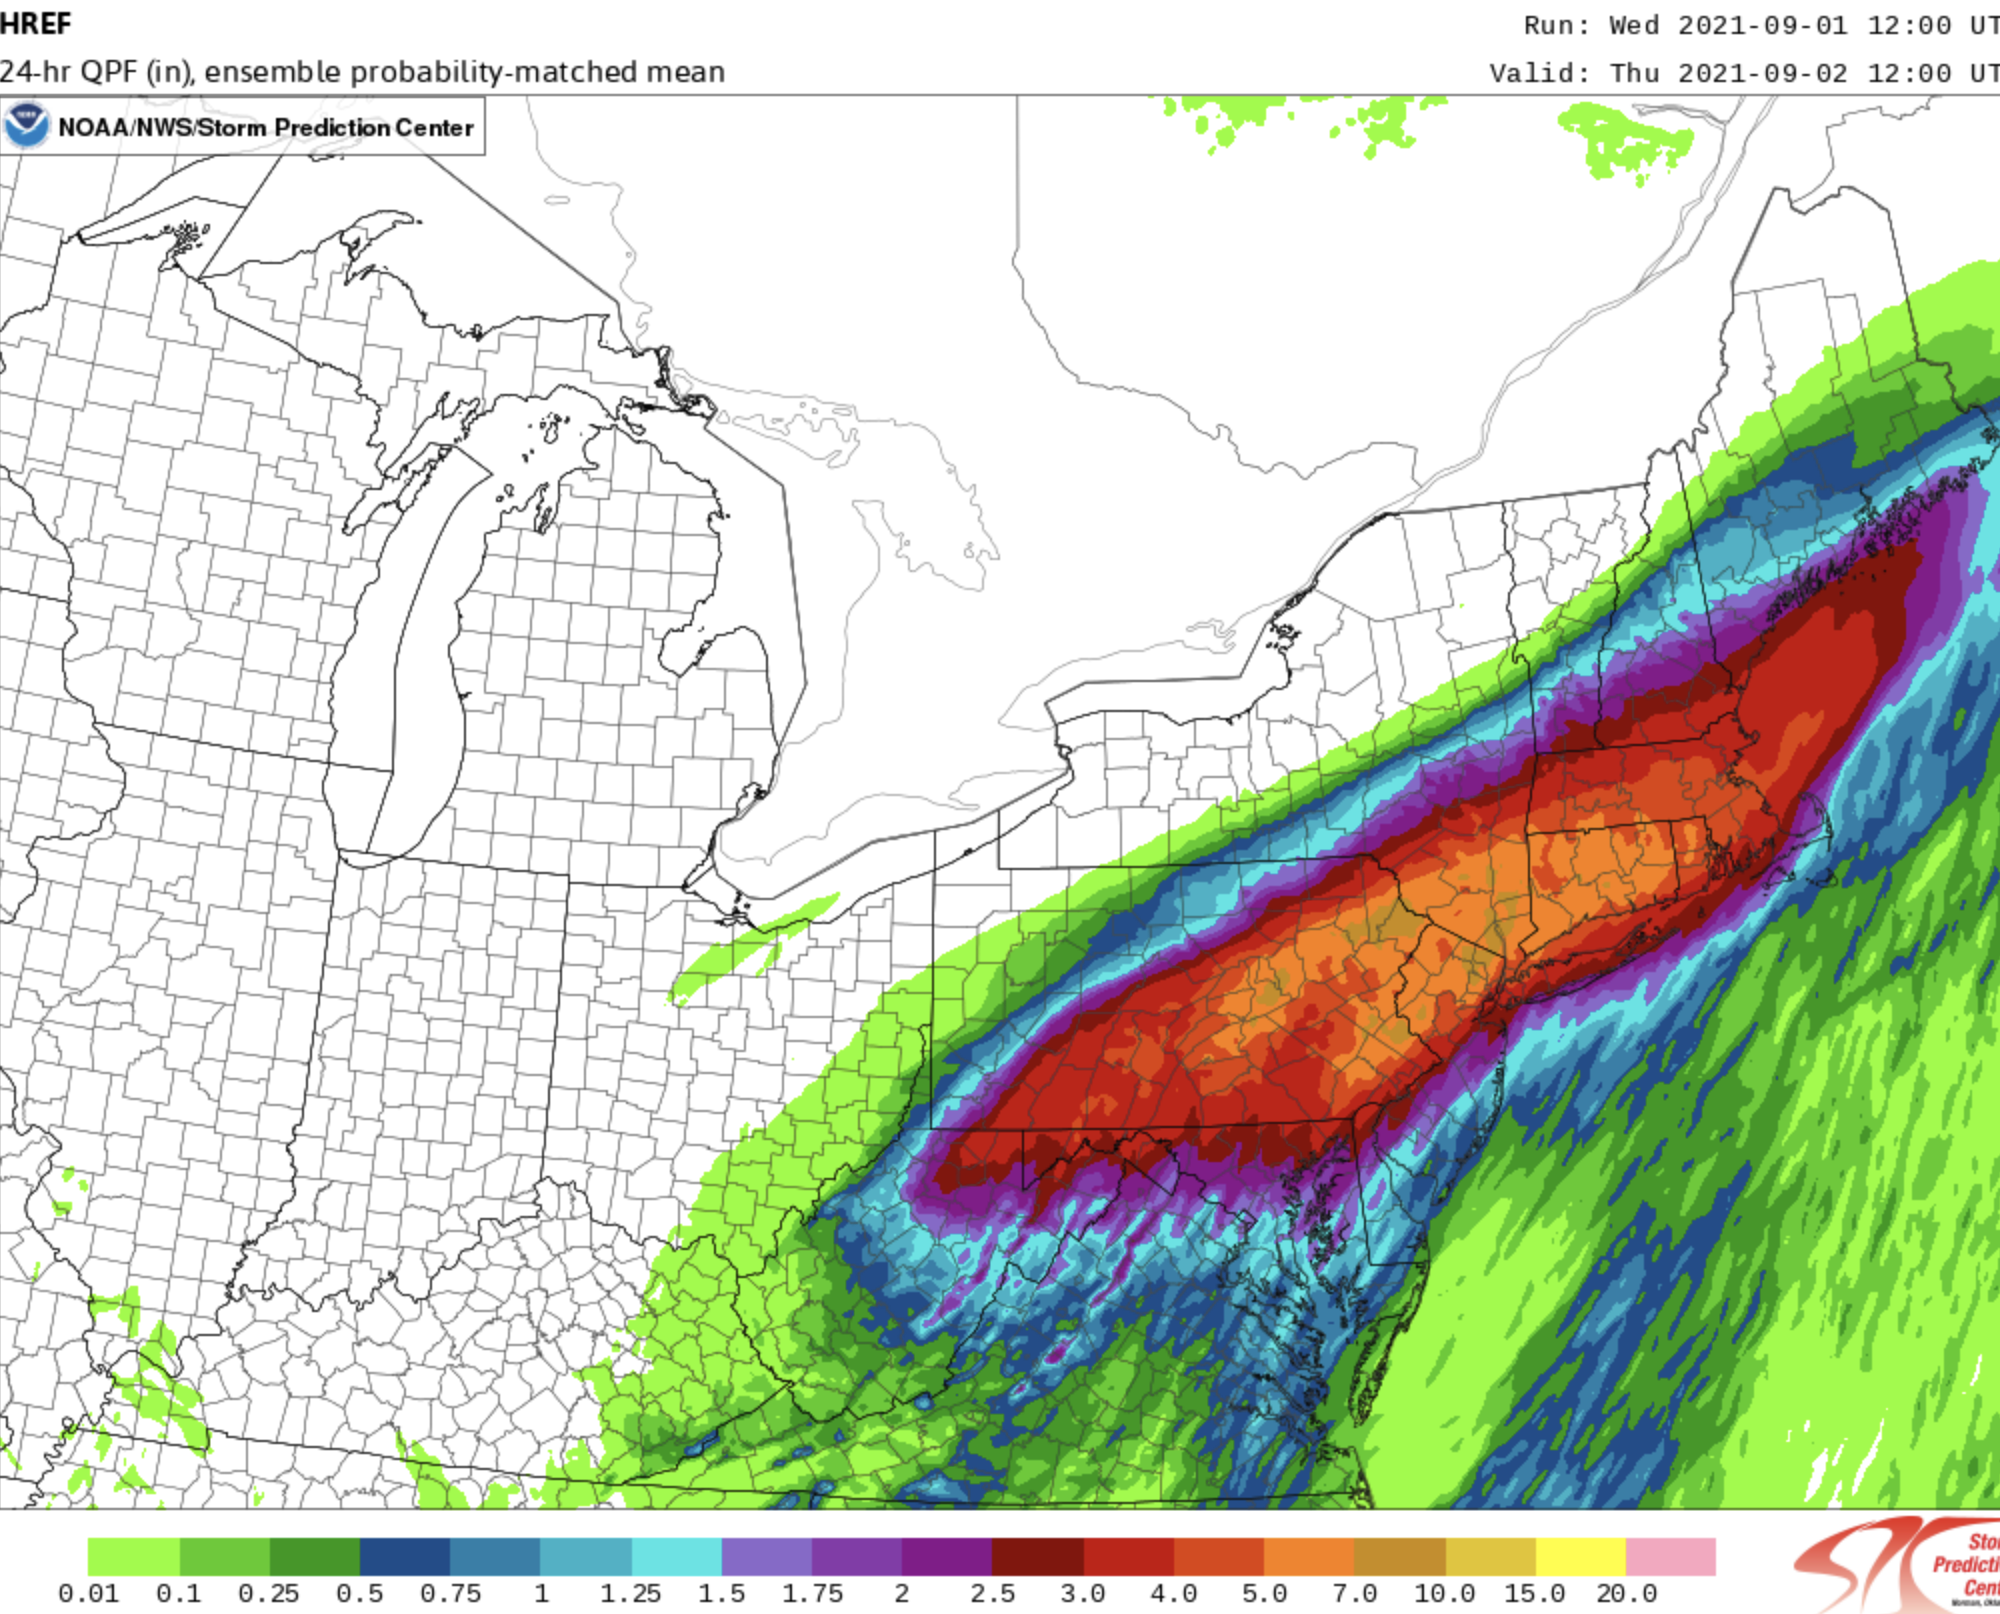
The National Weather Service also runs a small (7-8 member) ensemble of several high-resolution simulations (around 3-km grid spacing), called HREF A statistically enhanced mean of these runs (starting at the same time) is shown below. Better.

Everyone involved in numerical weather prediction knows what this country needs to get such forecasts correct: a relatively large (30-50 member) high-resolution (3-km or better for the grid spacing) ensemble of forecasts that are carefully calibrated to give good probabilistic/uncertainty predictions.
Committee after committee, workshop after workshop, have recommended this. The National Weather Service’s own modeling experts say the same thing.
But the investment is never made to do this. This means acquiring the necessary computer resources and building the modeling/statistical post-processing system. Very, very frustrating that this critical capability is pushed off into the future. (Senator Cantwell please take this on!)
Communication
We obviously failed last night. Around a dozen people died in flooded basements. Many people took to the roads that were flooded out. Abandoned cars were everywhere.
There are two stages to the warning process based on time. Yesterday, hours before heavy rain, it was clear that a serious event was in store and people had to be warned in the strongest terms to stay off the road and to prepare.
By late in the afternoon it was clear that a severe event was about to take place, and we needed to get the message to folks not only to stay off the road but to get out of low-lying basement apartments. That did not happen.

Newark Airport
There is no reason why so many people had to die last night from an event we knew was coming and which we could watch unfold with weather radar and surface observations.
Ida weakened after coming on shore and dropping below TS intensity in MS, remaining weakened thru MS, AL, TN, KY, WV but then strengthened by around 10 mph with rains and severe weather intensifying when approaching the Northeast.
It was NOT global warming/climate change that caused that but instead, was from the -NAO in the Northeast which is actually a cold weather pattern!
https://www.marketforum.com/forum/topic/74503/#74550
A previous hurricane remnant had passed over the area and path that Ida followed, so the ground was saturated before Ida passed and Ida’s rain had nowhere to go since the ground was already soaked, so it filled the streets and homes instead.
A dangerous tropical storm is approaching the Caribbean and may reach North America.
View the latitudinal jet stream in the North Atlantic. It causes the tropical wave to move westward.
Here’s a picture of the tropical storm (marked):
https://earth.nullschool.net/#current/wind/isobaric/500hPa/orthographic=-84.37,37.02,483/loc=-44.815,15.837
Another Cliff Mass fantasy.
Weather prediction has gotten worse as time, funds and personnel are devoted to raising global warming alarmism.
Visitors to this blog, WUWT have been raising hue and cry about the failures of NASA and NOAA along with al of their sister agencies regarding the huge wastage of funds, time and resources preparing delusional models.
“By late in the afternoon it was clear that a severe event was about to take place, and we needed to get the message to folks not only to stay off the road but to get out of low-lying basement apartments. That did not happen.”
Those warnings were given, repeatedly. Some people didn’t heed them A few miles from me the road was flooded (record level for that stream by a foot). At 4am someone drove into it and had to be rescued from the roof of his car by helicopter. A mile away on the other side an EF0 tornado touched down that evening. We’re not used to that here.
What really caused Ida to strengthen in the Northeast that included the massive rains…………..the -NAO:
https://www.marketforum.com/forum/topic/74503/#74550
The forecasts are were useful but had some issues in both intensity and positio, with the highest resolution models off to the north and underestimating intensity
The mayor of NY stated he was told 3 to 6 inches. NYC got 9. And these inaccuracies are from less than 24 hours out
How can anyone believe forecasts for 30 years in the future??
A north Atlantic jet stream moves the hurricane westward.
http://tropic.ssec.wisc.edu/real-time/mtpw2/webAnims/tpw_nrl_colors/natl/mimictpw_natl_latest.gif
At my house in E Central Bergen County NJ my Davis tipping spoon rain gauge recorded 3.41” of rain between 9 and 10:00 PM accompanied by strong gusty winds and nearly continuous lightning. For three minutes from 9:18 to 9:20, the instantaneous rain rates were 12.80, 11.29, and 16.94”
per hour with 0.41” of rain during those three minutes! There was scattered severe flooding in town with a bridge and several roads washed out. We were lucky – because we live on the side of a small hill, other than some seepage through walls and floor in one side of our basement, we came through unscathed. Hats off to our town’s emergency services and to the dozens of mets who predicted the cloud bursts at least two days in advance.
Most of the NYC deaths occurred in illegal basement apartments. It wasn’t global warming that killed them., it was lack of enforcement by the NYC Dept. of Buildings. I live in Queens.