Reposted from NOT A LOT OF PEOPLE KNOW THAT
By Paul Homewood
More, disgraceful reporting by the BBC (complete with a disgusting use of a photo of the Turkish wildfires):

July was the world’s hottest month ever recorded, a US federal scientific and regulatory agency has reported.
The data shows that the combined land and ocean-surface temperature was 0.93C (1.68F) above the 20th Century average of 15.8C (60.4F).
It is the highest temperature since record-keeping began 142 years ago. The previous record, set in July 2016, was equalled in 2019 and 2020.
Experts believe this is due to the long-term impact of climate change.
In a statement, the National Oceanic and Atmospheric Administration (NOAA) said that July’s “unenviable distinction” was a cause for concern.
“In this case, first place is the worst place to be,” NOAA administrator Rick Spinrad said in a statement.
“This new record adds to the disturbing and disruptive path that climate change has set for the globe.”
The combined land and ocean-surface temperature was 0.01C higher than the 2016 record.
In the Northern Hemisphere, land-surface temperature reached an “unprecedented” 1.54C higher than average, surpassing a previous record set in 2012.

https://www.bbc.co.uk/news/world-us-canada-58208792
Meanwhile, back in the real world, July temperature anomalies even according to NOAA themselves are well below the peaks of 2015 and 2016, and barely higher than they were two decades ago:

https://www.ncdc.noaa.gov/cag/global/time-series/globe/land_ocean/all/7/1980-2021
And the claim that they know the world’s temperature to one hundredth of a degree is ridiculous. Far from the full global coverage implied by the BBC’s map above, below is the actual coverage:

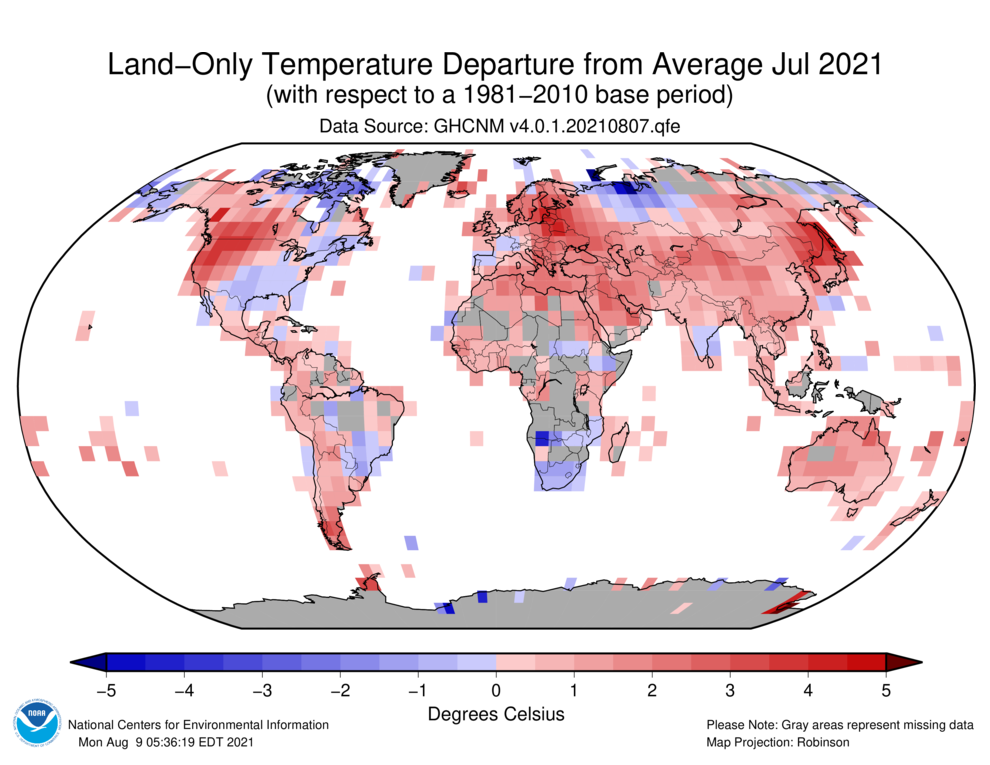
Large parts of the world have no coverage at all, and much of the rest is affected by UHI. In contrast, satellites offer virtually 100% coverage, other around the poles, and are not corrupted by UHI. Data from these satellites indicate that atmospheric temperatures are no higher now than in 2002:

https://www.nsstc.uah.edu/climate/
NOAA July Maximum temperature since 1895, which shows 27 different years of a hotter July than the July of 2021,
LINK
Sun.
That is a graph of the US.
As I continually marvel at when visiting here – the US is not the globe.
Sorry.
We are talking of the contiguous US AND the other 98.5% of the globe here.
Which did have it’s hottest month on record (according to GISS).
And yes, the US was v hot in the dust bowl years.
A combination of a prolonged +PDO + AMO and feedback from US farming practises.
That that was the case does not mean that the world is not now warmer overall.
Yes I knew that it was the US. it is right there on the chart, and I CREATED the chart!
DOH!
Here is the well covered global map you overlook:
See the many holes there are but well covered in America, while Greenland (cold) and Antarctica (very cold) barely covered.
The Science wasn’t looking
Look at the figures for 1934 and 1936 at that link.
July of 2021 shows 1.05F above the mean.
July of 1934 shows 3.87F above the mean
July of 1936 shows 4.16F above the mean
That’s weird. I got the link to load the first time I tried it, and is where I got the figures above, but when I try to go back to it, I don’t get the numbers rendered on the page.
I don’t know what to make of that.
Call me a neophyte, but these stories of excessive heat seem to coincide with summer months. Have our beloved climate warriors locked onto something?
Don’t hold me to this, but I suspect that the temperatures will be much lower 6 months after the July highs.
My statement about climate that has been for last 30 years is that readings in UHI and Airports have increased due to activity while very little increase is shown elsewhere.
Notice how the satellite Monthly Global Lower Troposphere Anomaly graph mirrors the occurrence of El Nino and La Nina ENSO events over the last 40 years. Of course, we launched those satellites initially to record the lower troposphere temperatures, because that’s where the signature of human caused global warming was to be found according to theory.
No one has ever claimed that ENSO is a result of human emitted greenhouse gases, because they can’t. There is no physical possibility of CO2 warming the oceans that much or that quickly.
So we are back to hyping ground based measurements that were deemed unfit for purpose in the 1970’s
Congratulations NASA. You wasted billions launching satellites to collect data for 40 years that you now ignore.
Blocking events (i.e. greenhouse effect).
https://www.drroyspencer.com/2019/11/california-wildfires-climate-change-and-the-hot-dry-windy-fire-weather-index/
In 2018, a paper was published by a university research meteorologist and U.S. Forest Service (USFS) employees from three different USFS offices that describes a simple meteorological index related to wildfire risk. They call it the Hot-Dry-Windy (HDW) index, which is simply the product of (1) the surface wind speed times (2) the water vapor pressure deficit. The vapor pressure deficit uses the same information as relative humidity (temperature and dewpoint temperature), but it is a difference rather than a ratio, which better measures the potential of air to rapidly remove moisture from dead vegetation….
…most of the historically significant wildfire events occur when COOL and DRY Canadian high pressure areas move south over the Great Basin region, causing strong downslope easterly winds (Santa Ana winds, Diablo winds). Global warming, in contrast, is supposed to result in WARMER and MOISTER air.
I wonder if they are getting a news feed from these people https://coveringclimatenow.org/. A lot of news outlets seem to be using it
Consult “TheWayBackMachine”.
(More accurate than a DeLorean!)
After reading some of the comments and checking the data, according to NOAA this July WAS the hottest globally by 0.01C and the presented data on its website are consistent. The graph on the article is showing deviation for all the months thus its misleading. Regardles of the validity, the trustworthiness of NOAA or the importance of it (0.01C is well…lets say at least, not significant)
Now my general view is that the raw temperature record data should be made public and verifiable by a blockchain, along with the complete station data, exact locations, instrument types, calibration dates, serial numbers etc and ofcourse the complete methodology of adjustments and calculations (actualy the source code) to derive to the exact presented results from the raw data. This is the only way, because politics and big money are involved in the “green-business” and thus suspision is well justified. Ultimately people are paying for this shit, they will pay the “green-bill” or suffer the consequences of the aleged AWG, so they have the right to know and verify everything.
Dreamer…
Does NOAA claim that the 0.01 deg C is statistically significant?
Does NOAA claim that the 0.01 deg C is statistically significant?
Yes.
Statistically it makes it the hottest month ever beating the 4 years that were 0.01 C cooler than it.
The fact that July is the hottest month anyway and that the anomalies in July have always been much lower than the anomalies in other months is not mentioned.
–
Everything has to reah a peak before it subsides. Hopefully we have reached such a peak as this is spread out over 6 years.
The good news is that 2021 is well on the way to dropping down to 10th place overall without a new La Nina and may well go under that if a true large La Nina develops this year.
Global temperature averages are utterly without any meaning.
No measurement, or even calculation, is known exactly. There is always some uncertainty. The NOAA press release, which claims the global record, does not state what the uncertainty is:
https://www.noaa.gov/news/its-official-july-2021-was-earths-hottest-month-on-record
Basically, if two means have similar uncertainties, and an overlap of the 1-sigma uncertainties, then it is impossible to determine which ‘measurement’ is more probable to be the warmest. They should be called a statistical tie. As usual, NOAA/NASA doesn’t provide the public with the information necessary to validate their claims.
Personally, I don’t think that the uncertainty is as small as +/- 0.005 deg C for any recent month, which is what it would have to be for the “1” in 0.01 to be a significant figure. I have recently seen some government provided mean temperatures and the associated uncertainties. They did not follow the recommended protocol of rounding off the uncertainty or mean to conform to the parameter with the least precision, thereby implying that they knew both values to a greater precision than warranted.
Now my general view is that the raw temperature record data should be made public and verifiable by a blockchain, along with the complete station data, exact locations, instrument types, calibration dates, serial numbers etc and ofcourse the complete methodology of adjustments and calculations (actualy the source code) to derive to the exact presented results from the raw data.
It is not (yet) on a blockchain but most of your wishlist is out there. The most widely-used source dataset is the Global Historical Climate Network (GHCN). Both the raw and adjusted data and metadata can be downloaded from this ftp site ftp://ftp.ncdc.noaa.gov/pub/data/ghcn/v2.
Some documentation here
Taking the NASA GISTEMP global temperature dataset as an example, all the data and code are 100% open source. . The clear climate code project was set up to reproduce GISTEMP independently,which they did – basically by rewriting the code from scratch and all their code is up on Github. .
Of course there are limitations, the agencies that produce the global temperature time series do not collect any data themselves, it originates from National Weather Services, some of whom regard the data as intellectual property with a commercial value and so only provide it under licence, though I believe those issues have now been ironed out. Also the clue is in the name, these are weather stations that were almost all originally set up to privide data for local weather forecasting, rather than long term climate monitoring, and in the US at least were largely manned by volunteers. So is every piece of paperwork for every station going back over a century available? Nope, but what we have is more than enough to provide a robust estimate of global temperatures, as I recall the degrees of freedom in the climate field is around sixty.
John Phillips has an excellent post already. I’ll add a couple of other relevant links.
The source code for the PHA software that produces the GHCN-M qcf (adjusted) file can be found here.
The Historical Observing Metadata Repository (HOMR) can be found here. This is where information regarding the history of station changes like relocations, instrument changes, etc. can be viewed. Note that station history may not include all changes or even be available at all for some sites. This is why PHA was designed to work with incomplete or nonexistent station metadata.
Another one of those lies that travel around the world faster than the speed of truth.