Originally tweeted by Roger Pielke Jr. (@RogerPielkeJr) on August 9, 2021.
IPCC AR6 WG1 🧵
Some initial comments
Think of these as working notes
Comments welcomed
Let’s go . . .
Let’s start with scenarios
This is rather huge
“In general, no likelihood is attached to the scenarios assessed in this Report”
So that means that users of the scenarios have to independently assess likelihoods
That said: “the likelihood of high emission scenarios such as RCP8.5 or SSP5-8.5 is considered low”

They also said that an appropriate scenario for “absence of additional climate policies” (aka BAU) is “RCP4.5, RCP6.0 and SSP2-4.5 scenarios:
They said it, kudos to IPCC WG1🔥🔥

I won’t get down too far in the weeds but the IPCC WG1 has returned to the SRES storyline approach
That means that interpretation of the scenarios and the resulting projections will be trickier than saying that the IPCC is projecting X or Y future
It is a healthy development!

Underscoring this absolutely essential point
“the socio-economic assumptions and the feasibility or likelihood of individual scenarios is not part of the assessment”
Fortunately, you are in good hands here as we have been studying feasibility in great detail, more on that later

Very important:
“IPCC is neutral with regard to the assumptions underlying the SSPs”
So IPCC recognizes that 8.5 scenarios have “low likelihood” but nonetheless choose to remain “neutral” with respect to scenario assumptions
As we will see, this is not quite right in practice

So which scenarios does IPCC focus AR6?
If “neutral” we might assume a fairly equal focus of attention across scenarios (similar to how SRES was used) since WG1 AR6 judges none more likely than another
On the other hand the literature is heavily biased to extreme scenarios…
So this is a BIG problem
The scenarios IPCC admits are unlikely dominate the report w/ 41.5% of all scenario mentions
The scenarios judged most likely under current trends get only 18.4% of mentions
Implausible scenarios (8.5 + 7.0) total 53% of mentions, more than half!

From AR5 WG1 to AR6 WG1 the emphasis on 8.5 scenarios increased dramatically
Table below shows RCP8.5 mentions in AR5 WG1 were 31.4% of total scenario mentions, that has increased to 41.5% in AR6
Focus on more realistic scenarios (4.5 & 6.0) dropped from 44.5% to 18.4%
Wow

AR5 table in previous Tweet from this paper:
https://doi.org/10.1016/j.erss.2020.101890
The IPCC AR6 WG1 is not in fact neutral w/ respect to scenario assumptions because it has a overwhelming emphasis on unlikely (it’s word), implausible (our word) scenarios
Because IPCC also claims no likelihoods associated w/ scenarios the emphasis on 8.5 needs interpretation
We have already explained the over-reliance on implausible 8.5 scenarios in terms of momentum in science
Other factors at play also
See these two papers:
1-Readable overview (free to read): https://issues.org/climate-change-scenarios-lost-touch-reality-pielke-ritchie/
2-Lots of details (DM for a copy):
https://doi.org/10.1016/j.erss.2020.101890
But with its over-reliance on 8.5 scenarios the IPCC WG1 has set itself up for appropriate criticism from friends and foes alike
The unexpected u-turn in use of scenarios from AR5 has also set the stage for confusion among experts, media and policy makers
This also is big & it’s v good news
The IPCC has for the first time reduced its top end estimate of climate sensitivity
IPCC judges Higher magnitude climate change to be less likely than it has been since 1990
Best estimate remains same, lower end certainty increased as well

Please keep the comments & requests for our paper coming
OK, now to extremes . . .
Ch.8 on flooding:
“the assessment of observed trends in the magnitude of runoff, streamflow, and flooding remains challenging, due to the spatial heterogeneity of the signal and to multiple drivers”
Same as AR5
Are floods increasing? Evidence doesn’t say that
Temperature extremes
Heat waves increasing at global scale (virtually certain)

Heavy precipitation
Frequency and intensity have increased at a global scale (of note, only “likely” >66% certainty)

I’m very happy to see that the IPCC has acknowledged that heavier precipitation does not equate to increased flooding: “heavier rainfall does not always lead to greater flooding”
We explained this in 1999 (Pielke and Downton 1999)😎

Flooding
Confidence in global trends is low
Some places up, some down
Same as AR5
So don’t claim floods are increasing
Don’t say they are “climate driven”

Obviously in the absence of detected trends, there won’t be much ability to attribute
Don’t say floods are caused by, driven by, intensified by climate change. The evidence doesn’t support that.

AR5 discussed “drought”
AR6 discusses 4 types: meteorological, hydrological, agricultural, ecological
Different conclusions for each
Like AR5, little confidence in changes to M or H droughts but medium confidence in changes to A & E

Detecting trends in tropical cyclones remains difficult, same as AR5
There might be trends, but we can’t detect them (I always love this statement, if we can’t detect it, it can’t be that significant!)

This is awesome
A clear indication that I am Voldemort at IPCC 😉
Also clear evidence of cherry picking tsk tsk
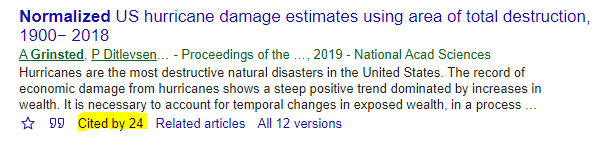
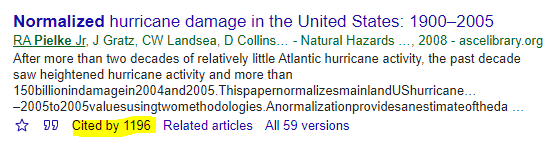
They reference normalized hurricane damage & cite a fringe analysis with 24 citations while ignoring the definitive work with 1196 citations
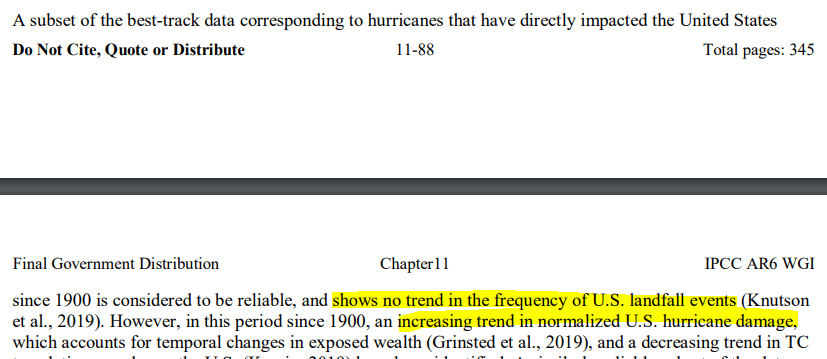
The IPCC really stretches to say something about TCs, relying on a few studies that start analysis in 1980 when much more evidence is available

You know what the IPCC doesn’t mention?
Global TC landfalls (they do mention landfalls in Madagascar and the US)
I wonder why not?
Our dataset was updated & published in recent WMO TC assessment

Curious about what the IPCC forgot to include?
For NA & WP, about 70% of all landfalls, “the overall number of landfalling hurricanes has decreased dramatically since the 1940s, while the number of major hurricane landfalls has shown no trend”
https://rogerpielkejr.substack.com/p/a-remarkable-decline-in-landfalling

Last point on the cherry picking by IPCC
I & colleagues certainly must be the most widely cited authors on extremes & climate not to make it into the IPCC AR6 extreme chapter
It’s fine
Says a lot more about IPCC than it does our peer-reviewed work
Back to the report . . .
Winter storms
Low confidence in past century trends in frequency and intensity

Thunderstorms, tornadoes, hail, lightning
No upwards trends detected
Same as AR5

Extreme winds
A new variable in AR6
Interesting, IPCC finds less extreme winds between 60N (~Juneau) and 60S (~Antarctica), so pretty much everywhere there are people
There goes the derecho attribution

Fire weather
“There is medium confidence that weather conditions that promote wildfires (fire weather) have become more probable in southern Europe, northern Eurasia, the US, and Australia over the last century”

Summary:
Highly consistent with AR5 (of course, just a few more years of data)
Little evidence of increasing trends in floods, M&H drought, TCs, tornadoes, strong winds
But evidence for increases in high temps, extreme precip, heat waves, fire weather, A&E drought
That’s all for now
I’ll now catch up on the many comments
Respond to paper requests
Thanks for reading!
I found this IPCC figure on drought to be surprising No expected increase in drought in most of North America, eastern Australia, Northern Europe, Asia – including India, Russia and China … in other words where almost all of humanity lives This has to be v good news, right?

Originally tweeted by Roger Pielke Jr. (@RogerPielkeJr) on August 9, 2021.
Great summation! Reality continues to intrude on apocalyptic predictions – hurray!
Also.
Typo in the Northern Atlantic and Western Pacific Hurricane graphic – “Hurrcane”
That’s the Dylan spelling: ” There once was a man called the Hurrcane”.
Too bad for Rubin he didn’t die from a fentanyl overdose, otherwise he would have been the champion of the world, or at least of the Left.
Just look at the mess CMIP6 models make of N.Am surface temps:
The early 20th c. warming and drought ridden dust bowl period just did not exist ! If the models can miss something that significant, why the hell would we want to take any notice of any future projections?
Garbage.
The models hindcast a garbage temperature record, which means the models are garbage, too.
Not true, economic growth has been decoupled from volume of stuff for well over a century.
I hate to break this to you Mark but the one thing we all have in common about life is that none of us are getting out of it alive. Sorry I borrowed that, probably from someone on this blog. It was too appropriate for your doom and gloom – rat tat tat.
All of us are going to die even the faceless cultural elite. They, the FCE, just want us to stop using fossil fuel to insure that there is plenty for them and their entitled offspring.
But die we must, all of us, and we would sooner without the life sustaining benefits of all that “Peak Oil” you are always on about. When oil runs out we will adapt to shorter life spans. Until then enjoy it while you can. You can’t take it with you.
What about the evil CO2?
It is a wholly dishonest presentation by the IPCC, hedging its bets whilst encouraging politicians and compliant media to create a false alarm.
Even if the world starts to cool they will just say it is temporary and press on with their authoritarian agenda.
There is no longer any effective opposition to the juggernaut.
I am deeply disappointed by Boris Johnson’s apparent lack of intellectual capability in scientific matters.
“They already admitted it’s cooling”
Exact quote please.
Oh a graph of peak oil count 3
No, LdB, he’s showing Loydo that there’s an IPCC scenario where temperature drops. Let’s be fair. Hopefully he will go into moderation and his repetitive asininity won’t be released, but if he wants to contribute and actually engage intellectually then he shouldn’t be banned.
fair attitude except that … that was NOT what he said and he chose not to respond to the request for a quote.
“They already admitted it’s cooling”
Bullshine.
I was actually just pointing out that it’s not a peak oil graph as LdB commented. It’s his lame evidence that the IPCC “admits it’s cooling” because in one scenario things cool.
Except: “Global surface temperature will continue to increase until at least the mid-century under all emissions scenarios considered,”
So he’s not even wrong.
Except they have not considered the sun.
Surprise coming.
Eton and Oxford? What did you expect? It could have been worse – we recently had a Minister for Energy who didn’t know he’d need to store the electricity from the huge solar farms he was proposing. (PPE, nuff said)
JF
Clearly we need certain qualifications to be allowed to vote so there is an adequate level of intelligence and understanding and life experience to avoid electing eejits like this.
For starters: at least 30, holding down a real productive job, not depending on the state.
Peak oil count 2
The little head that does his thinking isn’t the pumpkin on his shoulders.
Stephen Wilde, part of this review of AR6 includes so many weasel words (implausible, plausible, not likely, medium confidence, low confidence, etc) that one suspects it was written by weasels, and for the use of other weasels.
A bazillion words to communicate very little.
Absolutely none of the nuance described by Pielke has made it into any of the pronouncements by the UN General Secretary, government leaders, and the mainstream media. All they are doing is shouting “We’re all doomed unless you do exactly what I say” yada yada yada.
By the way, statistically and honestly speaking, the phrase “no trends” is completely misleading. There is always a trend .. trending up, trending down, or trending the same.
I thought Pielke did an excellent job of of summarizing the new IPCC tour-de-force of climate alarmist unsubstantiated assertions.
Nothing has changed. The IPCC still cannot cite evidence that humans are causing the climate to be worse than normal because of human activity.
It could all be natural variation (Mother Nature), and they can’t prove otherwise. That’s 4,000 pages and not a shred of evidece in there.
What did you expect? They’ve self-promoted themselves to the point that they will come under fire from all sides as soon as they get something wrong. So they state they are scenario neutral, weasel their way out of making a definitive stand and hope they can weather the coming storm without too much damage. Bunch of cowardly self-serving hypocrites. The only way to oppose these people is to sideline, ignore and defund them – when they have to pay for this nonsense out of their own pocket, we may see a difference of opinion.
Even when they are close to being honest, they utilized language meant to deceive.
What layman, or MSM reporter understands that in IPCC jargon “medium confidence” is 5 out of 10? (In other words just as likely to be untrue as true; a flip of the coin.)
The odds of anything happening is 50%; it either happens or it doesn’t.
“It is a wholly dishonest presentation by the IPCC, hedging its bets whilst encouraging politicians and compliant media to create a false alarm.”
That’s what it looks like they are doing. Politics.
Observations are tracking closest to RCP 2.6 without serious mitigation happening…
Peak oil count 4
Mr. Ingraham – you are either extremely juvenile physically or just mentally – either way this annoying habit of yours isn’t going to get you what you want. You won’t be banned for this – you’ll just be held up as an object of ridicule and contempt. Either contribute or leave of your own free will.
Not sure I agree. He should be banned Mr. Ingraham is doing the equivalent of sticking his fingers in his ears and yelling, solely to draw attention and disrupt the conversation. I don’t mind – in fact, I enjoy – contrary opinions. But Mr. Ingraham offers nothing, and is just pushing worthwhile comments down the page.
Listen to what Richard said, Mark.
All he wants is attention.
And since none of that can be empirically shown to be caused by CO2 aside from their “belief” in their pet hypothesis, “mitigation” is clearly pointless.
“mitigation” is clearly pointless.”
The point I was making. Observations are tracking the maximum mitigation scenario while emissions continue to grow so what is their justification for it?
Hypothetical speculation isn’t science but it is being presented as being unquestionable fact by the media.
Figure SPM.1 shows their modelled climate vs observations.
The most obvious feature is the grossly exaggerated volcanic cooling in panel b. This over cools the entire 1960-1990 period which is supposed to be the main calibration period. The models then have to over heat after 1995 to catch up.
That will obviously lead to exaggerated future projections.
As I’ve been saying for years, the key “trick” here is that they exaggerate the cooling volcanic forcing to enable them to exaggerate the CO2 warming.
In Hansen 2005 they dropped scaling of AOD ( the measurement of optical transparency of the atmosphere ) from 30W per Dobson unit to 20W. This allows them increase the poorly constrained positive feedbacks ( water vapour, clouds etc. ). They go further than that because the cooling is still too strong as seen here.
By arbitrarily reducing the AOD scaling factor, it allows them have much higher climate sensitivity.
This leaves them with grossly exaggerate GHE which goes off the chart as they extrapolate wildly outside the data period.
Also seen is the total inability to reproduce the 1910-1945 warming which is modelled as nothing more than a gradual rise from 1880 to 1960.
The models capture NONE of key features other than a general rise over 150y. That could be modelled by literally thousands of variations of model parameters to that kind of fidelity.
To the limited extent that their mediocre reproduction follows the climate record , it’s a case of right for the wrong reason. And it’s not even close to being right.
figure SPM.2 shows “internal variability” contributed ZERO to the warming since 1850.
Natural climate variability conveniently ceased at the begining of the “industrial period”.
That is true CLIMATE CHANGE DENIAL.
Peak oil count 5
Actually Figure SPM.1 shows their modelled climate vs observations and shows “internal variability” contributed ZERO to the warming since 1850. This denies the climate bounce since the Little Ice Age so the internal variability shown is a flat out misrepresentation.
It is indeed curious that we’re supposed to believe that the planet naturally cooled until c. 1850 and would then have magically stayed at that temperature for 170 years. Looks complete BS to me.
Maybe you are confusing Arctic sea Ice or ocean “acidity” The temperature is NOT shown as falling. What are you on about?
Spamming.
If taken at face value it’s apparent from graph (a) that Climate Change™ arrived just in time.
‘simulated natural only (solar & volcanic)’.
Simulated: feigned, fake, mock, pretended, affected, assumed, counterfeit, sham, insincere, not genuine, false, bogus, spurious … artificial, imitation, fake, false, faux, mock, synthetic, man-made, manufactured, ersatz, plastic (Oxford).
I notice the Medieval and Roman Warm Periods is omitted from the reconstruction. No model can account for these, so they are best ignored. The “splicing” of observation and reconstruction is reminiscent of “Mike’s Nature Trick”.
I agree with John Cristy when he said that in any other branch of science the hypothesis raised by climate models would be rejected.
Interesting that human influence apparently starts with the invention of the thermometer by Fahrenheit in 1714. So it is quite possible that wider variations in temperature over multiple centuries simply don’t show up in pond pollen and tree ring analysis.
“The most obvious feature is the grossly exaggerated volcanic cooling in panel b. “
Not at all obvious to me I’m afraid.
Do please explain?
All I see is trend excluding anthro drivers with 95% cls.
See the Pinatubo event at 1991
“Also seen is the total inability to reproduce the 1910-1945 warming which is modelled as nothing more than a gradual rise from 1880 to 1960.”
Again something I do not see.
The model does a damn good job of reconstructing it and it clearly shows a distinct levelling off from 1940 to the dip at 1960, which occurred ….
Hint: try putting in a smoothed obs trend-line and stop eying the variability.
A model could never reproduce those.
I must ask of what miracles you expect from models?
They should not be expected (in the real world) to identically mirror actuality.
medium confidence…. low confidence… likely….
They confuse me. I thought that the science was settled. Now they are implying it is not?
;-p
After riding the alarmism they’ve created, it has finally occurred to them that they’re heading for the rocks and they need to weasel their way out of any possible consequences or repercussions – hence the backtracking, buckpassing and CMA behaviour.
What a spectacle the subsidized scientologists have made to sound alarmist for their pay masters: FAR, SAR, TAR, AR4, AR5 now ARS or SARS
No kidding, what more do they need to publish 😜
Will, or can? Anyway, are you hoping that Yellowstone blows a hole in North America?
The BBC is working itself up into a frenzy now thar the report is out. Every change in the weather and every heatwave, cold snap, drought and flood is attributed to climate change and the rise in CO2, and now they have also added methane to the list of nasties.
This morning’s scare was on wildfires, with any fire blamed on Climate Change whether on heathland or woodland. As if they were a new phenomenon, I can remember frequent fires on local heathland sixty years age, mostly caused by human carelessness such as a dropped cigarette end.
Today’s example was an interview with a chief fire officer from Northumberland where he surmised that fires were becoming more frequent, but finished his comments with the statement that the woodland fire quoted as an example was probably caused by someone wild camping or using a portable barbecue. So the primary cause was not climate change but again human carelessness.
(I’m surprised that this comment wasn’t edited out by the BBC.)
How many wildfires are caused by arson?
A conspiracy theorist might suggest that it is being used by activists to add more headlines to the narrative in the run up to COP26.
There’s no need for arson.
Fires in summer are normal. As are flash floods.
And with global news it will always be possible to find something happening somewhere.
Neither you are, mate, but you are good for a laugh, keep it up.
What a shocker. You live in the land of fruits and nuts. In your mom’s basement?
Go speak to your power company. How about a class action to sue them for all the fires they caused.
Your first mistake is assuming there is a “normal.” With the weather, you get what you get. What they call “normal” is nothing more than an average, which in turn, is nothing more than a midpoint of extremes. There is no “normal.”
It is foolish to say there is no normal.
We do not go from Venus to Mars weather in any time frame we might dream of.
Take a measurement time frame. Calculate standard deviation. Normal is three SD either side of mean.
Mr. ingraham: I beg to differ, last year was normal in CA. As in, SNAFU.
And largely due to mismanagement of the forests.
Sky News, the BBC etc, didn’t do much global televised reporting on extreme weather events, 150 years ago. Not even 50 years ago.
Live footage, especially Drone footage now, can be very dramatic and shocking for viewers. Naturally, it will stir up the emotions. So the public become conditioned to accepting whatever draconian measures will be imposed upon them, to save the World.
I think we can be certain though, that none of the points made in this assessment, will feature on the Evening news, anywhere, anytime soon.
It’s odd, I haven’t seen any of the usual drowning/starving polar bear photos yet. Maybe the BBC believes they have already become extinct. Or they quietly drop the issue now that polar bears are thriving.
The polar bears have been thriving the whole time; they just fixate on those who get sick or drown in a storm and project those minuscule events as a proxy for the whole population.
Mr. H: Mr. ingraham will be along any moment to explain that the polar bears aren’t starving, it’s now all about something…… what was it again ldb?
A link to this report on Greek forestry and fires was posted on notalotofpeopleknowthat blog and is well worth reading. Similar reports should be done for every country, but won’t be because the conclusions wouldn’t fit the narrative.
The nub of the report is that 97% of fires in Greek forests have a human influence.
http://www.fao.org/3/ad653e/ad653e64.htm
Michael Crichton’s State of Fear coming to life on a small scale…
Our TV news in NZ was unbearable tonight when they covered this report. They literally had a banner at the bottom of the screen warning us to prepare for the climate emergency.
Oh, and it was followed by a report on our electricity grid shutdown last night, due to the cold and lack of available generation.
How can they do this with a straight face?
Having visited NZ, I thought you could do ANYTHING there with a straight face!
It’s the same in Australia.
Peak oil strikes again … lets count them for the mods .. 1
At last, one of your posts I can uptick.
Pre-salt, pre-salt
Peak stupidity by ingraham.
Suicide by moderator? : )
Thanks Roger for the great appraisal of the report.
It helps with pointing me in the right direction for looking at specifics in the report
Areas of “increased drought” include parts of the Namib and Atacama deserts where it “never” rains. Hard to increase drought in the two driest places on Earth.
Heavy rain in the Namib this year. Must be proof of climate change. Or something.
I wonder what “drought” in the Amazonas actually means.
It’s one of those excessively wet droughts
when I was a lad – the Medieval Warm Period – there was a bloke who used to walk up and down Oxford Street carrying a huge placard warning of Hell Fire (man made, obviously) and Damnation if we didn’t change, well, everything:
641 × 968
Stanley_Green
Stanley Green he was called, appropriately. In the interim’The Science’ just got more verbose!
Yes.
God has a sense of humor. And he is using it to demonstrate that he is supreme, and we, left to our own devices, are destined to try to parallel and re-create what he has created.
Read Revelation. How the world will end, per God. Our atheistic all-knowing overlords are merely plagiarizing the heat and plagues to come. Except no floods – all of us not perising by flood has already been promised to us – a promise kept thus far!
I also used to worry about Peak Oil, but not anymore. The solution is thermal depolymerization, and bingo, fuel from plastic. See this video for an idea on how to DIY:
https://www.youtube.com/watch?v=_BfjaVbLb8I
If the wells start running dry, you can bet this will become commercially viable.
As far as I’m concerned, I don’t need a government body (IPCC) telling me about future weather and climate as though it’s some expert in predicting the future. The IPCC has past its “Use By” date.
Instead of wasting money on “climate change”, countries should be spending money cleaning up real environmental pollution (plastics problem) and lifting people out of poverty around the world.
The IPCC never had a use beyond pushing propaganda about the nonexistent human influence on the Earth’s climate. Their initial “mission statement,” since swept under the rug somewhat, was the tell.
So,, they admit that the science is not settled and is exaggerated projection, but admonish everyone to be very afraid. Politicians, media and bureaucrats haven’t paid anything but selective attention to the IPCC for a couple of reports now, so the report doesn’t really matter.
I saw in a headline somewhere that this new report was out, so I decided to glance at the Exec Summary / Overview.
I thought the leading controversial points to be launched here would be 1. the diminishing of the MWP, and 2. Ocean Acidification – the new boogeyman?
Their MWP doesn’t even jibe with that from “skepticalscience” (for those who don’t know, skepticalscience are not global warming doubters but are True Believers in the Manmade Global Warming Cult).
https://skepticalscience.com/medieval-warm-period.htm
They fully live up to the leftist naming conventions.
In this case skepticalscience is neither skeptical, nor scientific.
To claim they know relative to today what happened over the last 2000 years when they have temperature “data” only for the last 150 years or so is only done via the scientific incompetence of comparing the instrument record with proxy data which are not directly comparable. And of course ignoring all the proxies they don’t like, and “adjusting” the instrument record to the point where it’s not even data any more, and to the point where it’s just another reflection of their preconceived conclusions due to massive confirmation bias.
Yes. There are many ways to develop a proxy measurement. Most if not all are subject to ceiling effects. This creates a low-pass filter effect.
You could assume temps by looking at, say, tree ring width. One year could have double the ideal, warm growing days, or have temps 50% higher than average. But the tree does not grow to that same degree; it might only grow 20% more than average for those 100% greater warm days. Tree growth is rate-limited. [This does not apply to the invasive vines in my yard, which grow exponentially, since they like heat plus I cut them back much less on those sufferably hot months.]
To see the MWP you need to look at temperature reconstructions along the periphery of the North Atlantic or to a lesser extent the NH. What you are looking at in this graph is the global temperature reconstruction which includes the other regions of the planet including the SH.
Mr. x: Oh, my. So you are one of those “it’s regional” nibs? “To see the MWP you need to look at” the North Atlantic, because it didn’t happen anywhere else??!! All that data from the southern hemisphere in 1200 AD debunks the MWP in your world. And the roman warm period? Also debunked by the data from the southern hemisphere from 300 AD.
The funniest part is, you type it like you really believe it.
Yes. Seeing as how most land mass is in the NH, it gets challenging to go find archeo-temperature proxies in SH
If this is correct, Mann showed great insights in fabricating the hockey stick. Unless they are discredited, these two graphs show humans have warmed the amosphere and much of the other doomladen comments gain authority. The issues then become (1) so what? (our orthodoxy citing Lindzen said AGW would bring a one degree increase); (2) what can we do about it – outsourcing energy intensity industries to Chindia does not affect global emissions?
It’s called hedging your bet.
For rising the temperture in the oceans with 1 degC, 5500 JZ are needed (IPCC). That will rise the sea level with approx 600 mm due to expansion. Now they tell that each year 6.43 JZ are addet and 50 per cent of the sea level rise is due to thermal expansion and sea level is up with 3.7 mm/yr – That does not fit. Both can’t be true. Less than 2 mm/yr og more energy in the ocean.
Are floods increasing? Evidence doesn’t say that
They are in the UK – the UK Met Office has confirmed it
The same Met Office that told airport managers that they would never need snow clearing equipment again back in the 00s?
Given their track record, if the UKMO confirmed it, it’s definitely not true.
Hi Griffo
Met Office didn’t know how to properly calculate the annual CET (Central England temperature) until someone with a strange name (vukcevic or something of a kind) showed them couple of years ago how it was done, then they changed whole lot of numbers going back 2 or 3 hundred years, overnight when nobody was looking.
So basically, again, the statements from the UN and what goes in the media is 500% more alarmist that what the report actually says. It’s so tiring.
Again, the “scenarios” are not the issue; the issue is that the is no empirical evidence that atmospheric CO2 levels drive the Earth’s temperature, so their underlying assumption for ALL “scenarios” is not “science” at all. Just “hypothetical bullshit.”
And as such, it should NOT drive energy policy one iota.
I have not been able to look and make a similar comparison but in an earlier IPCC report I noticed a rather big gap between the date of the report and the graphs/charts that were used. There was no reason not to use graphs closer to the date of publication unless of course these discredited their narrative.
It does not take a scientist to notice these kind of discrepancies but only a keen observant eye. Of course those scientists who reject the alarmism are likely to quickly notice far more discrepancies and that is why contributors to this website deserve our gratitude for their insights.
Mr Pielke
“Curious about what the IPCC forgot to include?
For NA & WP, about 70% of all landfalls, “the overall number of landfalling hurricanes has decreased dramatically since the 1940s, while the number of major hurricane landfalls has shown no trend”
This what the IPCC included:
And BTW – there is rather more to say about Atlantic Basin TCs than just land-fall in the US ( it has to do with forward propagation)
And see graph below.
. It is likely that the proportion of intense tropical cyclones has increased
12 over the last four decades and that this cannot be explained entirely by natural variability. There is low
13 confidence in observed recent changes in the total number of extratropical cyclones over both hemispheres.
14 The proportion of tropical cyclones which are intense is expected to increase (high confidence) but the total
15 global number of tropical cyclones is expected to decrease or remain unchanged (medium confidence)
16 It is likely that the proportion of major (Category 3–5) tropical cyclones (TCs) and the frequency of rapid TC
17 intensification events have increased over the past four decades. The average location of peak TC wind18 intensity has very likely migrated poleward in the western North Pacific Ocean since the 1940s, and TC
19 FORWARD TRANSLATION SPEED HAS LIKELY SLOWED OVER THE CONTIGUOUS USA SINCE 1900. It is likely that the
20 poleward migration of TCs in the western North Pacific and the global increase in TC intensity rates cannot
21 be explained entirely by natural variability. There is high confidence that average peak TC wind speeds and
22 the proportion of Category 4–5 TCs will increase with warming and that peak winds of the most intense TCs
23 will increase. There is medium confidence that the average location where TCs reach their maximum wind24 intensity will migrate poleward in the western North Pacific Ocean, while the total global frequency of TC
25 formation will decrease or remain unchanged with increasing global warming (medium confidence). {11.7}
26
27 There is low confidence in observed recent changes in the total number of extratropical cyclones over both
28 hemispheres. There is also low confidence in past-century trends in the number and intensity of the strongest
29 extratropical cyclones over the Northern Hemisphere due to the large interannual-to-decadal variability and
30 temporal and spatial heterogeneities in the volume and type of assimilated data in atmospheric reanalyses,
31 particularly before the satellite era. Over the Southern Hemisphere, it is likely that the number of
32 extratropical cyclones with low central pressures (<980 hPa) has increased since 1979. The frequency of
33 intense extratropical cyclones is projected to decrease (medium confidence). Projected changes in the
34 intensity depend on the resolution of climate models (medium confidence). There is medium confidence that
35 wind speeds associated with extratropical cyclones will change following changes in the storm tracks
http://www.atmo.arizona.edu/students/courselinks/fall16/atmo336s2/lectures/sec2/Atl_hurricane_numbers_annotated_small.png