By Jim Steele
During the 1980s, the media and a few scientists warned that island nations in the tropical Pacific would soon be wiped from the face of the earth, drowned by rising sea levels attributed to rising CO2. The Maldives’ Environmental Affairs Director warned that an 8 inch to a foot rise in sea level in the next 20 to 40 years would be catastrophic. The Guardian’s headlines wrote of islanders abandoning their island home to become environmental refugees. In 2002 supported by Greenpeace, Tuvalu threatened to sue the United States and Australia for excessive carbon dioxide emissions. The Smithsonian magazine asked, “Will Tuvalu Disappear Beneath the Sea?”. However, the Smithsonian also admitted “not all scientists agree that Tuvalu’s future is underwater. Some critics have branded island leaders as opportunists angling for foreign handouts…while people and organizations sympathetic to Tuvalu are “eco-imperialists” intent on imposing their alarmist environmental views on the rest of the world.”
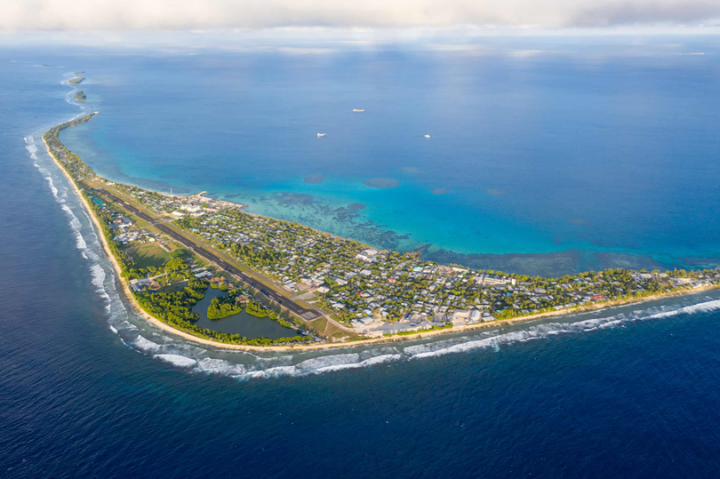
Theoretically, the fear of devastating rising sea levels was quite legitimate given the onslaught of global warming narratives and the fact the entire atoll nation of Tuvalu only averages 6.6 feet above sea level. So naturally, Tuvalu’s fund-seeking prime minister, Saufatu Sapo’aga, told the United Nations that global-warming’s threat to his island was no different than “a slow and insidious form of terrorism”. In reality, the latest science published in 2018 combined past aerial photographs and satellite imagery to report a net increase in Tuvalu’s land area. Built on coral reefs, the atoll’s many islands will change shape as coral debris and foraminifera are added to the land on the leeward side, while losing area on the windward side. Nonetheless, 74% of the islands increased in size with only 27% decreasing. Furthermore, Tuvalu’s growth is mirrored in other islands regionwide. A similar study examining “30 Pacific and Indian Ocean atolls including 709 islands, reveals that no atoll lost land area and that 88.6% of islands were either stable or increased in area, while only 11.4% contracted.” So how can coral islands grow in an era of accelerating sea level rise?
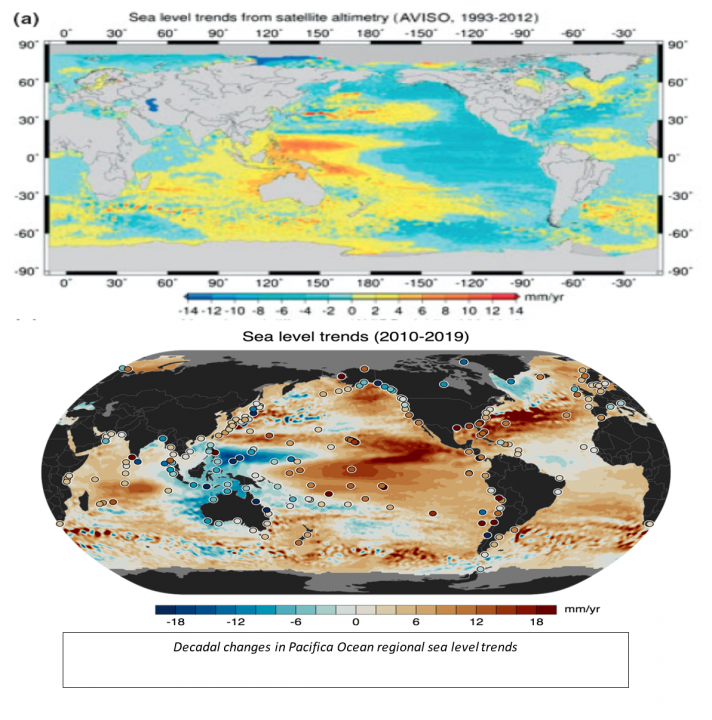
The answer may be, in contrast to global warming theories, that regional sea levels have not been rising by 3+ millimeters/year nor has the rise accelerated. The scary misinformation is partly due researchers using short‑term sea level records that are incapable of accurately measuring the long-term trends. Pacific sea levels rise and fall over decades (see maps above). A single El Nino event can temporarily raise or lower island sea levels by 300 millimeters (mm). Thus, one study using just 6.8 years of data determined sea level at Tuvalu had fallen by 8.9 mm/year in contrast to a 2008 study using 15.5 years of data claiming sea level rose by 5.9 mm/year.
In Tuvalu Not Experiencing Increased Sea Level Rise (2004), the climate skeptic Eschenbach reported climate scientists, who had averaged 27 regional stations using data greater than 25 years, had determined only a 0.8 mm/year trend with no acceleration. Eschenbach further detailed how Tuvalu’s erosion and the saltwater intrusion into the drinking water was not caused by rapid sea level rise. Among other issues, having paved over 10% of the island, the underground reservoir of freshwater was not being replenished, as rainwater was instead shunted away to the sea. Meanwhile the mining of sand and reefs for construction had disrupted the natural dynamics that maintained the island’s shape.
In “The Scientific Basis” of the IPCC’s 2001 report, they determined based on tide gauges “mean sea level rise during the 20th century ranged from 1.0 to 2.0 mm/year” and no detections of the predicted acceleration. Still, to bolster a theory unable to link rising CO2, warming, and accelerating sea level rise, Vermeer and Rhamstorf (2009) created a climate change model that projected a sea-level rise that ranged from 2.4 ft to 6.2 ft for the period 1990 –2100. In contrast, Australia’s NSW principal Coastal Specialist observed a consistent trend of weak deceleration at each gauge site throughout Australasia over the period from 1940 to 2000, and in 2011 published Is There Evidence Yet of Acceleration in Mean Sea Level Rise around Mainland Australia?
There were several more conflicting issues. Scripps’ esteemed oceanographer Walter Munk found IPCC 20th century sea level rise estimates of 1.5 to 2.0 mm/year were too high. In 2013, Gregory et. al wrote Twentieth-Century Global-Mean Sea Level Rise: Is the Whole Greater than the Sum of the Parts? They solved the problem of an unbalanced sea level budget, by simply increasing previously estimated contributions from ocean warming and meltwater. In contrast, Harvard’s Mitrovica solved the same problem by lowering 20th century mean sea level rise to just 1 mm/yr.
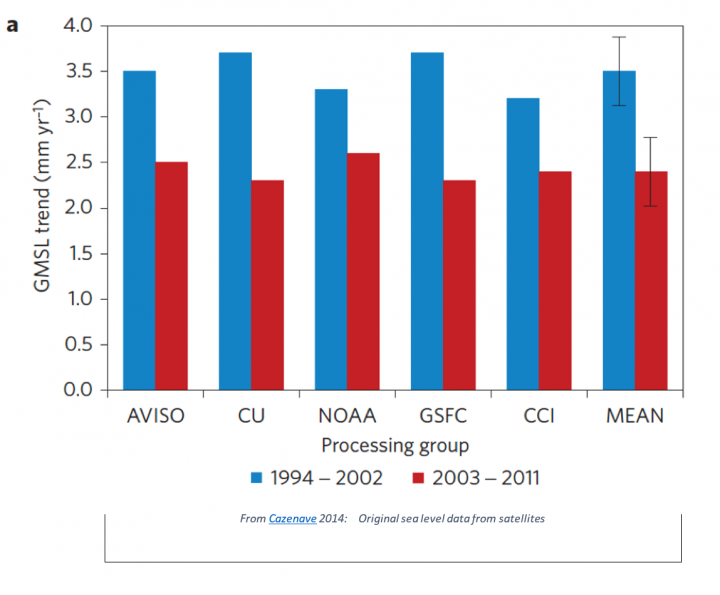
Meanwhile, new satellite era estimations suggested the long-awaited theoretical acceleration had arrived with sea level rising 3.5 mm/year from 1994-2002. Yet, like Tuvalu, such short periods of measurements are usually biased by natural variability and cannot accurately measure long term trends. Accordingly, subsequent satellite measurements between 2003 and 2011 found global sea level suddenly decelerated to 2.4 mm/year. To solve that conflict with global warming expectations, Cazenave et al. added the estimated water trapped on land during La Ninas to observed sea levels, plus added another 0.3 mm/year glacial isostatic adjustment to account for ocean basin expansion. Thus, she raised global warming’s rising sea level trend to 3.3 mm/year for the past 20 years, a rate commonly cited today.
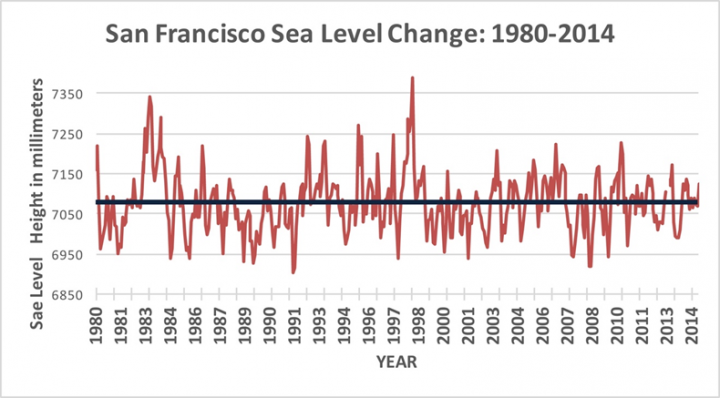
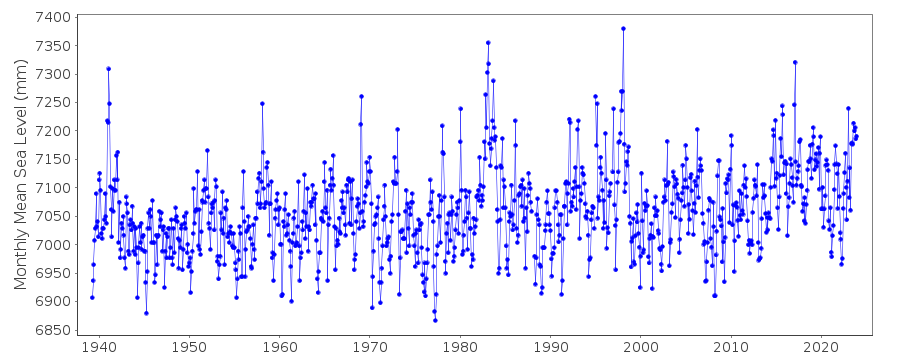
In addition to Cazenave’s misguided trend building from short duration satellite measurements, calibrating satellite data to tide gauges can be distorted by the unaccounted land subsidence typically biasing tide gauges. It is well established that sinking land creates an illusion of sea level rise. China’s Huanghe Delta is sinking 10 inches/year (254 mm) and New Orleans is sinking 1.4 inches (36 mm) per year. Southern Florida experiences localized patches of 1–3 mm/year subsidence, undermining condos in urban areas built on reclaimed marshland. Similarly, San Francisco’s airport is sinking 0.4 inches per year. Between 1980 and 2014, despite San Francisco’s tide gauge experiencing large El Nino sea level spikes, there had been no rising trend suggesting falling sea levels have offset its subsidence.
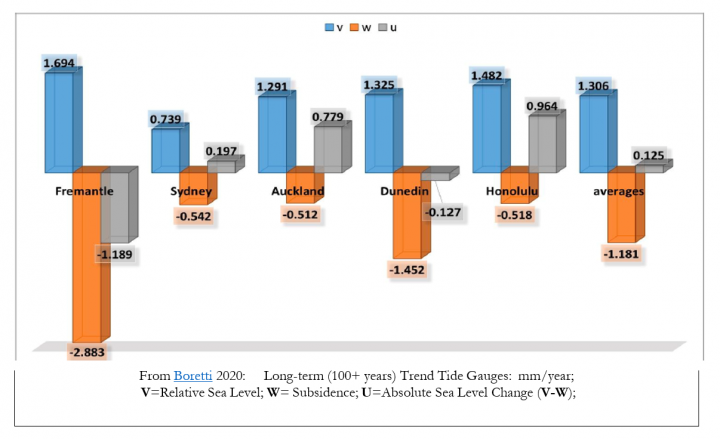
Robustly evaluating the dangers of rising sea levels for Pacific islanders, in 2020 Alberto Boretti published Relative sea-level rise and land subsidence in Oceania from tide gauge and satellite GPS. Using only the 6 regional tide gauges with 100+ years of data, he found after subtracting subsidence effects from the +1.3 mm/year average relative sea level rise, the average absolute rate of rise computed to an astonishingly low +0.125 mm/year; with no signs of acceleration or evidence of thermal expansion. In addition, Boretti’s special Tuvalu case study, also accounting for subsidence, determined from 1977 to present an absolute rate of rise of just +0.157 mm/year. That rate of sea level rise from increased ocean volumes will only add about 0.6 inches in 100 years. The worrisome “sea-level rise of Tuvalu is due to subsidence rather than the increasing volume of the ocean waters” from thermal expansion or glacial meltwater. The best approach for Tuvalu’s prime minister would be to stop ill-advised urbanization that leads to subsidence and threatens its fresh water supply and stop covering his political rump by shifting the blame to climate change. Still stopping subsidence might not be possible. After all, in the late 1800s, Charles Darwin correctly surmised that atolls like Tuvalu were formed by fringing reefs attached to a naturally subsiding extinct volcano.
Jim Steele is Director emeritus of San Francisco State University’s Sierra Nevada Field Campus, authored Landscapes and Cycles: An Environmentalist’s Journey to Climate Skepticism, and proud member of the CO2 Coalition
Quite a range in estimates, from .157 to 3.3. Which would imply that no one really has good data.
Also, I agree with Darwin that if coral growth rates are higher than the subsidence rate, the atoll cannot “sink”.
If the corals did not “drown” during Meltwater Pulse 1A (14,000 years ago) when the sea level was rising approximately 13 feet per century, then I think they are safe from the puny current rates – regardless of the error bars.
That 3.3 mm is fictitious.
ATheoK posted: “That 3.3 mm is fictitious.”
. . . except for the simple fact that 3.3 mm/year is consistent with the average trend provided by satellite measurements obtained over the last 28 years (Ref: https://www.star.nesdis.noaa.gov/socd/lsa/SeaLevelRise/LSA_SLR_timeseries.php )
And you believe that they can actually measure it that accurately?
It’s 3.3mm +/- 1.0 meters
Take this issue up with NOAA, the agency analyzing and reporting the data.
BTW, the precision (not accuracy) of a reported trend of measurements is derived from statistical analyses (linear regression) of the data sets over the 28 years of recordings . . . hence, the reporting of the trend being 3.0 ± 0.4 mm/year.
People familiar with linear regression analysis know that the slope of the straight-line fit can be reported to any desired number of decimal places (e.g., 3.01742), but also that that value DOES NOT imply any degree of measurement accuracy. The ± value does imply a statistically-calculated variation, but again not necessarily an imputed accuracy of any individual measurement.
Gordon, I’ve shown clearly that there is a HUGE difference between the data from the first two and the last two satellites used by NOAA.
See my post, “Munging the Sea Level Data” for details. Here’s the money graph.

You can see the bogus splicing that NOAA has done …
w.
Thanks for the graph, Willis, but I cannot see the reason that you call the “splicing” bogus? Isn’t it really just adding more data made available by the Jason-2 and Jason-3 satellites?
The change in slope around year 2011 as indicated by your graph certainly invites questions, but I can see many potentially valid reasons for this . . . from being a true variation in SLR rates to being an artifact of changed instrumentation to being the result of much-improved satellite orbit and distance ranging algorithms.
That there is good agreement between Jason-1 and Jason-2 for the interval where they overlap (2009-2013) says something, despite the fact that their overall slopes differ, respectively, by the ratio of 2.5:4.1.
Moreover, is the SLR rate difference between 2.5 mm/yr (Jason-1 data) and 4.1 mm/yr (Jason-2 data) really so HUGE (your words) given other comments being made w.r.t. the above article’s key points? And given what author Jim Steele states in his above article: “The answer may be, in contrast to global warming theories, that regional sea levels have not been rising by 3+ millimeters/year nor has the rise accelerated.”
Since you have the propensity to look at data in detail (something I and other WUWT readers greatly respect, and I mean that sincerely), is the linear regression fit for the total 28 years of data (i.e., all satellite data included) not what NOAA states on their website: 3.0 ± 0.4 mm/year?
NOAA are climate alarmists whose importance/budget depends on catastrophic climate change….
Gordon A. Dressler July 21, 2021 10:35 am
I say it is bogus because the first two satellites agree, but they show totally different slopes from the second two, which also agree.
It is clearly NOT a “true variation in sea level rates”. Nobody has ever suggested that the rate of sea-level rise could nearly double in a single year, nor is there a reasonable physical explanation for that.
And if it is an artifact due to improvements, then a) the earlier data is bad and should not be used and b) the uncertainty should be increased greatly to allow for that. But that makes a very, very large difference between satellite and tidal gauge estimates.
The problem is not in the visual similarity. It is in the slopes, and you can’t just handwave that away by saying “despite the fact that their overall slopes differ”. That difference is the problem.
Your claim is like looking at a giant and a midget and saying “Their overall similarity says something, despite the fact that their heights differ” … but the issue in question is the height.
Yes, it really is huge. Historical tidal gauge estimates are that the rate of sea-level rise is on the order of 1.5 mm/year or so. The difference between the two satellite estimates is larger than that … not trivial in the slightest.
First, thanks for your kind words, much appreciated.
Next, your question about the NOAA values (3.0 ± 0.4 mm/yr) depends on several things. First, according to NOAA,
So there’s that. Are you going to include the GIA or not? I say no, I don’t believe that you can measure the change in the capacity of the ocean basins to that level of precision or accuracy, but hey, that’s just me.
Next, how do you handle the overlap when two satellites give different values? Pick one? Pick the other? Average the two?
Finally, there’s the issue of autocorrelation. The satellite sea level values are so badly autocorrelated that there is an effective N (number of data points) of only about 3 or less … meaning that we can say almost nothing about the uncertainty of the trend. I detail my autocorrelation adjustment method here.
I suspect they’ve tried to adjust for autocorrelation, as the trend of the mean values of the actual data shows a much smaller uncertainty. I get 3.0 ± 0.02 mm/year without adjustment for uncertainty, while their uncertainty is 20 times that, 0.4 mm/year.
My very best to you,
w.
from CSIRO on the complexity and adjustments in measuring sea level to detect millimeter changes in global oceans
The essential parts of a satellite altimeter measuring system are:
Other corrections to correct the range:
Ibid.
Thank you, Jim. What is the unbiased estimate of the absolute accuracy of such a complex system. Would it be more accurate than GPS-adjusted long-term tidal gauge estimated accuracies?
Sea level trends are dependent on GPS measurements as part of the additional complex analyses, so sea level would have greater uncertainties embedded.
Boretti’s paper gave in depth discussions regards subsidence and GPS estimates around the area of the tide gauges he examined
for Fremantle tide gauge he wrrote”
“NGL has many more GPS antennas in the area. PERT has w = -1.933 ± 0.603 mm/yr. HIL1 has w = -2.821 ± 0.603 mm/yr. Moving closer to the tide gauge location, WLT1 has w = -3.821 ± 1.231 mm/yr., CUTA has w = -1.108 ± 0.944 mm/yr. and SPA8 has w = -3.795 ± 1.529 mm/yr.
If we take the JPL estimation of the subsidence rate for PERT as a reasonable estimation of the subsidence rate of the Fremantle tide gauge, then in Fremantle the relative rate of rise is v = +1.69 mm/yr., the sea-level acceleration is a = +0.00571 mm/yr2, and the absolute rate of rise is u = -1.2 mm/yr.”
Thanks, Jim.
Ummmm . . . how would one easily obtain tide gauge measurements in the world’s oceans, which have an average depth of about 3,680 meters (12,080 feet)?
Or do you think coastlines represent a good proxy for the expanse of the Earth’s surface covered by oceans?
This is THE reason that satellite determination of SLR is so useful, albeit the absolute accuracy of measurements from such will be debated, as they say, till the cows come home.
Huhh? What are you rambling on about? I dont think you understand the issues at all!
I can only offer you an explanation . . . understanding is something YOU have to earn all by yourself.
Gordon A. Dressler July 20, 2021 4:00 pm
OK, then OFFER US THE EXPLANATION! Because as I showed in my post entitled Munging The Sea Level Data, the NOAA claims don’t pass the laugh test. Explain to us how splicing these satellite records into one “fast rising and accelerating” dataset is solid science:

As the saying goes, “If you can’t explain it simply, you don’t understand it well enough.”
w.
My reply is posted above, under the same graph that you posted.
“Or do you think coastlines represent a good proxy for the expanse of the Earth’s surface covered by oceans?” Well, to steal an old (alarmist) statement, coastlines are where people live. They are where RSL is felt.
There is no debate about the accuracy of satellite SLR; they measure SLR to within millimeters, with a stated accuracy in centimeters.
Dave Fair posted: “They are where RSL is felt.”
So now the discussion has turned away from the objective science of global sea level rise (global SLR) to how localized costal communities “feel” SLR in just their part of the world?
I choose not to go there, thank you.
But again, you are free to inform NOAA’s Laboratory for Satellite Altimetry about your accuracy analysis performed on their data from the TOPEX, Jason 1, Jason 2 and Jason 3 satellites.
I’ll even make it easy for you to do this . . . here is the point-of-contact to address question about their website (the one I referenced far upthread): Eric.Leuliette@noaa.gov
as someone who has spent a considerable amount of time offshore sailing between the east coast and the Caribbean I can’t imagine how something as chaotic , irregular and ephemeral as the ocean surface can be measured by altimetry with any accuracy . as winds increase the tops of waves are blown off . waves vary with every puff of wind , come from different directions , break . how can all that be adjusted for ? I’ll bet Josh Willis and his crew have never spent any time at sea in a real breeze .
Thanks for the discussion of the possible sources of error, Jim. To put that all into perspective, the satellites orbit at about 1,336,000,000 mm above sea level.
This means they are aiming to measure sea surface level to within one part in 1.3 BILLION … and that’s hard to do in a lab, much less from a moving platform to a moving surface.
w.
“This means they are aiming to measure sea surface level to within one part in 1.3 BILLION … and that’s hard to do in a lab, much less from a moving platform to a moving surface.“
Well, not exactly. Satellite radar altimetry is fundamentally based on time delay measurements of EM propagation, not direct distance measurement.
To put that into perspective regarding the above quote, one can today buy commercially-available oscillographs having sampling rates in excess of 100E+9 samples per second, equivalent to a time-resolution capability of one part in 100 BILLION, or seventy times better resolution than that stated as necessary in the above quote.
In reality, radar altimetry determination of sea level (and hence SLR rise rates) is based on statistical analyses of thousands, if not millions, of individual time-delay measurements and with consideration that some sources of measurement error are systemic, can be quantitatively determined, and can be “zeroed-out”, whereas other sources of measurement error are reduced by a plethora of noise reduction/signal processing techniques. Thus, very precise measurements of average sea-level at various locations around Earth are possible even in the presence of surface wave action, long term oceanic swell motions, overlaying atmosphere pressure variations, and temporally-varying sea temperature.
Then too, most modern day satellite altimetry incorporates periodic in-situ calibration of the total measurement loop accuracy and precision by use of ground-based “truth” sites (such as small lakes that normally have a glassy-smooth surface) for which differential-GPS accurately and periodically establishes elevations (relative to a reference geoid of Earth), while at the same time the altimetry satellite has its orbital ephemeris accurately established by multiple orbiting GPS satellites and satellite laser ranging.
Some of these techniques were cited by Jim Steele in his post above dated July 20, 2021 8:33 am.
Indeed I cited the requisite techniques to estimate sea level including the corrections and adjustments and the limitations of their millimeeter estimates such as “A tracking system capable of locating the satellite vertically at any time to within a few centimetres”
Gordon, it seems you might not have read what I said. I was talking about the difficulty of measuring DISTANCE, not time but distance, to one part in 1.3 billion. You refer to measuring TIME to 1 part in 100 billion.
To convert from time to distance, what we are measuring is the time it takes for a radar pulse to go from the satellite to the earth and back. The pulse is moving at the speed of light, which is 299.8 billion mm/sec. So even with your highly accurate clock, you can STILL only measure it to the nearest 3 mm … and since we need to include the Nyquist factor, that increases to 6 mm.
And that’s assuming that you know the EXACT location of the satellite, that the radar pulse is moving in a vacuum, and that the surface being measured is both flat and normal to the radar pulse.
But none of those is true, and as Jim pointed out, those are not the only complicating factors involved …
Regards,
w.
Willis, with all due respect, I did read what you posted and hence felt the need to respond with my reply.
1) I just gave the 100 GS/sec rate for commercially available oscilloscopes as an example of what is available . . . that was not mean to be an upper limit. For example, the DPO70000SX Performance Oscilloscope from Tektronix provides a real-time measurement bandwidth of 70GHz and a 200 GS/s sample rate with 5 ps sample resolution, equivalent to 1 part in 200 billion. I don’t care to research what time resolution circuitry the Jason satellites use for the altimetry measurements, but I have no problem believing even faster digital sampling circuits can be customized, especially for binary (i.e., single bit – no signal/positive signal) detection circuits that might be applicable to radar altimetry over oceans.
2) I do not think the Nyquist sampling criteria applies to the case of a binary detection algorithm. My understanding is the Nyquist sample frequency (more properly the Shannon-Nyquist theorum) applies only for proper reconstruction of a continuous, time-varying input signal based on synchronous sampling, and NOT for detection of a signal level state change (i.e., on-off).
And yes, there are complicating factors involved in this simple view of implementing radar altimetry from orbiting spacecraft . . . I never said differently.
As I have advised others in these comments, issues with NOAA reporting average SLR rate over the last 28 years based on satellite altimetry as 3.0 ± 0.4 mm/year need to be surfaced to the NOAA’s Laboratory for Satellite Altimetry contact person . . . it is not my data, nor my summary analysis.
Gordon, While the Tektronic Performance scope series you mentioned provide a 200 GS/s sample rate the frequency accuracy of their clock is little better than from 1 part per million (i.e., from their spec. sheet “±0.8 x 10⁻⁶(within 1styear)”). This is considerably less than Willis’ one part in 1.3 billion required in order to accurately measure sea level in mm from the orbital height of the satellites.
Ooops . . . my bad: in my above post’s third paragraph I stated “. . . one can today buy commercially-available oscillographs having. . .” I meant to type in “oscilloscopes“, not “oscillographs”.
And your evidence that “average trend provided by satellite measurements” isn’t pure junk is?
Ibid.
You did not read the reason she raised the SLR trend. It has nothing to do with measurements.
ATheoK, you are just plain wrong.
I not only read what Anny Cazenave is reported to have said per the above article, I read the full abstract of her referenced paper.
For your benefit, Cazenave’s abstract has these exact words:
“Since the early 1990s, sea level rose at a mean rate of ∼3.1 mm yr−1 [refs 2, 3]. However, over the last decade a slowdown of this rate, of about 30%, has been recorded [4,5,6,7,8]. It coincides with a plateau in Earth’s mean surface temperature evolution, known as the recent pause in warming [1,9,10,11,12] . . . The most prominent signature in the global mean sea level interannual variability is caused by El Niño–Southern Oscillation, through its impact on the global water cycle [13,14,15,16]. We find that when correcting for interannual variability, the past decade’s slowdown of the global mean sea level disappears, leading to a similar rate of sea-level rise (of 3.3 ± 0.4 mm yr−1) during the first and second decade of the altimetry era.”
FYI, phrases like “rose at a mean rate of ∼3.1 mm yr−1″ and “slowdown of this rate, of about 30%, has been recorded” and “most prominent signature in the global mean sea level interannual variability” and “during the first and second decade of the altimetry era” have EVERYTHING to do with measurements.
It is you who are wrong again Gordon.
Why are you so vested in disinformation.
You dodge the facts from the post showing all the adjustments and corrections that are needed to arrive at an estimate of satellite derived sea level with your ridiculous “ibid” reply. I can only offer to “explain the science to you”, but only you can decide to honestly understand and interpret it.
For your benefit, I again attach the “exact” Cazenave graph (ibid- also shown above) of what was actually estimated after all the adjustments that the leading agencies (ibid) report must be done so they can interpret the satellite data. After those adjustments they still reported deceleration to 2.4 mm/year. That estimation was then adjusted further by accounting for the ENSO cycle during which La Nina’s cause more rain to fall on the continents and lower sea level than happens during EL Ninos. That makes as much sense as correcting for changes in sea level from glaciers.
Thanks Jim.
Very interesting. Still, I think Tuvaluans should sue China.
Me? At 682,700 mm above sea level, I’ll find something else to worry about.
If the Chinese Communist Party has their way, the Tuvaluans will be suckling the CCP teat for cash for decades and in return spewing anti-Western climate propaganda while allowing Chinese fishing boat fleets to strip its waters of fish to feed its hungry billions.
Since the IPCC insists Tuvulo is sinking and soon to disappear under the seas, this is odd, no? Why would the World Bank pay for a new airport on and island that the IPCC and Alarmists say is sinking?
New airport terminal opens in Tuvalu
https://www.rnz.co.nz/international/pacific-news/351556/new-airport-terminal-opens-in-tuvalu
1 March 2018
The Funafuti International Airport terminal has been built as part of the Tuvalu Aviation Investment Project, which has been paid for by the World Bank’s International Development Association.
The Tuvalu government said the IDA gave a grant of $US29.4 million dollars for the project.
It comes after Tuvalu signed up as the 192nd member of the International Civil Aviation Organisation and the signing of an air service agreement with Air Kiribati late last year…
“Why would the World Bank pay for a new airport on and island that the IPCC and Alarmists say is sinking?”
I dunno. Maybe it’s the “sunk cost” fallacy?
Just a hypothesis…
Hint: flying fish gotta have somewhere to land.
Here in Melbourne, Australia there is specific planning law to address SLR.
“Plan for sea level rise of not less than 0.8 metres by 2100 and allow for the combined effects of tides, storm surges, coastal processes and local conditions such as topography and geology when assessing risks and coastal impacts associated with climate change.
In planning for sea level rise, an increase of 0.2 metres over current 1 in 100 year flood levels by 2040 may be used for new development in close proximity to existing development (urban infill).“
The current level was 2010. So legislated rate was based on 6.66mm/yr.
Current rate is clearly less than 2mm/yr.
The government is WRONG.
Just curious- does any other jurisdictions have such explicit planning law?
Waza, as a Melburnian in a southern suburb, “thank you.” My local MHR, and federal shadow Attorney-General no less, M Dreyfus, is a shameless proponent of such harmful absurdities you report.
Waza, at our old place fronting Moreton Bay, the normal BP king tides between 1946 and 1953 used to just come over the sea wall, skim across the lawn and trickle into the well if we didn’t keep a levy bank around it.
For the last 10 years those same king tides are up to a foot LOWER than they were then.
I have pointed this out to local govt engineers but because of all the CAGW panic about, these local govts are always wanting to keep raising the high water datum. The old well was still there when I showed them and they were going to make a trig [data] point of it but they didn’t and the new owner has now filled it in.
Here’s the Sydney Harbour tide gauge data showing the first recording of Mean Sea Level in May 1914 actually 38mm higher than the last recording in May 2021:
http://www.bom.gov.au/ntc/IDO70000/IDO70000_60370_SLD.shtml
Someone will be along shortly to say that “sea level rise is not equal” to explain why all those fixed gauges over a century old in geologically stable areas show no accelerated rise.
Well surely, there must be a least ONE gauge that’s a hundred plus years old in a geologically stable location that shows an accelerated rise somewhere on the planet?
Now there is a competition ! Here is the database . Go to it readers I have yet to find one and even in areas know to be subsiding, I am hard put to see any acceleration. But then I didn’t apply the “Michael Mann trick” of splicing short term satellite data onto long term data because , Like Jim Steele I am a scientist of integrity!
https://psmsl.org/data/obtaining/map.html
This site was the official site of
British Oceanographic Data Centre
Joseph Proudman Building
6 Brownlow Street
Liverpool
L3 5DA
United Kingdom
The reference to this database seems to have beeen disappeared from their site, but the link still works
alastair,
Thanks for providing this link that clearly demonstrates the problems with using tide gauges located throughout the world’s costal regions to estimate global seal level rise.
Just pull up the webpage associated with SLR trends (psmsl.org/products/trends/ ) and you can easily see over the period of 1989-2019— comparable to the 28 year period of NOAA satellite measurements of SLR—that the data gauge data around the world ranges from < – 4 mm/year to > +4 mm/year.
The reference webpage also provides the following notes of caution:
“The map should be used with some care as anomalous trends have many causes:
land movements (e.g. earthquakes, glacial isostatic adjustment)
unexplained instrumental datum shifts
changes in atmospheric pressure
short records”
Yet some people still believe tide gauge measurements of SLR to be superior to satellite-based measurements of SLR . . . go figure.
Dear Readers –
I have a fantastic offer to buy your soon to be worthless and underwater seaside property for $1 a foot. This is not a joke Simon or Izaak. This offer includes you Barrack. $1 gets you out of those claptraps. I am willing to gut it out with the rising water.
Operators are standing by.
I just saw an article that the price of a single family home in Palm Beach hit $11.7 million in the second quarter.
Holy Hanna
Apparently, you are right on target, or on the money!
Washington Examiner: Climate activists invest in property on beaches they say are disappearing
https://bit.ly/2Sagivk
https://wattsupwiththat.com/2021/06/18/washington-examiner-climate-activists-invest-in-property-on-beaches-they-say-are-disappearing/ via @Anthony Watts
Bill Gates: $43M beachfront estate: Proof he’s a WUWT fan?
4/24/20
http://bit.ly/2NfaRsB
Guest “climate hypocrisy?” post by David Middleton
CELEBRITY REAL ESTATE
Bill and Melinda Gates Purchase $43M Luxury Beach House in Del Mar, CA
By Becky Bracken | Apr 23, 2020
The billionaire philanthropists Bill and Melinda Gates have purchased an exquisite beach house outside San Diego—splashing out on $43 million for an oceanfront mansion in the coastal town of Del Mar, CA. The prodigious purchase price makes it one of the largest sales in the area’s history.
The luxurious six-bedroom, four-bathroom, 5,800-square-foot home was sold to the Gates family by Madeleine Pickens, a former wife of the billionaire oil baron T. Boone Pickens, according to the Wall Street Journal. The home originally landed on the market for $48 million in January 2019.
[…]
Realtor.com
Oceanfront Property Tied to Obama Granted Exemption From Hawaii’s Environmental Laws
https://www.propublica.org/article/oceanfront-property-tied-to-obama-granted-exemption-from-hawaiis-environmental-laws
My thanks to Jim Steele for this most interesting analysis. I also appreciate his highlighting my work on the coral atoll question, starting in 2004. I believe I was the first modern scientist to point out a simple fact, which was that sea level alarmists were ignoring Darwin’s ground-breaking insight that rising sea levels created coral atolls, and thus were unlikely to destroy them.
Let me recommend another couple of posts of mine on this subject. One is called “Floating Islands“, which discusses the coral atoll issues in detail. The other, entitled “Why The Parrotfish Should Be The National Bird“, looks at the critical role of parrotfish in keeping atolls afloat.
My best to all from sunny Florida,
w.
Their wings must get tired.
Well Willis it was common knowledge to all of us geoscientists in the oil business. Maybe we didnt point it out to all and sundry because it was so bleeding obvious once Darwin had pointed it out
Thanks, Alastair. Geoscientists in the oil business have to take responsibility for their mistakes, but climate scientists don’t.
Far too many climate scientists were and still are making all kinds of bogus claims about “sinking atolls”. Here’s a 2019 quote from the Brookings Institute:
And here are the idiot scientists working for the UN:
So while geoscientists may have known, lots and lots of climate “scientists” were and are totally ignorant of Darwin’s work.
Sigh …
w.
Willis, your post Why The Parrotfish Should Be The National Bird is one of my favorites.
–
It was published here on WUWT in 2013. For those who may have missed it – the newer visitors here – it’s well worth reading.
–
I’m not sure if my link will work. I haven’t sussed out all the changes from the old format. But one can certainly reach the article using the link in Willis’ comment above.
the sharks are getting bigger. they MUST be getting closer.
Claiming that subsidence is threatening condos over reclaimed wetlands in coastal south Florida is simply a false assertion.
The subsidence that is experienced in south Florida is entirely due to oxidization of highly carbonized surficial muck in the inland Everglades, not in the coastal areas where the condos are located. It isn’t even “subsidence” which is a geological process wherein the upper surface of the underlying bedrock is getting lower in elevation due to overpumping of fluids – groundwater or crude oil – in lower formations, which is not occurring in coastal Florida. The oxidization of muck has zero effect on the underlying bedrock.
Reclaimed wetlands (no longer allowed for the most part) are where the muck is literally scraped out, and is reused and is valuable for landscape topsoils, and they’re replaced by engineered compacted granular fill under buildings, roads, and underground utilities.
Even if the muck were left in place under a building – if isn’t – it would not oxidize because in order to oxidize it must be exposed to air. This is a problem in the Everglades Agricultural Area (EAA) where farm fields are routinely plowed and tilled, but not under any building foundations.
Also, most of coastal south Florida’s condos are erected as high rise buildings, and as such are required to be and actually are supported by deep pile foundations directly keyed into and driven deep into the underlying, non-subsiding limestone bedrock.
The early media reports of the recent building collapse referred to an old study that claimed the building was subsiding several mm per year. But that study took no certified engineering or survey measurements with precision survey equipment, but rather relied entirely on just several years of satellite elevation measurements way back in the mid-1990s, which we all know are accurate only to 5-7 cm, or 50-70 mm. And even that precision is only possible with the latest generation of satellites today, not a quarter century ago. The so-called “expert” who published that study was not a even a licensed engineer, licensed surveyor, or any other kind of high rise building expert, at all.
In other words, surprise! the study reporting building subsidence at the failed building was utter BS.
Duane,
The study I cited and linked to was a 2020 (not an old study you suggeesst) study Land subsidence contribution to coastal flooding hazard in southeast Florida
Please provide your evidence (not just a subjective narrative) and any studies that prove them wrong.
And Im dubious about your qualifications, especially when you state “The subsidence that is experienced in south Florida is entirely due to oxidization ” or your false claim that ““subsidence” which is a geological process wherein the upper surface of the underlying bedrock is getting lower in elevation due to overpumping of fluids – groundwater or crude oil – in lower formations, which is not occurring in coastal Florida”
Here is something to think about. “Of the seven billion gallons of freshwater used daily across Florida’s agriculture, industry, power plants, and public water sectors, most is taken from the Floridan aquifer.”
https://www.nationalgeographic.com/science/article/partner-content-worried-about-water-floridan-aquifer
Ekofisk oilfield in the Norwegian North Sea which came onstream about 1971 has subsided by 10 metres due to extraction of fluid – water, oil and chalk slurry despite the injection of considerable amounts iof water. So draining underground reservoirs can cause considerable subsidence. Ekofisk is a very extreme case
My evidence is as a practicing licensed engineer and real estate developer in coastal Florida for the last 32 years.
Those of us who actually get construction permitted, through our byzantine and extremely complex and lengthy permitting process in Florida, and then actually build stuff here, know one helluva lot more about Florida geology, soil, and building conditions than an internet writer quoting a study by someone who has never actually built anything in Florida.
The geology and soil conditions I refer to are extremely well known to every civil engineer, geotechnical engineer, geohydrologist, and building developer in coastal Florida.
The burden of proof is on you to prove that tens of thousands of professionals working over many decades here in the actual conditions of Florida really don’t know anything and are doing it all wrong.
Surely Duane you can help an old man out with the “burden of proof”. Ihave given you 2 links. Surely there is at least one publication from your “tens of thousands of professionals ” you can link to. Your hyperbolic narratives are useless.
Duane, you have not specified one single thing that “tens of thousands of professionals” know which contradicts what Jim has posted.
All you’ve done is make extensive claims about your immense knowledge, and claim that Jim is wrong … about some unspecified something … somewhere …
Now, let me be clear. You may indeed be 100% correct … but you have not even begun to make a case that you are.
Let me recommend to you my post entitled “Agreeing To Disagree“, which discusses the pyramid shown below.

Your comment is somewhere down around the second step up from the bottom. You need to be dealing from somewhere up near the top of the pyramid.
I look forwards to your substantive comment rectifying your lacunae …
w.
Now I get why Duane has been so negative on comments on previous posts regarding discussion of the building collapse. Duane – you have vested interests there.
Yep! Real estate developers like Duane dont want people to be afraid of buying homes and buildings that could be endangered from subsiding lands caused mostly by increasingly pumping freshwater to supply the growing population
Exactly, Chuck.
I said as much in my first comment to him last week.
And Jim…he never ever gives a single reference for any of his flat out wrong assertions.
He is a massive fountain of misinformation.
Basically, he just makes stuff up.
Period.
Same with Dressler.
Nicholas, we can always recognize the liars and hateful trolls. They, like yourself, attack the messenger but never refute the message.
Jim,
I humbly suggest you’ve misread Nicholas’ comment—one of the occupational hazards of having a debate in this medium. 🙂
His sentence “And Jim…” was a bit ambiguous, but read in context of the thread I’m pretty sure it was addressed to you, not written about you.
Not only was Nick agreeing with Chuck (and you)—having correctly guessed at Duane’s professional conflict of interest a week before it was confirmed here—but he’s pretty much the last commenter who could be accused of resorting to ad hominems in lieu of detailed, substantiated refutation.
(Sure, Nick isn’t above raising questions about Duane’s integrity but, in the face of such provocation, his restraint is astonishing.)
Good point Brad. I see where I could have misread it, thinking i was directed at me.
Thanks, Jim and Brad. Can’t say how often I’ve done the same. After being endlessly attacked for all kinds of immaterial issues, I tend to jump at shadows …
… and most of the time, I’m right. But when I’m not, I’m very wrong.
w.
The mistake is easily made! I call it the Reply = Attack syndrome.
(And by “I”, I mean all the world’s leading medical and psychiatric professional organizations of national and international standing with anybody serious.)
“The burden of proof is on you to prove that tens of thousands of professionals working over many decades here in the actual conditions of Florida really don’t know anything…”
No Daune, it is just you who knows nothing.
Which is all anyone has said, and which you amply prove every time you start yapping.
As far as I can tell, the building was a disaster waiting to happen. link
If I lived there and heard even a whisper about corroded rebar, my exit would have caused a sonic boom (poetic license invoked). I wonder if any engineers, architects, or people with similar backgrounds continued to live there.
The ethics of the situation bother me a lot. If I sank my life savings into a condo and then became aware that there might be severe structural problems, it would be unethical to sell my unit without warning the buyer …
A number of people depend on me and would be gravely harmed if I were to bankrupt myself because of being ethical.
Aargh!
Florida real estate and condo law requires full disclosure of all known defects at a sale. There was no ethical violations here at all that have been exposed.
Nobody knew or believed that the building would collapse imminently, including the structural engineer who analyzed the building and designed and permitted the several repairs to the building that were scheduled to begin the week after the building collapsed.
I would have thought that, by law, any owner trying to sell a condo in Surfside would have had to disclose the engineering firm’s report from 2018. Does Fl. not have disclosure laws? We do wherever I’ve lived. I would be shocked if they didn’t.
I should think that anyone who sold after that report was received by the HOA and did not disclose it would be wide open for a lawsuit and if the buyer died in the collapse, their heirs, I presume, could sue the estate of the seller..
Virtually every reinforced concrete, precast, post tensioned, or cast in place building in the world has some degree of rebar corrosion. So no, just having corroded rebar is not a death sentence on a building, bridge, revetment, dam, sea wall, drydock or any other engineered structure.
Steel easily corrodes, and concrete is a porous building material.
The issue is not a black or white, corroded vs. not corroded scenario. The issue is, first of all, NOBODY KNOWS TODAY WHAT CAUSED THAT BUILDING TO FAIL. Not a single investigation is even beyond the most immediate initial data gathering phase.
Nobody knows if the collapse was caused by a design defect, a construction defect, or a maintenance defect, or any combination of all of the above.
Numerous actual expert forensic engineers have already declared hat the findings contained in the 2018 engineering analysis of the building do NOT point to any smoking guns that would have resulted in the building’s collapse, including the engineer who prepared that report, and was in charge of getting fixes to various structural issues with that building but never ever believed that the building was at imminent risk of collapsing. The structural issues he noted were all in various non-load bearing structures, such as the deck over the parking garage and pool area, or in various appurtenant structures like balconies – none of which if they completely failed would bring down that building.
Whatever it was that brought down the building, it was something hidden from view or any kind of accessible inspection. Again, it could involve any combination of a number of causes, and likely involves more than a single cause.
Corroded rebar comes to light when concrete starts cracking/spalling/etc. Because of the use of road salt, Ontario and Quebec have had significant problems with bridges and parkades because of rebar corrosion.
the powers that be in Plymouth, England built a new marina some 30 years ago steel columns filled with concrete, what could possibly go wrong ?
(and whats wrong with using a little salt water when making concrete ?)
(and surely shot blasting must remove all the particles of salt. ?)
been there done that and it results in
fail!The Permanent Service for Mean Sea Level LINK has a little over 50 tide gauge records that go back at least 100 years. After fooling around with medians, averages and outliers for those 53 stations, it becomes rather apparent that the NOAA assessment of an average global sea level rise rate of 1.7-1.8 mm/yr is probably correct. LINK All the rest of the shouting & screaming about multi-meter sea level rise, melting ice caps, disappearing islands, and flooded coastlines is gross exaggeration.
Acceleration is barely an issue. it’s around 0.01mm/yr² for those 53 stations. Colorado University’s Sea Level Research Group C-SLRG* says acceleration is a whopping 0.097 not 096 and not 098 but 0.097 mm/yr². They are simply not to be believed.
*C-SLRG pronounced See Slurg
“So how can coral islands grow in an era of accelerating sea level rise?”
Simples. As you pointed out correctly Jim, there is no accelerating sea level rise.
Second level thinking: If there was accelerating sea level rise, coral islands can grow because that’s what corals do.
Most of those touristy islands offer horse riding trips as one of the things to do …… and no trolls, you know who you are, they ain’t seahorses.
In other news, I usually see San Francisco Bay at low or low-ish tide levels but, recently, I’ve been driving up 101 in the early morning and it’s been high tide. Looks really great in the early morning sun. I won’t live long enough to wet the bed over that one. Thanks for the confirmatory chart.
Having failed the “Global Warming” prediction SLR was next on the list for misinformation. Despite failing catastrophic SLR they are sticking with it until the next boogyman can be conjured. I’m guessing increased CO2 will be responsible for racism. Don’t laugh.
It will indeed. Scientists are warning us about this sort of thing, so it must be true:
https://babylonbee.com/news/scientists-warn-that-in-the-next-decade-well-run-out-of-things-to-call-racist
I think I read somewhere that 2+2=4 is racist.
Barkly Street, Elwood is the poster child for SLR alarmism here in Melbourne.
No 343 Barkly sold for $900k in 2011 with full knowledge of potential SLR. It has then resold for $1.6m in 2021.
https://www.realestate.com.au/property/343-barkly-st-elwood-vic-3184
No 343 Barkly Street is about 2.2m or just over 7’ above mean SL.
Photos show St Kilda Marina in the background which is the location of the tide gauge for Melbourne
Isn´t is straightforward to at least roughly estimate the thermal expansion of the oceans?
It seems the upper 100m of the global ocean have warmed by about 0.5°C since 1960
http://www.climate4you.com/SeaTemperatures.htm#Oceanic%20average%20temperature%200-100%20m%20depth
Then we only need the surface to calculate the volume of the upper 100m sea layer (70% * 5,101 × 10^14 m²) and assume a thermal volume expansion coefficient (10^-4 /°C, which I might have gotten wrong)
So we get
_Delta V = 70% * 5,101 × 10^14 m² *100m 10^-4 /°C *0.5°C ≈ 1.8*10^12 m^3
and _Delta V/V ≈3.5*10^-4
Since the area of the oceans stayed roughly the same, this results in
d= 100m*3.5*10^-6=35mm
Which seems within a factor 2 of some NASA estimates:
Curious lack of error bars.
It seems the upper 100m of the global ocean have warmed by about 0.5°C since 1960
Did it warm evenly everywhere? Or some places more than others? Sea level will go up due to thermal expansion only where the warming occurred. Think about it, if the Pacific Ocean warms up, does the water in New York harbor go up?
It obviously warmed evenly everywhere, as uneven expansion would cause wrinkles that are not apparent in the satellite data.
HA Ha ha
Trying to calculate the volume expansion of the sea due to warming is more complicated, because the coefficient of thermal expansion of water is highly dependent on temperature.
Specific volume of water in ft3/lb (from ASME Steam Tables):
32 F 0.016022
40 F 0.016019
50 F 0.016023
60 F 0.016033
70 F 0.016050
80 F 0.016072
90 F 0.016099
From these data, the average coefficient of thermal expansion over temperature ranges would be
32 – 40 F -4.2E-5 / C
40 – 50 F +4.5E-5 / C
50 – 60 F +1.12E-4 / C
60 – 70 F +1.91E-4 / C
70 – 80 F +2.47E-4 / C
80 – 90 F +3.02E-4 / C
The total volume change due to thermal expansion thus depends heavily on the assumed initial temperature distribution (how much of the water is assumed to be at 40 F, or 60 F, or 80 F before the warming). Also, there is nothing magic about the layer 100 meters deep, since if that layer actually did warm by 0.5 C since 1960, some of the heat could have been conducted downward into deeper layers of the ocean. At the low temperatures typically found in the deep ocean (about 4 C or 40 F), a given temperature increase has less effect on volume than near the surface.
The area of the world’s oceans is estimated to be 361 million km2 (= 3.61E+14 m2), while their volume is estimated as 1.36 billion km3 (=1.36E+18 m3), which would result in an average depth of about 3,767 meters. This means that most of the volume of the oceans is below 100 meters depth, where the water is much colder than near the surface, and would expand much less when heated than the top 100 meters. For this reason, the 35 mm expansion calculated by “Laws of Nature” is probably an over-estimate.
The geological record shows, with high confidence, that sea levels during the last Glacial Maximum, 20,000 years ago, were about 120 metres below current levels.
120 metres is 120,000 mm. Divide that by 20,000 and one gets 6 mm. So the average sea level rise during the past 20,000 years has been 6 mm per year.
During that period of 20,000 years there will have been many shorter periods, of a century or so, when the sea level rise was less than 6mm per year, and other periods when the sea level rise was much greater than 6mm per year.
The claimed sea level rise during the past century of around 2mm per year, and more recently as much as 3mm per year, seems rather benign to me, and nothing to worry about.
“…and stop covering his political rump by shifting the blame to climate change.”
I won’t say this is why climate change was invented but I will say that ever since its invention, politicians have been using climate change to excuse a wide range of failures to plan and prepare by various and sundry politicians. Of course, that’s when they aren’t using it to steal more money from the taxpayers to prevent future disasters that won’t occur anyway.
What’s the source for the San Fransisco sea level chart please? It doesn’t look much like the one published by PMSL:
https://www.psmsl.org/data/obtaining/stations/10.php
It was from data downloaded from PMSL on September 2018
Nailhead shows an “Annual Mean Sea Level” adjusted chart that begins in 1875.
i.e. it is showing styrofoam injected pineapples in comparison to SLR apples without Colorado’s or NASA’s iso adjusted SLR speculations.
Some of nailhead’s annual Annual Mean Sea Level changes are in excess of 50mm per annum, many are well in excess of 10mm.
Well, at least I provided a link to the source data Jim used, where the monthly and annual data are available for download. And thecgraoh I show uses the whole series; it doesn’t start and stop it at precise points within.
Well, at least I never used a “thecgraoh” like Nails
Because the most real and alarming climate change is the change happening to climate records. The past is as unpredictable as the future. All we can know for sure is that it’s worse than we though. And getter worser.
Yey every goup that examines the records in detail arrive at hhe same conclusion.
Thanks for another interesting article.
I am, however, a bit puzzled though about the difference in the current PSMSL data as shown by FinalNail and the one in the head post. Could you explain a bit about the adjustments that AThoK refers to…pineapples and apples don’t mean much to me.
Have they added a GIA or some other adjustment somewhere in recent years to change the way the graphs appear on their website? Is PSMSL data still reliable in your opinoon or has it now been corrupted/adjusted/homogenised?
Thanks. Any reason you didn’t use the freely available up to date data, or why you truncated the data that was available to you in 2018?
The trend-less period between 1980 and 2014 is readily seen at SF’s neighboring Alameda monthly data
Great work and so well written Jim and reminded me of this article by the late, but very great Aussie Scientist, Bob Carter;
On 11 Dec 2014
TITLED – Tide turns on sea level alarmists,
https://www.theaustralian.com.au/commentary/opinion/tide-turns-on-sealevel-alarmists/news-story/4271c4edb3fe144d6a30a2d31c399b3d
Unfortunately – only those already converted to the truth are listening
an addition = for the Aussie tide gauge records from the middle of Sydney Harbour since 1867
Fort Denison tides since 1867
https://researchdata.edu.au/tide-sheets-fort-denison/171941
“The answer may be, in contrast to global warming theories, that regional sea levels have not been rising by 3+ millimeters/year nor has the rise accelerated.”
–
Sadly no.
The sea level quite clearly is aware of where the low lying islands are and selectively rises at 3 times the rate of the surrounding ocean when it encounters them.
This is a well known fact.
–
The islands, to survive, have learnt how to swim or float on top of the rising sea.
–
Only joking.
Perhaps it is all due to surface tension?.
Forces of attraction between a liquid and a solid surface are called adhesive forces. The difference in strength between cohesive forces and adhesive forces determine the behavior of a liquid in contact with a solid surface.
–
A couple of years ago, I saw a beautiful stainless steel sea level marker at the northern end of Bondi Beach. Lying on it’s side! Probably still in use by the alarmists!
How is this anything less that pure cherry picking? Extending the trend up to present day shows that it is positive, for both San Fransisco and Alameda. Did you deliberately look for a period that would show no trend?
Indeed the 1980 to 2014 graph was selectively chosen. One reason was the El Nino events that occurred in the last years disproportionately bias the trend upwards. The selective choice of those 34 years still accurately shows that during that period there was no recorded sea level rise and satellite measurement validate that showing an actual fall in the eastern Pacific’s sea levels. The graph is not trying to claim there has been no sea level rise ever.
The largest El Nino Spikes occur in 83 and 98 – i.e. the earlier part of the 1980-2014 period you’ve highlighted. This would produce a lower trend for this period. Is that what you’re trying to say? You deliberately chose the period that would yield the most negative trend?
I agree that the trend for this period in this singular location is negative, but that does not seem to be inconsistent with any claims I’ve ever heard about GMSL rise. A careful eye could scour the time series for individual tide gauges and identify periods showing pretty much any trend he wished. Just as one could do with any time series comprised of signal+noise.
Weekly you are getting needlessly and trollishly nasty saying “ You deliberately chose the period that would yield the most negative trend?”
Again I picked that time period because it also coincided with all the satellite data showing a negative trend along the USA west coast.
The map you’re now providing shows that, globally, sea level rise during this period was ongoing, as it continues to be up to the present day. Again, it is hard to justify picking two specific tide gauge records over the specific time frame where the specific point in the world where these two tide gauges are located showed a negative trend, it certainly does not support the argument that global sea level rise is not proceeding as projected.
LOL weekly_rise! I never said SF tide gauges did what you are now claiming, it was simply an example of subsidence and how regional sea levels vary. You are creating a strawman argument and diverting discussion from the meat of the evidence.
The evidence that “global sea level rise is not proceeding as projected” is based on the Boretti’s longterm tide gauges and their measures of ABSOLUTE sea level when subsidence has been accounted for, as well as the growth of islands that alarmists like yourself expected to drown
So you believe that there is a long term rise in sea level along the west coast of the United States shown in the tide gauge records?
Weekly-rise I see you have visited other websites discussing this article and have been called stupid troll for your dishonest attempt to denigrate the article.
You have taken a paragraph discussing subsidence and tried to dishonestly fabricate a totally different intent. Here’s the paragraph supporting the SF tide gauge graph
Yet you ignorantly freak out because the the rest of the article provides lots of evidence to support “the argument that global sea level rise is not proceeding as projected.”
So you create a diversion with your false claim of cherrypicking.
Those other websites were correct. You are not even a good troll.
Why do you avoid my question? Is the overall trend at the San Fransisco tide gauge station positive, negative, or flat? Based on the long term trend at the station (which is perfectly consistent with other estimates of GMSLR), why did you choose a specific interval for this article that would show no trend? My assertion stands – I believe you’re deliberately cherry picking examples to support your predetermined narrative.
You really are a stupid hateful troll.
Nobody is arguing there has been no overall upward trend. You are cherrypicking a graph then assigning your own false interpretation to it, then based on your distortions of what has been written, blameme for your stupidity
The question is how much rise and what are the causes. The issue addressed here is how subsidence has inflated the tide gauge trends. Try reading the article again without your alarmist blinkers on
here is another look at sea levels 1992 to 2014 from NASA showing no rise along the USA west coast, It is informative regards ocean dynamics, it is not cherrypicking.
from NASA
Jim, nice to revisit sea level with the full range of facts. ‘Projected’ warming from 1990 was shown by subsequent observations to be 300% too high, so, taking a leaf from Cazenave’s sea level cookbook, those in charge of warming pushed the goalposts back from 1950 to 1850 to bankroll the 0.6°C of natural variation onto the CAGW side of the ledger and hyped a mere 1.5°C rise from the new goal post by 2100 as ok but a threshold for calamity.
I think we have found a coefficient of ⅓ to multiply global warmings metrics by. Like an acquaintance who used to add a half hour onto his girlfriend’s estimations of when she would be ready and plan with it to avoid being late for events.
Oh and Jim, as you know, the islands are alive and left to their own devices grow to keep up with sea level (+120m since the end of the last glacial period!)
I looked quickly at the Alberto Boretti paper linked in the above article. It looks pretty exhaustive in terms of the Pacific region. Since Boretti is a Professor at a Saudi University there are obvious potential conflicts of interest plus it seems to have been written for a journal without peer review.. I hope what he lays out is pretty ironclad, but I would find it useful if someone else more familiar with the data could comment.
https://www.degruyter.com/document/doi/10.1515/nleng-2020-0007/html
Do tell Bernie,
What are the “obvious potential conflicts of interest” with which you think undermines Boretti’s analysis ?
Jim: The Saudi’s have a rather huge vested interest in maintaining the demand for fossil fuels. I am posing a not unreasonable question given that I know nothing about Prof. Boretti. The article appears very thorough and raises significant questions about current estimates of GMSL changes. If true then the satellite measures seem to have a rather large error.
I would pose similar questions if someone from the University of East Anglia produced proxies that supported the Hockey Stick. The latter may be valid but it still seems prudent to ask questions about the researchers bona fides.
Bernie,
I prudently distrust people who prefer to attack the messenger and not the message.
Indeed we can imagine some form of conflict of interest for virtually all researchers.
The truly prudent thing to do is analyze the validity of the evidence and interpretation because no matter how much integrity a researcher has their science can be misguided
Jim:
Agreed on all counts. I simply asked others familiar with the data on which his work is based to comment explicitly on his article. Extraordinary claims require extraordinary evidence.
Bernie,
I hope you have the same skepticism for politicians and legion of self-proclaimed “Green Tech” investors that promise to save the world if only their policies and/or products are employed. These people demand unprecedented power with enormous costs unseen since WW II, while decreeing the situation is so dire that it cannot even be debated!
Everyone one has biases and is driven by their own self-interest, that is why we must focus on the evidence and not the messenger. Every claim must be backed by evidence and able to survive stringent debate.
Way more. There are no free lunches and it is amazing how poor politicians seldom remain poor for very long. A skeptic and a cynic.
The biggest “conflict of interest” for scientists is the heaps of taxpayer money in the form of “grants” for “climate catastrophe” research, so the inference of “money corrupts” is much more an issue for the AGW propagandists than it is for those more “scientific.” The quickest way for a scientist to get villified is to dare to speak out in any way against the propaganda, Saudi university or not, so I see nothing in the way of “incentives” for scientists to”shit where they eat,” so to speak – quite the reverse.
I’ve tried to find nasa’s explanation for how they correct / adjust for something as lumpy and uneven as the surface of the ocean . then they say they have to adjust for different intensity results between crests and troughs using wind speed estimates from the altimetry data . im no rocket scientist but I’ve spent a lot of time on the ocean and their explanation sounds totally ludicrous . the ocean surface in any kind of wind is in constant chaotic motion with waves of all sizes and shapes reacting to every new puff of wind .given a strong wind tops start blowing off of waves . no matter how hard I try to imagine any way of averaging or homogenizing altimetry data it doesn’t seem possible to get any kind of meaningful result . they are claiming accuracy to just over 3 cm anyway which doesn’t seem especially useful in debates over mm’s . each new satellite is calibrated to whatever numbers the old satellite is generating . kinda like models all the way down .
Agreed!
But then again when the tide gauges and the Pacific islands don’t cooperate, one must find other avenues to “prop up” the propaganda.
I guess there are some people who just haven’t caught up with Darwin’s interpretation of coral atolls. Just read a report where they have moved several black footed albatross from Eastern Island on Midway to a safer location so they won’t “drown”. I would call it stupid, but heck, they got to go to a beautiful place and play with the birds. What’s not to like. (8) Friends of Midway Atoll National Wildlife Refuge – Posts | Facebook
I grew up in SF back in the 1950s. I spent a great deal of time in my younger days playing and fishing along the shore, both on the Bay and on the ocean. So I was very familiar with all tidal marks in the local harbor and along the forebay and ocean. Now at the age of the early 70s I cannot see any change in these old tidal marks. Looking at the graph above for the SF Bay makes it clear why I still see the same tidal marks when visiting SF after all of these years.