Despite warming, the Greatest single day gains in Greeenland ice and its SMB (surface mass balance) is happening the past days. Ice gain/loss in Greenland is function of the location of the Icelandic Low and how moisture is delivered to Greenland. It is not about changes in average global temperature.
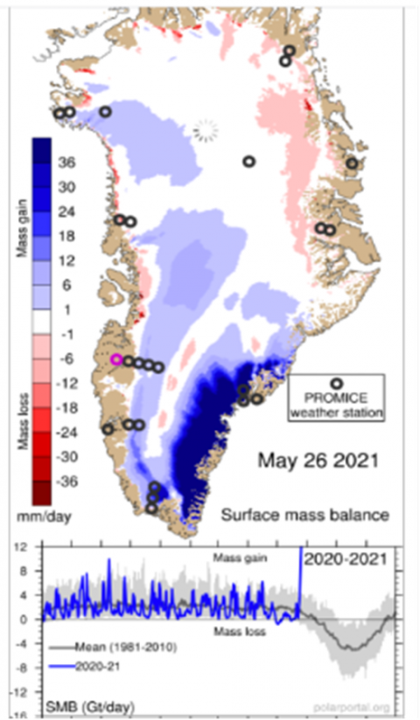
In the graph below, the blue line, if above the zero line, shows how much mass Greenland gained that day. The gray shading shows the range of gained mass in the past and the black line shows the average. Yesterday’s blue line shows Greenland’s gain was literally of the chart
http://polarportal.dk/en/greenland/surface-conditions/
Below is a snapshot of the winds over the north Atlantic today at 9 AM. Brighter green streaks means stronger winds. The anti-clockwise circulation pattern just south of Greenland is the Icelandic Low, and you can see it is pushing moist winds over southern Greenland which is adding snow and ice. Yesterday the location was even more favorable for moisture transport causing the record breaking amounts of one day added snow. The screenshot was taken from a great website, where you can observe real time changes in the earth’s temperature, winds, moisture, etc at different altitudes, available at :
https://earth.nullschool.net/#current/wind/surface/level/orthographic=-105.00,0.00,351
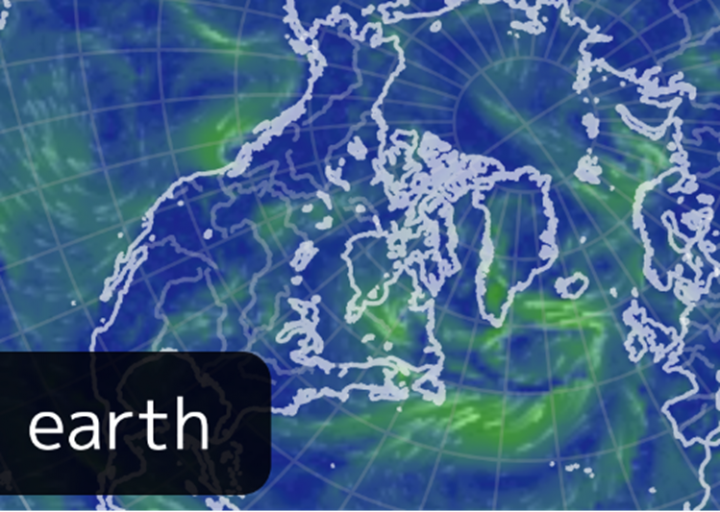
I visit that site daily for a quick overview of the earth’s weather dynamics
Climate scientists determined previous years of extreme ice loss, such as 2011-2012 was due to the location of a High pressure system that caused cloudless skies and stronger solar heating of the surface. http://polarportal.dk/en/greenland/surface-conditions/
from Hofer (2017) Decreasing cloud cover drives the recent mass loss
on the Greenland Ice Sheet
https://advances.sciencemag.org/content/3/6/e1700584
“We show, using satellite data and climate model output, that the abrupt reduction in surface mass balance since about 1995 can be attributed largely to a coincident trend of decreasing summer cloud cover enhancing the melt-albedo feedback. Satellite observations show that, from 1995 to 2009, summer cloud cover decreased by 0.9 ± 0.3% per year. Model output indicates that the GrIS summer melt increases by 27 ± 13 gigatons (Gt) per percent reduction in summer cloud cover, principally because of the impact of increased shortwave radiation over the low albedo ablation zone. The observed reduction in cloud cover is strongly correlated with a state shift in the North Atlantic Oscillation ”
The negative phase of the North Atlantic Oscillation also pumps warmer air into Greenland
From the research paper Hanna (2013) Atmospheric and oceanic climate forcing of the exceptional Greenland ice sheet surface melt in summer 2012
explaining the 2011-2012 extreme Greenland melt
“In 2012, as in recent warm summers since 2007, a blocking high pressure feature, associated with negative NAO conditions, was present in the mid-troposphere over Greenland for much of the summer. This circulation pattern advected relatively warm southerly winds over the western flank of the ice sheet, forming a ‘heat dome’ over Greenland that led to the widespread surface melting.”
It’s all about climate dynamics, not CO2!
Jim Steele is Director emeritus of San Francisco State University’s Sierra Nevada Field Campus, authored Landscapes and Cycles: An Environmentalist’s Journey to Climate Skepticism, and proud member of the CO2 Coalition
And so mums the word for the alarmists and their press.
Some while back I read articles about two studies, both reported here on WUWT, probably two or three years apart. The first used satellite imagery to show that extensive forest fires in Scandinavia and eastward, in 2012, deposited large amounts of ash on Greenland, causing the extreme 2012 melting. The second used satellite imagery to show that a major portion of the Sahara dust that normally goes to the Amazon was diverted north bu unusual winds where it eventually landed on Greenland, causing the extreme 2012 melting. It sounds like everyone is grasping at straws and speculating as necessary to still their too fast beating hearts.
A late-season nor’easter just hit the southeast coast of Greenland. It happens often in New England, but earlier in the year (up through early April).
Even if this is a short-term event, it could be a symptom of a negative feedback if the part of the Atlantic Ocean immediately east of Greenland starts melting earlier in spring or freezing later in autumn.
If this occurs, there would be a sharp temperature gradient between the relatively warm open water and the cold air mass over the high ice cap of inland Greenland, and storms would tend to track just off the east coast of Greenland (as they do during winter off the New England coast). If there is a lot of open water, northeast winds around the storms would bring lots of moisture and heavy snowfall in eastern Greenland, particularly in autumn when there is no sunshine to warm the land mass. Melting of the sea ice along the east coast of Greenland could actually result in an increase in mass of the Greenland ice cap.
“We show, using satellite data and climate model output, that the abrupt reduction in surface mass balance since about 1995”
I beg to differ. If you look at daily gains ans losses, there are about 10 months gain and 2 months losses.
Mean 1981-2010 looks to be ~2 gigaton gain, losses certainly looks to be less than 2.5 gigaton per day.
10/12*365*2-2/12*365*2.5 yields average gain 465 gigaton per year for 1981-2010….
For 2011-2012, it is well understood that numbers aren’t the same each year. 2011-2012 was an anomalous flicker, nothing more.
“Decreasing cloud cover drives the recent mass loss on the Greenland Ice Sheet”
I fail to understand how that would be mechanically possible. Decreasing cloud cover do indeed increase short-wave insolation but also increase long-wave radiation (cooling) and SIGNIFICANTLY decrease convection to prevent warm air rising and cold air sinking.
You’ll feel that on your body any old winter, how crisp the air is when there are no clouds as compared to how relatively warm it is when there is a blanket to prevent radiation as well as convection(clouds) above.
Oddgeir
And then, just like that, global warming stopped