
Kristopher Karnauskas, University of Colorado Boulder
As summer in the Northern Hemisphere approaches, forecasters begin watching every bout of rainy weather between the Gulf of Mexico and Africa. Each counterclockwise swirl of wind or burst of puffy clouds there has the potential to organize into a life-threatening tropical storm.
About half of the tropical storms that formed over the past two decades grew into hurricanes, and about half of those became the monsters of coastal destruction we call major hurricanes. We’re now accustomed to seeing about 16 tropical storms per year, though that number can vary quite a bit year to year.
What are the warning signs that we might be in for another record hurricane season like 2020, when 30 tropical storms formed, or a quieter one like 2014, with just eight?
The National Hurricane Center will be issuing its first seasonal forecast of 2021 this week. Here are some of the ingredients forecasters and scientists like myself look for.
Where tropical storms begin
Hurricanes live in the atmosphere, but they are fed by the ocean. First, let’s look even farther upstream and find out where they come from.
Like growing crops, hurricanes will be plentiful and robust with a large number of seeds and favorable environmental conditions.
The seeds of tropical storms are small and hardly menacing weather disturbances. You’ll find them scattered throughout the tropics on any given day. In the Atlantic, some start as clusters of thunderstorms over Africa, or as clouds near the Cape Verde Islands off Africa’s west coast.
The vast majority of these seeds do not survive beyond a few days, but some are swept up by the easterly airflow to be planted over the tropical Atlantic Ocean between about 10 to 20 degrees north latitude. This is the field where growth is really fueled by the ocean. From there, developing tropical storms are carried westward and northward by the “steering currents” of the atmosphere – avoiding the equator where the crucial effect of Earth’s rotation is too small for them to develop further.
The more seeds, the better chance of an active hurricane season.

Several factors influence the level of tropical storm seeding in a given year, but forecasters’ eyes are usually trained on the African monsoon in the spring.
Once those seeds emerge from the African coastline or from pockets of warm, rising air popping up elsewhere over the ocean, attention shifts to the environmental conditions that can fuel or limit their growth into tropical storms and hurricanes.
Warm water fuels hurricanes
In general, tropical storms thrive where the surface ocean is a balmy 80 F (26.7 C) or warmer. That’s why hurricanes are rare before June 1 and are most likely to occur August through October, when the ocean is at its warmest.
The main fuel supply for tropical storms is the heat energy in the upper ocean, the top 100 feet (30 meters) or so.

It’s more than just the temperature of the surface, though. A major factor in the development of very strong hurricanes is how deep the warm waters extend, and how sharply separated the warm layer is from the cold waters below. This is because hurricanes churn up the ocean as they move along.
If the layer of warm water is shallow and easily mixed, it doesn’t take much churning to dilute the heat energy at the surface with cold water from below, leaving less energy for the hurricane. But if the warm water goes deeper, the storms have more fuel to draw from.

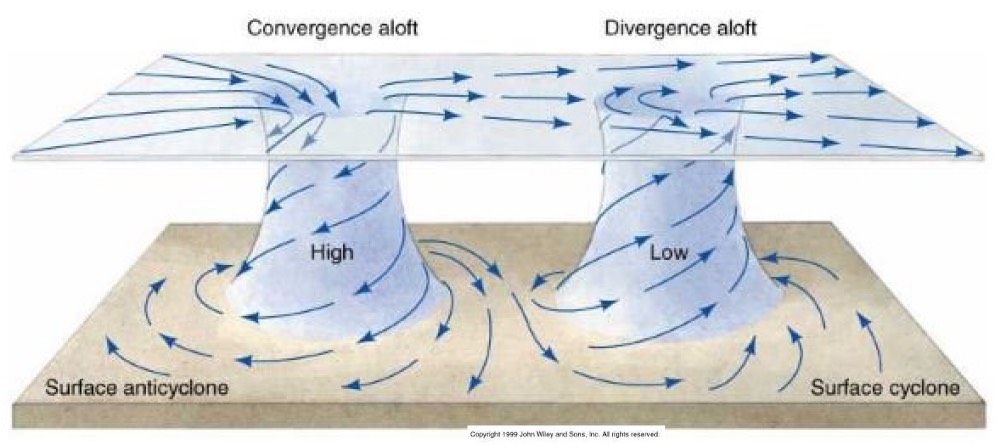
The effect of upper-level winds
The prevailing winds already blowing in a region can also make or break a storm.
Winds blow at different speeds at different heights. It’s one of the reasons airplanes experience turbulence. How much faster the prevailing winds are near the top of the storm than at the bottom is called wind shear. With too much wind shear, the storm has difficulty maintaining those towering plumes of rising hot air.
Similarly, if the rising air can’t escape and flow outward quickly enough, the energy consumed by the storm can’t be ventilated and the engine chokes. Both can prevent the storm from becoming organized and either cap its growth or cause it to dissipate.

An important clue about future wind shear in the Atlantic region comes from events thousands of miles away in the equatorial Pacific Ocean.
When the eastern Pacific Ocean is abnormally warm – known as El Niño – the global atmosphere gets rearranged in a way that increases wind shear over the Atlantic. That tends to suppress tropical storms there – but don’t bet the farm on it. Other slow variations in the climate system also influence environmental conditions, including multi-year periods of warmer or cooler than normal surface temperatures in the North Atlantic.
El Niño’s opposite, La Niña, tends to bring low wind shear, favoring more tropical storms. These conditions are near neutral right now, and forecasters are watching to see what develops.
Where to watch
So if you’re watching for early signs of Atlantic hurricanes in 2021, keep an eye on the African monsoon for storm seeding, temperatures in the tropical Atlantic Ocean to provide the fuel and a possible late-blooming La Niña, meaning less wind shear to tear storms apart. The National Hurricane Center – and many other forecasting groups in government, academia and industry – analyze these and other factors in their season projections.

The bigger picture
The total number of tropical storms tells only part of the story. There are other important aspects to keep an eye on over time, like how intense storms become, how long they last, how fast they travel and how long they take to dissipate after making landfall. Recent studies have indicated that hurricane-fueling ocean temperatures have been trending warmer since the Industrial Revolution, especially along the U.S. East Coast.
Coastal communities are already on the front lines of climate change with sea level rise. The potential for changes in extreme events like tropical storms, with their complex interactions with the atmosphere and ocean, are why hurricanes have steadily risen to be a top research priority.
[Like what you’ve read? Want more? Sign up for The Conversation’s daily newsletter.]
Kristopher Karnauskas, Associate Professor of Atmospheric and Oceanic Sciences and Fellow of the Cooperative Institute for Research in Environmental Sciences, University of Colorado Boulder
This article is republished from The Conversation under a Creative Commons license. Read the original article.
two_atl_5d0.png (900×665) (noaa.gov)
Last time they said USA hurricanes would increase in numbers and intensity didn’t we have 8 years without one above a 2?
markl, the “major hurricane drought” (named by Roger Pielke, Jr., if memory serves), which regarded an absence of major hurricanes making landfall on the Continental U.S., lasted from 2005 to 2017.
Regards,
Bob
I’d like to know if they are using the same criteria to name a tropical storm today as they did in the sixties?
The rules have changed quite a bit over the decades. Post satellite era they were numbered as TD 1-n and since most never made landfall and were not measured directly they were not named. But now there is a new way , but still not consistent around the world .Not always a fan of Wikipedia. but this is accurate: At present tropical cyclones are officially named by one of eleven warning centres and retain their names throughout their lifetimes to provide ease of communication between forecasters and the general public regarding forecasts, watches, and warnings.[7] Due to the potential for longevity and multiple concurrent storms, the names are thought to reduce the confusion about what storm is being described.[7] Names are assigned in order from predetermined lists once storms have one, three, or ten-minute sustained wind speeds of more than 65 km/h (40 mph) depending on which basin it originates in.[84][88][87] However, standards vary from basin to basin, with some tropical depressions named in the Western Pacific, while tropical cyclones have to have gale-force winds occurring near the center before they are named within the Southern Hemisphere.[74][88]
When I read “Each counterclockwise swirl of wind or burst of puffy clouds there has the potential to” I thought that the sentence should be finished with “be given a name and thus contribute to another ‘record number of storms’ year.”
Yep, that is precisely what has been happening. Then they started naming snow storms in order to bring the populous even further into a permanent state of panic.
Forecasting them is very difficult months in advance, and we’ll see what actually happens by December. However, how they are post-analyzed and labelled concerns me as it does Neil Frank … https://wattsupwiththat.com/2020/12/11/how-busy-was-the-2020-hurricane-season/
The usual useful forecast will be made.
There is a 50% chance the Atlantic Hurricane season will be above average.
Bingo – Ditto. And they just updated their “average” 30-year climatology of storms — which is a joke — it’s a moving reference system. Climatology science is way outdated. Now that we have a longer period of records, climatologies should be greater than a human lifetime — at a minimum.
“ There is a 50% chance the Atlantic Hurricane season will be above average.”
50 % of the time 😉
I beg to differ,Derg,
Being an optimist and looking down the barrel of the Atlantic Hurricane gun from my home I prefer to believe that the 2021 season be below average 50% of the time and this year especially. My advice to similarly domiciled folk is to bet on the Hurricane rather than insure against it.
With no deductable and a pay out of 80% of the premium $ versus 30-40% payout less deductable by Insurance your bookie is a much better bet. .. at least to the mathematically inclined.
Cheers
Mike
so we should drive MANY MANY ships with huge propellers around to mix up the ocean to prevent hurricanes.
give me trillions to make this happen please.
I believe one of Biden’s green job creation schemes is to send thousands of people in pedaloes to the mid-atlantic for just this purpose.
Floating wind “mills” to churn the waters. Kill two birds with one blight above and below the surface.
maybe toss all the soon to be banned gas boilers into the ocean to create turbulence too?
Of course the real main reasons that a hurricane cools the ocean are the latent heat of vaporization that is pulled from the ocean to evaporate all that water, and the cool rain that falls after the water vapor condenses high up in the atmosphere.
Not saying that it doesn’t also churn the surface water, but how do you leave out evaporation and rainfall to leave the impression that surface churning is the only cause?
I left that out just to see who was unhappy enough with their life to miss the sarcasm in my post.
congrats you win.
“Coastal communities are already on the front lines of climate change with sea level rise. ”
“The potential for changes in extreme events like tropical storms, with their complex interactions with the atmosphere and ocean, are why hurricanes have steadily risen to be a top research priority.”
ROFL
I do believe that climate change happens everywhere, not just on the coasts. And saying extreme events have risen…to be a top research priority…is admitting they don’t know if intensity has actually changed despite all the media howling.
Robert,
He might be quite earnest, but is quite indoctrinated as well as working for an employer where virtue signaling is important. From his bio, at his link above
I haven’t seen them take climate out of climate change. Perhaps now the coming buzzword will be global change — I think AOC used that at least once.
Hurricane? Cowabunga, dude, surf’s up!
Considering hurricanes have been around for ever why is it the data above only from 1980?
I note in the article“…..record year for hurricanes in 2020” ?
NOAA forecast for 2020?
”The 2020 NOAA forecast calls for a likely range of 13 to 19 named storms (winds of 39 mph – 63 kph – or higher), of which six to 10 could become hurricanes (winds of 74 mph – 119 kph – or higher), including three to six major hurricanes (category 3, 4 or 5; with winds of 111 mph – 179 kph – or higher).1 Jun 2020”
Actual hurricanes for 2020?
”Major hurricanes (Cat. 3+)7 (record high, tied with 2005)Total fatalities≥ 442 totalTotal damage> $51.146 billion (2020 USD)”
The largest hurricane was Category 4,
certainly not what one would call a record year? Not even a record year since 1980.
If you want Pure Sensationalism nonsense then as usual read articles from The Guardian😂
The more you look into the stats the more you realise how they are being misrepresented.
I found this earlier: https://www.nhc.noaa.gov/pdf/nws-nhc-6.pdf
It’s an interesting read, and within it was this table:
“Number of hurricanes by category to strike the mainland U.S. each decade. (Updated from Blake et al., 2007)”
…which is the important stuff right? no one really cares about storms swirling about out in the Atlantic (except shipping, but they can avoid it).
Turns out the decade from 1851-1860 (CO² 285ppm) was pretty much identical to 2001-2010 (CO² 390ppm), and both decades separated by 160 years come very close to the average for the whole period.
Worse than we thought….errr not so much actually.
Regards hurricane intensity. With modern sensing technology and increased observations we are far more likely to measure the particular peak intensity of any system. This means any trend in extreme wind or pressure are likely biased upward at the near end of the historical record.
Lots of stuff in there, some of it may be useful. It is good to be aware of hurricanes, I just watch NOAA myself. Atlantic Hurricane site Less climate panic, at least so far.
Oh NOAA, not again!
I can’t argue with some of the lecture/discussion, except some of the ideology is obviously paid for by climate creeps. I recommed against subscribing to the Conversation — it isn’t one, and you needn’t pay any attention to those who are pretending to have one there. I left another comment above with a link to NOAA maps for tracking U.S. Northern Hemisphere hurricanes. NOAA’s other satellite and observational links seem quite good to me, and can be reached from the menu at the GOES East Full Disk animated page, which is where I start.
I distinctly remember when Harvey was making landfall, the claim was 130+ sustained winds.
It was 74 reported at the stations.
None of the hurricane tracking is valid.
Such as pretty much everything funded by taxpayers, the reports are just lies.
Same thing was said about Michael couple or years back. But the Panhandle damage near the eye was in fact about Cat 5. Complete wipeout, just like Homestead with Andrew.
There is an oft under appreciated hurricane Cat metric ‘issue’. The metric is supposed to be sustained windspeed at about 10 feet (not gusts) just outside the eyewall. That is a typical weather station anemometer height, but in practice too low to eliminate surface drag from waves and trees and structures. And, the further away from the eyewall any ground measurement is taken, the slower the wind speed will be (figure skater effect). The typical eyewall is ‘small’, on the order of ten miles across for a major hurricane. More intense hurricanes are more compact, so have smaller eyewalls (conservation of momentum), so will show this locational reporting issue more. The Cat system was intended to predict the worst likely damage, not the average damage across the whole hurricane.
Unfortunately most people misunderstand and believe that those maximum speeds occur under most of the cloud cover. Speeds can vary even at small distances so maximum winds may never hit buoys and recording instruments at all.
From what I’ve read, it’s the reason for the discrepancies is actually worse than most people realize. A description on NOAA’s website for one storm said that direct measurements had not shown hurricane force winds, however, based upon the air pressure readings, and the fact that not every location could be measured, hurricane strength must have been reached somewhere. They declared a hurricane based solely on air pressure differentials.
Well, ok, that might even be correct, but how do you compare the numbers with past years that did not have the air pressure data, or did not employ that methodology even if they did? Everything is slanted to show an increase in the number of storms.
Forgive my ignorance, but is cold air [lapse rates] just as important as warm air for hurricanes to develop? When warm air is released at altitude does that not decrease lapse rates? so what keeps hurricanes going; only the warmth of the ocean surface?
Alf, since I live directly on the ocean in Fort Lauderdale, have studied hurricanes intently. National Hurricane Center has some good educational graphics. Been thru 3 in 2004, then Irma. Had several other near misses where we experienced high end tropical storm conditions below Cat 1.
The post minus the obligatory climate clap trap is a quite good general overview. The lapse rate doesn’t really play a role, other than enabling the release of evaporation heat energy at altitude. The main formation factors are mixed zone sea temperature and wind shear. Higher temps with less shear favor formation. We expect higher than average this year because the
La Nina conditions means reduced shear.
One thing the post did not mention that is important. Major hurricanes are usually smaller in diameter due to the conservation of momentum. Catastrophic Cat 5 Andrew at Homestead in ~1990 was hardly felt in Miami, a mere ~60 miles away. That is what made Irma so unusual. We were 110 miles away from the eye when it made landfall below Naples (width of whole peninsula at Alligator Alley, yet experienced high Cat 2/low Cat 3 with significant damage to every east facing unit on our 12th floor except ours, because we are tucked into a little ‘alcove’ given how the building is laid out. By significant, I mean the very heavy 150 mph hurricane proof sliding laminated glass door to the ocean facing balcony of the unit immediately to our left was blown in completely and the unit interior was effectively destroyed by wind and water penetration. The one to our right was blown off its heavy track enabling some flooding. For us, the wind driven rain nearly overtopped the 6 inch vertical aluminum extrusion backing the sliding door frame track. It was blowing so hard for hours that the water could not drain down the very slightly sloped balcony, but rather was blowing back into the sill drain slots. This despite the fact that the balcony railing is hurricane proof glass panels set in aluminum extrusions. It is 4 feet high.
I live on the central west coast about a mile from the Gulf. When Irma jogged inland, the flow of warm moist air from the SW was cut off and the west side of the storm basically fell apart. However, the SE winds took over and came to the center of the storm from the Atlantic. We got very little damage in my area, others on the East coast not so lucky. It was terrible that I rejoiced when I saw it go inland knowing I was going to be safe but someone else was going to pay the price.
Tom, our L’Hermitage complex sure did. Took a year to fix it all up. Only worse was 2004 Wilma. We took a bullseye near eyewall direct hit, and it took two years to fix it back up. The pool deck landscaping was completely destroyed. The tennis courts were completely destroyed. And our complex is reinforced concrete class 1 post Andrew code towers, built between 1998 and 2000. I bought in Jan 2000.
Tom, the other impacting factors not typically remembered with Irma was its ride on the Cuban coast for several hours and its right turn into the very shallow Florida bay. Both of those items significantly weakened Irma with Florida bay’s TCHP disappearing when the North side of the storm sucked it up and left nothing for the eyewall to have on the back side. Imagery showed it as a half a cane upon landfall, meaning there was little to no sustained convection on the back half of the circulation. Once we saw the storm do a hard right turn to the coast, we, in the Sarasota, area decided not to evacuate. Prior to that time, the storm was predicted to ride the West coast and that would have been a whole different storm story if it had occurred.
Yup, I live in Venice and as I said, was glad to see the west side fall apart.
Tropical storms are not extreme events in the sense the term was being used by this writer. He appears to be all in on the Climate Change position.
Good article, except for the plug about “GloBaL WarMinG” !! But the truth is, he’d be defunded, banned from publishing, without it !!
And yet there are no significant trends regarding quantity, intensity, ACE, land falling etc
This year is different….all the butterflies in west Africa are being watched….whenever one of the little critters flaps its wing wrong and causes a low pressure to develop…we know it will likely turn into a cane headed for the USA..,.all due to climate change causing more butterflies.
l think this year’s Atlantic hurricane season will on the whole be a weak one, but there will be one risk to look out for.
Thanks to extended jet stream activity over the mid Atlantic there is likely to be increased wind shear over the mid Atlantic this season.But extended jet stream activity over the eastern Pacific will make it harder for a El Nino to form this year. So the risk l see this year is that if a strong hurricane does form its likely to be within the Gulf of Mexico area and also the risk of it been slow moving.
That first graph is bogus, they name every single low pressure wave that develops and tell people it is a hurricane. The standard used to be land falling storms were named. Not enough of them to scare people with, so it was changed. Look at your local TV weather. They are all, ALL, called Severe Weather Center, or some variant thereof, with flashy, glaring graphics and dramatic music. All so they can not predict the local weather with any accuracy at all in a 72-120 hour time frame.
In 2020, every little puff of wind that exceeded the threshold was called a tropical storm, even if it lasted a few hours, as several did. As the ACE (itself a flawed but better measure of hurricane intensity) score showed us, 1.3 std dev above the average of the last 40 years is not anything to write home about. I used this period (1969-2020) because I felt that earlier ACE calculations are suspect because we use planes and satellites now and see more storms.
Hurricanes grow because of a temperature difference, not just warm water. If the air pulled in is already warm & moist it doesn’t grow. Hurricanes don’t grow if the top is continually being blown away.
The map of total precipitable water available on Arctic sea ice graphs – daily graphs the last one shows the hurricanes forming days before the news gets onto them.
Worth a look as it is a moving picture over the preceding 24 hours.
A very cold Peruvian Current heralds another wave of La Niña.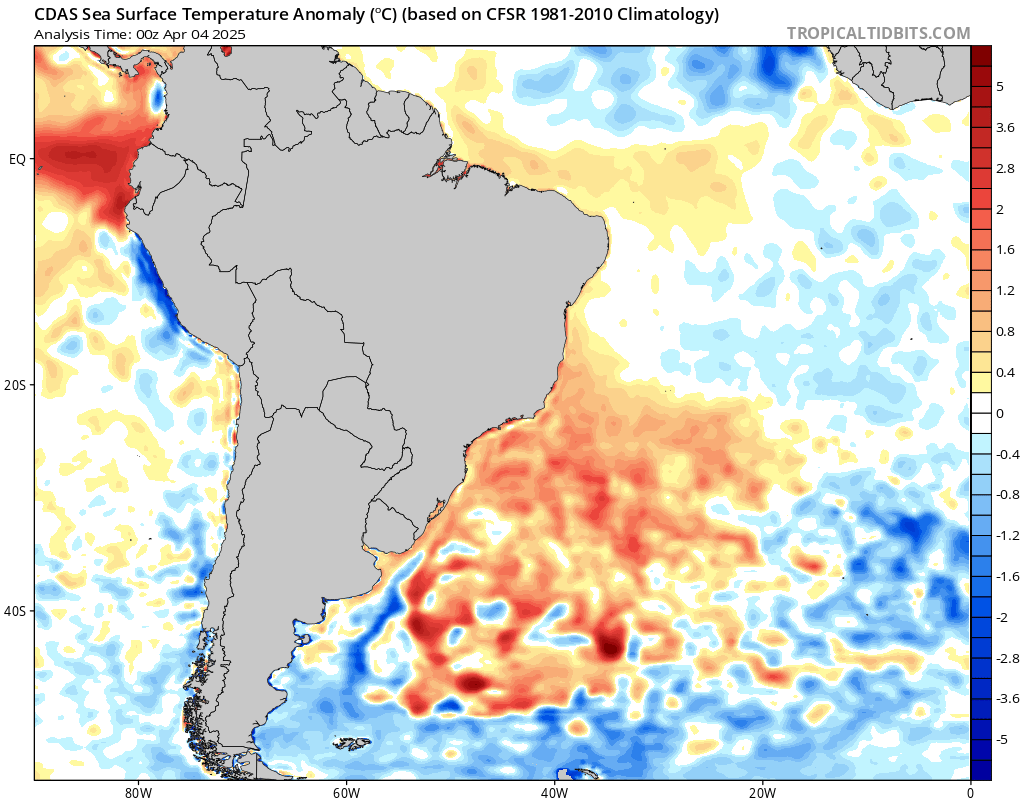
Hurricane season will be active, especially in the Gulf of Mexico.
The Conversation again, is it?
I haven’t updated my work in quite a while, but in the mid-2000s I compared the hurricane stats for the Atlantic basin against a Poisson process with a drifting average rate. The result? a secular rate increase of Zero for 1940s through 2004. I.e. a constant Poisson process.
I will bet that the same analysis produces the same result now.
The figure of hurricanes counts against time in this “Conversation” is flawed for having too many categories jammed together and inconsistent measurement over time — i.e. imagine doing measurements with a voltmeter that may be drifting with time unnoticed because of no periodic QA/QC.