Guest Post by Willis Eschenbach
Clouds are said to be the largest uncertainty in climate models, and I can believe that. Their representation in the models is highly parameterized, each model uses different parameters as well as different values for the same parameters, and so of course, different models give very different results. Or to quote from the IPCC, the Intergovernmental Panel on Climate Change:
In many climate models, details in the representation of clouds can substantially affect the model estimates of cloud feedback and climate sensitivity. Moreover, the spread of climate sensitivity estimates among current models arises primarily from inter-model differences in cloud feedbacks. Therefore, cloud feedbacks remain the largest source of uncertainty in climate sensitivity estimates.
The question of importance is this—if the earth heats up, will clouds exacerbate the warming or will they act to reduce the warming? The general claim from mainstream climate scientists and the IPCC is that the clouds will increase the warming, viz:
All global models continue to produce a near-zero to moderately strong positive net cloud feedback.
My own theory is that clouds and other emergent climate phenomena generally act to oppose any increases in surface temperature. So me, I’d expect the opposite of what the models show. I figured that there should be a negative cloud feedback that opposes the warming.
So I thought I’d take a look at answering the question using the CERES satellite dataset. As a prologue, here’s a short exposition about measuring the effect of clouds.
Clouds have two effects on the surface radiation balance, and thus on the surface temperature. On the one hand, they reflect sunlight (shortwave radiation, “SW”) back out to space, cooling the surface. And on the other hand, clouds block and absorb upwelling thermal (longwave, “LW”) radiation from the surface, and they re-radiate about half of what is absorbed back down towards the surface. This additional downwelling radiation leaves the surface warmer than it would be in the absence of the clouds.
We can actually physically perceive both of these effects. During a clear summer day, a cloud comes over and instantly cools us down. And during a clear winter night, a cloud comes over and we immediately feel warmer.
These two changes, cooling and warming from different phenomena, are lumped together under the term “CRE”, which stands for the Cloud Radiative Effect. As mentioned above, it has a shortwave (SW) and a longwave (LW) component, and when added together these give us the “Net CRE”. Planetwide, as is generally known, the net CRE averages out to a surface cooling effect of about -20 watts per square metre (W/m2). That is to say, clouds cool the surface more than they warm it. Here’s how that plays out around the planet.

Figure 1. Net cloud radiative effect (LW warming minus SW cooling)
Note the strong cooling along the Inter-Tropical Convergence Zone (ITCZ) above the Equator, and in the Pacific Warm Pool north of Australia. There, the clouds are cooling things by up to sixty watts per square metre (W/m2). As a comparison, a doubling of CO2 is said to increase warming by 3.5 W/m2, an order of magnitude less …
And here’s the same image, but from the Atlantic side:
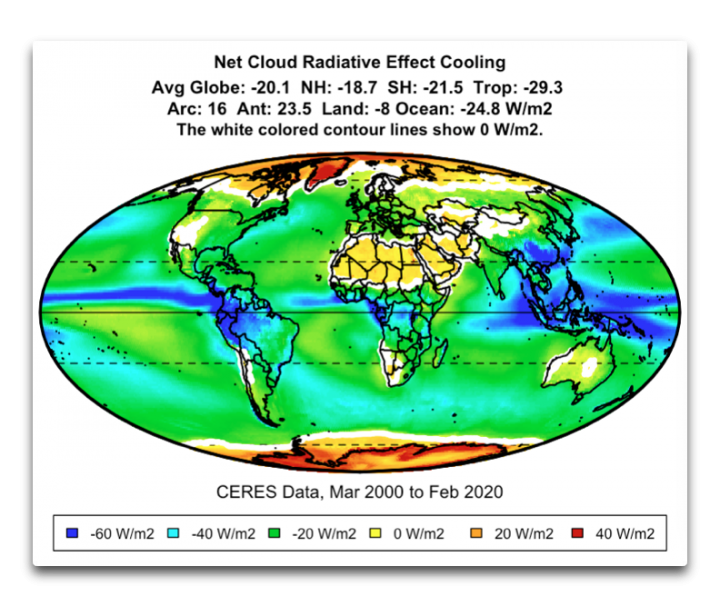
Figure 2. As in Figure 1, Atlantic side. Net cloud radiative effect (LW warming minus SW cooling)
As you can see, clouds have a net cooling effect everywhere except over some deserts and at the poles. At the poles, clouds actually warm the surface. And on average, the cooling is much greater over the oceans (-25 W/m2) than over the land (-8 W/m2).
In short, the clouds are cooling the hot tropics and warming the cold poles, just as my theory predicts.
The real question, however, is not the static condition. It’s what happens as the planet warms. For that, I calculated the changes in the net CRE with respect to surface temperature for each 1° latitude x 1° longitude gridcell. Here are those results, again seen from both the Pacific and the Atlantic sides.
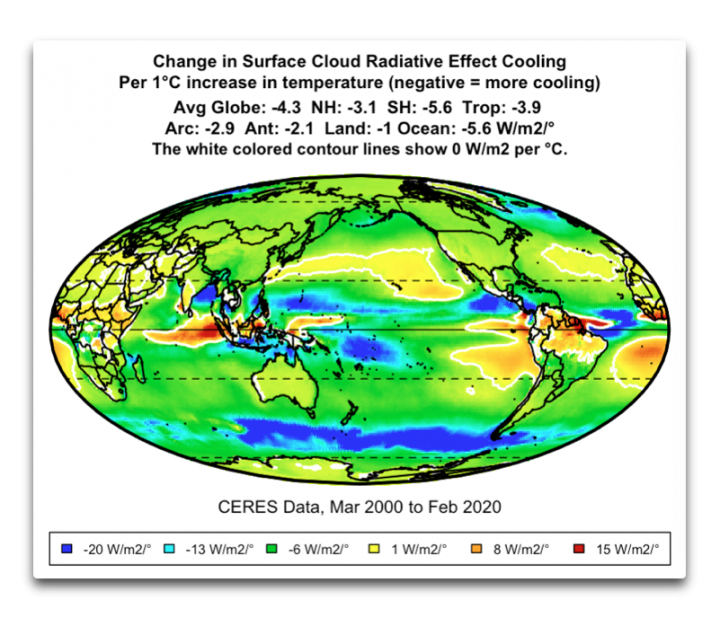
Figure 3. Change in net cloud radiative effect (LW warming minus SW cooling) per one degree C of surface warming. Negative values indicate that there is greater cloud cooling with increasing surface temperature.
And here is the Atlantic view.

Figure 4. As in Figure 3, but an Atlantic view. Change in net cloud radiative effect (LW warming minus SW cooling) per one degree C of surface warming. Negative values indicate that there is greater cloud cooling with increasing surface temperature.
Now, this is a most interesting result. As predicted by my theory that clouds are a major part of the thermoregulatory system keeping the planet from overheating, we find that almost everywhere on earth, as surface temperature increases, cloud cooling also increases (negative values). This is true in both hemispheres, in the tropics, on land, on the ocean, and in both the Arctic and the Antarctic. Only in isolated patches of the ocean does cloud cooling decrease with increasing surface temperature.
I’m currently in the process of writing up my theory that emergent phenomena act to keep the surface temperature within narrow bounds, for submission to some as-yet-undecided scientific journal. This analysis is most definitely evidence in support of that theory, so I’m glad I did this particular piece of work. But man, I hate writing for the journals. I always feel like I need to give myself a lobotomy to write in the thick turgid long-paragraph style that they like. Plus with the small word limits and only a given number of graphics, I feel like I’m fighting with my hands tied.
Ah, well, it’s just another part of life’s rich pageant, and I learned an important lesson in my 17 years living on small South Pacific islands—the universe truly doesn’t give a shift what I want to happen next.
So I’ll just have to keep on keeping on …
Tonight we have rain here in a dry year, so life is good. I got my second vaccine shot two days ago. Other than a sore arm and one day of feeling like I was hastily assembled out of random spare parts, not much in the way of side-effects. People have asked me why I got the vaccine … I say everyone has to decide for themselves the balance between their known COVID risk and the unknown vaccine risk.
Me, I’m 74, and if I didn’t do myself serious genetic damage in the ’60s and ’70s, it certainly wasn’t for lack of trying. Add in the odd co-morbidity or two, not unusual in a man of my late youth. Then there’s the fact that my gorgeous ex-fiancee is a front-line health worker, a family nurse practitioner who is exposed because she administers COVID vaccine shots and gives sports physicals at the local college. (And, I might add, she also did the same before she got vaccinated last month. Big props to her, and to all of the worlds’ medical personnel putting their lives on the line to fight the pandemic.)

Finally, and to our immense delight, our un-vaccinated daughter, son-in-law, and 19-month-old granddaughter are now all living together with us in our big old rambling house in the forest that I built with my own hands …
So getting the vaccine was an easy choice for me … but I don’t fault anyone for whatever they might choose.
Best regards to all, stay healthy,
w.
As Usual: When you comment, I ask that you quote the exact words you are discussing, so we can all be clear as to both what and who you are responding to.
Technical Notes: I’m using the “surf_cre_net_tot” (surface CRE net total) file from the CERES EBAF (Energy Balanced And Filled) dataset for the CRE data. For the surface temperature, I’ve converted the “surf_lw_up_all” (surface longwave up all conditions) CERES file to temperatures using the Stefan-Boltzmann equation. This gives surface temperatures that are slightly different from the Berkeley Earth gridded surface temperature dataset … which in turn is slightly different from the HadCRUT gridded surface temperature dataset … which in turn is slightly different from the GISS LOTI gridded surface temperature dataset … they’re all four close, but which one is right? Nobody knows, so I use the CERES data. It has the huge advantage of agreeing in every gridcell with the energy flows given in the other CERES datasets, including of course the surf_cre_net_tot dataset I used in this analysis.
You built that forest with your own hands??!!?? I was impressed with you already, Willis, but now the impressionism is off the charts. 🙂
About length or writing style, you might try the online journal PeerJ. Their series includes Environmental Science. They’re well-respected and as an on-line journal they don’t have strict word limits.
PlosOne has similar standing, but my expereince trying to publish there was so poor that I can’t in good conscience recommend them.
I’ve always wondered whether warming would cause increase the rate of Hadley cell convective circulation. Presumably that would increase the rate of IR radiation to space. Is there any way your data addresses that possibility?
IMO, Willis should write it as he wants, submit it and see what stylistic changes the journal might urge for acceptance, if it pass review on its scientific merits.
Pat Frank: “I’ve always wondered whether warming would cause increase the rate of Hadley cell convective circulation. Presumably that would increase the rate of IR radiation to space.”
WR: Convective circulation is dependent on both temperature and water vapor. High temperatures before the monsoon starts show that a large quantity of water vapor (caused by the first rains) is needed before the convective cooling mechanism starts working well. Only after the first rains the temperature at the surface will drop. See monthly New Delhi temperatures and rainfall: July has about the same insolation as May but only after the first rains maximum temperatures drop by 6 degrees.
https://www.buienradar.nl/weer/new%20delhi/in/1261481/klimaat
Over oceans there are probably two systems. First the rate of convection will go up, stimulated by the higher evaporation. Willis already showed that clouds form earlier on the day when the temperature in the early morning is higher than normal. In case that is not sufficient and further warming of the tropics/subtropics continues the area of ‘high evaporation’ will extend to higher latitudes. On its (longer) way to the equator high moisture surface air will earlier reach momentum to create high convection. Then the surface area from which high convection takes place broadens.
The result is for both cases the same: more surface energy will reach the higher elevations lacking abundant water vapor and therefore from those elevations the released energy can be radiated to space. A widening of the area of subtropics (descending dry air) also extends the surface area with ‘low water vapor’ from where also from lower elevations effective radiation to space can take place. The whole system enables radiative heat loss from the higher elevations, cooling the warmest wet surfaces below and cooling the Earth as a whole.
[Snipped. Violates site policy, and is childish and nasty to boot.
w.]
Where you live, and how old you are is irrelevant to climate science.
William, I guess you must be new to the blog. It covers much more than climate science. I’ve written on a host of subjects here, including my own life. If you find that problematic, you can either suck it up or find another blog. It’s not going to change.
I’ve snipped your comment above for the reasons listed above.
w.
Most of us here, are old and feeble. Be grateful we don’t post pictures of our operation scars.
Why are you so rude?
Wonderful post, as always, Mr. Eschenbach. And as a bonus, I finally found buried within the link to your website, and more of your amazing personal stories. I love ’em!
Thanks, Michael. For those interested in stories about my life, they’re here.
w.
w – As you may have seen, I looked at a temperature-cloud relationship a while ago, and found that globally a cloud increase followed a temperature increase a few months later. To my mind, the time difference is important. The paper was never in fact published – the journal ended up saying they weren’t interested – and you are most welcome to use any part of it or any idea in it in any way you like. https://wattsupwiththat.com/2020/06/05/cloud-feedback-if-there-is-any-is-negative/
That’s the effect that makes sense, yet NASA claims that “climate scientists” predict fewer clouds in a warming world. Counterintuitive, and contrary to your finding.
Warming causes more clouds, whose net effect is cooling, thus a negative feedback as an element of Earth’s homeostatic processes.
It has long been my understand that it was generally conceded on all sides that volcanic eruptions caused temporary atmospheric cooling by seeding increased cloud cover. I’ve even seen that used as an excuse for why predicted warming had not occurred at various times. So how can modelers or anyone else turn around and argue that clouds do not constitute negative feedback?
No, thats a misunderstand CLAUDE.
“the most important climatic effect of explosive volcanic eruptions is through their emission of sulfur species to the stratosphere, mainly in the form of SO2 [Pollack et al., 1976; Newhall and Self, 1982; Rampino and Self, 1984] but possibly sometimes as H2S [Luhr et al., 1984; Ahn, 1997]. These sulfur species react with OH and H20 to form H2SO 4 on a timescale of weeks, and the resulting H2SO 4 aerosols produce the dominant radiative effect from volcanic eruptions. Bluth et al. [1992], from satellite measurements, estimated that the 1982 E1 Chich6n eruption injected 7 Mt of SO2 into the atmosphere, and the 1991 Pinatubo eruption injected 20 Mt.”
https://www.aos.wisc.edu/~aos915/Robock_2000.pdf
“So how can modelers or anyone else turn around and argue that clouds do not constitute negative feedback?”
The IPCC/modelling process is strange, in a world of settled science. When you read an IPCC report, you read things like “the spread of climate sensitivity estimates among current models arises primarily from inter-model differences in cloud feedbacks” (https://archive.ipcc.ch/publications_and_data/ar4/wg1/en/ch8s8-6-3-2.html).
Given that the spread of climate sensitivity estimates is a factor of 3, that adds up to a lot of uncertainties re clouds.
As far as I can make out, this is what happens: The modellers create their models with a bit of physics and a lot of parameters. They manipulate all the parameters to get a match to the overall temperature change up to today. They get as far as they can on matching interim changes, like the modest cooling up to ~1970, but of course it’s all very difficult because their only major parameters involve clouds and aerosols while the real climate drivers on those timescales (ocean oscillations etc) are not in the models. Because CO2 and temperature are both knowns, and because they have to tune the models to fit both, the main variations come from clouds and aerosols. As Wang et al say “models with a more positive cloud feedback also have a stronger cooling effect from aerosol-cloud interactions. These two effects offset each other during the historical period when both aerosols and greenhouse gases increase, allowing either more positive or neutral cloud feedback models to reproduce the observed global-mean temperature change.” (https://wattsupwiththat.com/2021/03/09/compensation-between-cloud-feedback-ecs-and-aerosol-cloud-forcing-in-cmip6-models/). But the cloud feedback in all if this isn’t a real cloud feedback; it’s all based on the parameters manipulating till they match temperature – with no mechanism for the cloud and aerosol behaviour just parameters – and then the cloud behaviour is called cloud feedback. It doesn’t actually matter whether the clouds grow or shrink, as long as they get the temperature to match
‘And on the other hand, clouds block and absorb upwelling thermal (longwave, “LW”) radiation from the surface, and they re-radiate about half of what is absorbed back down towards the surface.’
How do you determine that about half absorbed is re-radiated?
Clouds radiate regardless of the surface based on their temperature.
I understand that the surface radiates towards the clouds.
I can accept radiation from IR gasses can be downwelling and upwelling, but it would be closer to 30% rather than %0% downwelling(hitting the surface effectively).
Clouds are not IR gasses they are bits of water that would radiate like a blackbody (taking reflectance into account).
Willis; I must say, these two threads on climate modeling have been a delight to read. The comments(+links) have been excellent in regards to subject matter. Not an IT but competent in electronics. I’m sure Heath Kit is familiar to most. Have always enjoyed computers. Started out with Texas Instr. programmable handheld in the 80’s. To the point: all modeling is absolutely trash. Three links below show what is missing.(1)a good start is here+ https://www.geoengineeringwatch.org/ (2)missing from above-add electricty+ https://m.youtube.com/user/Suspicious0bservers(3)the biosphere disaster+(https://www.carnicominstitute.org/) And we haven’t even touched the nuclear radiation aspect. Another subject. If you wish to do research; 3-11 truth + the pommer report
The thinking in the “climate theory” is that the troposphere expands when earth get warmer.
That will cause top of cumulus clouds to reach higher altitudes. The “theory” assumes that the lapse rate stay the same.
The cloud top will thus be cooler (due to higher altitude) and subsequently radiate less -> warming effect !!
That is the “theory”.
I have spent a lot of time to read the “climate theory”. Almost all of the CO2 warming comes from increased radiation altitude (from CO2 and clouds). Not increased absorption.
Leftists know clouds’ net effect is global cooling rather than global warming, however, if they revised their silly models to reflect reality, CAGW would be a disconfirmed hypothesis.
it’s also important Leftists keep this net-cloud warming charade going, because when (not if) CAGW is officially disconfirmed, they’ll need a good excuse as to why they: wasted $100’s of trillions, destroyed electrical grids, made energy prices skyrocket, caused rolling blackouts, destroyed economies, kept 3rd-World countries impoverished, lowered living standards, held back technological advancements, attacked/fired skeptical CAGW scientists, scared our kids, etc.,,
”Never let a good charade go to waste”…..
From Mishra, 2018 : Investigating changes in cloud cover using the long‐term record of precipitation extremes
“The Global Precipitation and Climatology Project (GPCP) precipitation data are used in this study to relate the changes in heavy and light precipitation with those in convective and low cloud cover, respectively, from the Visible and Infrared Scanner data of the Tropical Rainfall Measuring Mission available from 1998 to 2014. Slopes were derived between changes in precipitation extremes and cloud cover using monthly data. These slopes were applied to long‐term trends of precipitation extremes from GPCP data (1979–2016) to infer long‐term changes in convective and low cloud cover. Cloud cover derived using this technique shows substantial inter‐monthly and inter‐annual variability. The results show an increase of about 4.48 ± 1.9% per decade in convective cloud cover over tropical ocean (25 ° S–25 ° N). This is consistent with National Oceanic and Atmospheric Administration (NOAA) High Resolution Infrared Radiometer Sounder (HIRS) observations, which show an increase of about 5.04 ± 2.18% per decade in convective cloud cover over tropical ocean. In the present study an increasing trend of about 5.54 ± 2.07% in convective cloud cover over land (20 °–60 ° N) is also derived, which is comparable to the NOAA HIRS trend of about 6.57 ± 2.53% increase per decade. Decreases of about 3.52 ± 1.69% and 4.26 ± 1.48% per decade in low cloud cover over tropical ocean and northern mid‐latitude land, respectively, are reported and are consistent with decreases of about 3.05 ± 1.68% and 5.31 ± 2.22% from NOAA HIRS data over those regions.”
Willis, have a look at the satellite image of the Deepwater Horizon spill, the big one that covers most of the Gulf. Look carefully at the shades of colour, the cloud lines and the texture of the sea surface.
I see a large, oblong shape that is a darker shade of grey blue, with its edges roughly defined by lines of what looks like stratocumulus clouds. It’s the top image at h etc w etc nasa.gov/topics/earth/features/oil_spill_initial_feature etc (not a proper link because I can’t remember if they end up in the sin bin.)
Guess: within that shaded area a very thin layer of light oil is supressing wave breaking, reducing the number of salt aerosols and hence the amount of stratocu.
Your theory that temperature is controlled by cloud formation is obviously correct. However, it is possible to supress the cloud effect by altering the physical characteristics of the ocean surface. Look at Seawifs for (old) data about how much light oil is spilt on the oceans.
Feynman says first we guess, then we check the data. If the data doesn’t agree with the guess then the guess is wrong. The data here would be aerosol counts over the spill and the smoothed area, but unfortunately when Judith Curry tried to get a sampler over the Gulf the aircraft was tied up on another project. Sea surface temperatures may be recorded somewhere.
A smooth supresses wave breaking up to Force 4 (personal observation over Atlantic en-route to Madeira, images available) and prevents cloud formation. The cloud thermostat is thus reset to a higher level — even the most convinced anti-AGWer accepts that there is some warming, even though it is nowhere near the models’ panic results.
Essentially the needed data is by how much polluted surface would result in an albedo reduction sufficient to explain the lukewarming, and how much polluted surface is actually out there?
Guess 2: the Blip was caused by the Battle of the Atlantic. The data has been very thoroughly stamped on by the UEA so good luck with that one.
Guess 3. Lakes with runoff from large modern towns will warm at a rate connected somehow to the growth of the population on their shores.
Etc.
Guess 4. Smoothed surfaces have lower albedo than unpolluted. Evaporation is reduced. (So less cloud even absent the aerosol effect.)
Experiment: Find a large unpolluted lake. Spill a sufficient amount of olive oil on it — for calculation refer to Benjamin Franklin, Clapham Common pond. Measure the warming effect and humidity.
Etc.
JF
Julian, as always your ideas are interesting. As a lifelong mariner, I’m well aware of the effects of oil on the breaking of waves and the like.
The challenge is that as is usual in the study of climate, there are no simple effects.
• As you say, the oil layer on the surface reduces the amount of salt spray, which is the main source of cloud nucleation over the ocean. HOWEVER …
• It also reduces the amount of the evaporation of water vapor from the ocean surface, which is necessary for cloud formation.
• The reduction in evaporation reduces oceanic heat loss.
• The reduction in evaporation decreases one of the two main drivers of thunderstorm formation (temperature and water vapor), changing the number and timing of the emergence of these major climate players in unknown ways.
• By reducing the white breaking waves, spume, and spray, the oil decreases the oceanic albedo.
• The lack of breaking waves affects the rate of mixing of the surface heat down into the mixed layer.
• By reducing spray and spume, the lack of breaking waves greatly reduces the surface area available for evaporation.
• The oil layer affects the rate and time of onset of the daily nocturnal overturning of the mixed layer.
• This change in the rate and time of onset of overturning affects the rate of nocturnal heat loss.
Now, perhaps you are courageous enough to speculate on what the net overall effect of these very different phenomena might be … but even if you are, I can’t see how to untangle the phenomena enough to tell just which phenomena in what amount and where might be responsible for whatever we might observe.
My best to you as always, long time no see …
w.
NASA quite clear they cannot model clouds…
“NASA has conceded that climate models lack the precision required to make climate projections due to the inability to accurately model clouds. “
https://notrickszone.com/2019/08/29/nasa-we-cant-model-clouds-so-climate-models-are-100-times-less-accurate-than-needed-for-projections/
Looks like Figures 3 and 4 support Svensmark’s hypothesis and CERN’s research. Biogenic amines (primary aerosol of cloud condensation nuclei in the Southern Hemisphere) and galactic radiation steadily increasing in the last two solar cycles.
Willis – maybe turn the question around. If the cloud feedback was indeed positive, then more cloud would produce warmer temperatures which would cause more water to evaporate, causing more clouds, thus you’d soon have total cloud-cover. Similarly, less cloud-cover would lead to lower temperatures, less evaporation, and even less cloud-cover. Only the exact cloud-cover to maintain the current temperature would result in a constant level of cloud-cover, and it would be an unstable equilibrium that, if disturbed, would then head inexorably to one extreme or the other.
Given the daily variation of cloud-cover, this unstable equilibrium is obviously not tenable. It follows that feedback from clouds can only be neutral or negative, and observation (measuring temperature when a cloud goes over) implies a strong negative feedback.
A couple of years back I spent a while watching a small cloud (maybe 30m or so across) on an otherwise pretty cloudless and windless day (I was out pruning so over a few hours). The shape was changing as some parts condensed and others evaporated. It’s easier to see this on a small cloud, though of course if you look carefully at a large cloud you also see the shape change over time. Given that a cloud is thus a dynamic form, and obviously pretty localised, it’s going to be hard to parameterise a large cell to determine what percentage cloudiness it will be. For that little cloud, why was it precisely there and not 100m further away? There must be a dependence on precise ground conditions and where the updraughts occur.
Climate models thus can’t get the cloudiness right if they try to have 100km cell sizes. You need to use cells of around 100m or less, and you also need to divide with more resolution vertically. Over at Chiefio there was a discussion on the development of a new climate model (see https://chiefio.wordpress.com/2020/12/08/cell-model-top-level-flow-of-control/ ) and if you use 100m cells then to cover the world you need 51 billion cells (5.1e+10), and if you run 100m divisions in height you need around 500 times that. Call it 25 trillion (2.5e+13) cells total. If we then move the air-mass from one cell to its neighbour, and allow for winds up to 250km/h (70m/s), you need to run a maximum time-step between calculations of around 1.5 seconds. You need a pretty huge computer to be able to do the calculations for those 25 trillion cells each 1.5 seconds and even run a real-time simulation using the real physics of what happens. What happens at ground-level is pretty complex, of course, but once you’re above ground-level the calculations mainly involve conservation of momentum and energy, together with condensation or evaporation of the water and whether or not a cloud forms to reflect incoming radiation and shadow the ground.
Given that even a reasonably-dense simulation is so far beyond capability, the only practical possibility is to use larger cells, and since they will be too large to resolve the clouds you have to parameterise the “cloudiness” rather than being able to predict actual clouds individually and calculate their effects as they shadow the ground under them, where the current angle of the Sun determines where the shadow occurs relative to where the cloud is. It’s thus necessary to simplify the problem to one that our computers can actually calculate this side of the end of the world, but that model is actually too simple to give results that are anyway near accurate. Instead of using physics principles to calculate things, you would have to have adjustable parameters and they would interact, so you can’t be certain you’ve got the calculations right, but only that the general situation matches the historic data.
It’s thus not so much that we don’t know clouds, but that the amount of computer-power needed to resolve individual clouds and their effects, over the entire globe, is far too large to actually calculate. Even the data-entry for the ground-level for 100m cells (51 billion cells) is daunting, though some automation would be possible, and what happens at ground level (inclination, type of surface, dampness, albedo, etc.) will determine where clouds form and their size and density.
The salient point about global temperatures is really how stable they are, despite the variations in actual power received from the Sun based on our varying distance from it as well as the solar cycles. That implies a negative feedback.
I suggest that clouds act as a resistance rather than a forcing agent, slowing surface warning during the day and slowing cooling by radiation at night. The daily rate of change in dew point is our best evidence of this.
Willis
Thanks for this analysis of cloud effect.
If you have time can you have a quick look a this work by Erich Schaffer who looked at aviation data on cloud cover and temperature and – to his surprise – came away with the conclusion that on average, clouds warm, not cool:
Austrian Analyst: Things With Greenhouse Effect (GHE) Aren’t Adding Up…”Something Totally Wrong” (notrickszone.com)
To quote from his article:
A huge surprise
Finally, if we add up the above results and look at the annual average (thus seasonally adjusted), we are in for a huge surprise (or possibly no more at this point). The correlation between clouds and temperature is strictly positive. The more clouds, the warmer it is, and that is in a region where models suggest a massively negative CRE.
Obviously something is totally wrong here.
Hatter,
Schaffer shows that there tends to be more cloud when the temperature is warmer, e.g. more cloud in summer, less in winter. One would expect this because when the sun is shining the air is warmer, there is more water vapor present, and more convection, so more cloud. However, Schaffer seems to have gotten cause and effect backwards. He claims (I think) that more cloud causes warmer air, but, in reality, warmer air, in locations like the Aleutian Islands where water is available, causes more cloud.
Willis looked at what happens to the cloud radiative effect “when the world warms.” Figure 3 above shows that a degree Celsius of warming, results in more clouds, which shade more of the earth, thereby preventing further warming.
This is a profound finding. It shows that all global climate models are biased hot because, as the IPCC explains, “All global models continue to produce a near-zero to moderately strong positive net cloud feedback.”
I cannot understand how anyone could think that, over all, cloud has a warming effect. It can keep a cold night from cooling as quickly, but cloud does not only happen at night, and reflecting sunlight (1,360 w/m2) must be a much large effect than re-radiating a few w/m2 on a cold night.
No, that is not what it is. For good reasons I provided a resolution of this relation by month. In July and August for instance, overcast scenarios show lower temperatures than clear skies, which is the opposite of what you suggest. Clouds show the strongest warming effects during autumn and winter. I did explain why that is, so I hopefully do not need to repeat it here.
Thomas
Thank-you, that’s very helpful.
Thanks, Hatter. I took a look at his post. He says a problem is:
Here he is conflating shortwave (“SW”) CRE and cloud albedo. The CERES data gives the following data:
TOA SW reflections, all conditions = 99 W/m2
Surface reflections, all conditions = 29 W/m2
Calculated cloud, aerosol, and atmospheric reflections = 99 – 29 = 70 W/m2
TOA SW reflections, all conditions = 99 W/m2
TOA SW reflections, clear conditions = 53 W/m2
Calculated cloud radiative effect = 99 – 53 = 46 W/m2
TOA CRE SW from file “toa_cre_sw” = 46 W/m2
Given that huge misunderstanding on his part, one that will ripple through all of his calculations, I fear his post is fatally flawed.
w.
Hi Willis, its been a while since I commented on things. Love the house and the post. Learned tons from the comments.
Just an observation, comes from your figure 2, net CRE, Atlantic view.
The net CRE, especially over land, seems to reflect average humidity.
Low humidity desert areas warm while humid forest lands cool.
Overall something like 20-30% relative humidity being the point where an increase in temp has a net cooling effect.
The greening sahara could impact that significantly.
Thanks Willis.
As for the “new” data source that Schaffer identified, aviation records of temperature and cloud cover – does this have value, beyond what is available already in CERES for example?
@Willis
You like dismiss arguments based on your lack of understanding them. And obviously you did not understand this part. So let me explain it.
First let us look at the energy balance as presented by the NOAA:
https://www.weather.gov/jetstream/energy
The chart says clouds would reflect 23% of solar radiation, which means 342 x 0.23 = 78.7W/m2. Obviously they did not differentiate between aerosols and clouds. But it is true that the surface is very dark and hardly reflects more than 7%.
The IPCC however suggests 50W/m2 in LWCF, which is a lot less than 78.7W/m2. Why the difference?
Without reflecting too much about it, one might simply assume it is due to aerosols. And a part of it actually is. But there is something more important going on here. Clouds indeed easily reflect some 70W/m2 of solar radiation. However the LWCF as it is being measured, is defined as the difference between clear and all conditions. So sun light which is reflected by clouds, but would be reflected if there were no clouds, is not counted to the LWCF. For instance LWCF over snow and ice is therefore almost negligible.
For this reason LWCF, as it is defined, is far smaller than the actual amount of solar radiation reflected by clouds.
E. Schaffer
Reply to
Willis Eschenbach March 17, 2021 3:10 pm
You obviously like to open a conversation by insulting people. Stuff that part where the sun don’t shine.
I explained it to you. I’ll try again.
There is a difference between the total reflected before it reaches the surface, and the cloud radiative effect.
Here’s the CERES data
TOA SW reflections, all conditions = 99 W/m2
Surface reflections, all conditions = 29 W/m2
Calculated cloud + aerosol + haze + smog + atmospheric reflections = 99 – 29 = 70 W/m2.
OK, so cloud + aerosol + haze + smog + atmosphere are reflecting 70 W/m2. That’s the number your graphic shows.
Next, we can look at the TOA difference between what gets reflected in “clear” conditions, meaning only aerosol + haze + smog + atmosphere + surface reflections, and what we get when we add clouds to the mix.
TOA SW reflections, all conditions = 99 W/m2
TOA SW reflections, clear conditions = 53 W/m2
Calculated cloud radiative effect = 99 – 53 = 46 W/m2
This is the “cloud radiative effect”. IPCC says ~ 50 W/m2, same thing.
Note that the total of the haze + smog + atmosphere + aerosols is 53 – 29 W/m2 = 24 W/m2
Hope this helps,
w.
It is not an insult when I tell you failed to understand. Btw. we all make mistakes or miss out on something and the discussion should help us in sorting these things out. If you value everything that contradicts your oppinion as an insult, rather than considering the argument, you eventually will become a) very angry and b) very wrong.
E., I don’t know what to tell you. Lots of people tell me I don’t get something or other, and it doesn’t come across as aggro or insulting.
You, on the other hand, accused me of dismissing arguments because I don’t understand them. That’s a whole ‘nother kettle of fish …
w.
I’ve looked at clouds from both sides now
From up and down and still somehow
It’s cloud’s illusions I recall
I really don’t know clouds at all
In tropics an increase in temperature will cause rise in humidity which will block heat from escaping. But at the same time if rise in temperature causes more clouds this could very well be a stronger negative feedback than the humidity positive feedback. Tropics are already humid so more humidity will not add as much positive feedback it seems. Also sun is so strong in tropics clouds have more of an effect since they block a stronger sun. Any cloud changes in tropics are very significant.
“ clouds are cooling the hot tropics and warming the cold poles”. And as we know they cool hot days and warm cold nights.
So clouds act to mediate temperature extremes, as does CO2 in fact, because that also warms the cold places and times.
And if we look at the moon, same insolation, +105 C, – 140 C day to night, we should be dam grateful for our atmosphere, clouds, and CO2!
These radiation measurements are not appropriate to determine LWCF! There are only two results derived from it, which are emissions with clear skies and emissions with average skies (meaning average cloudiness). Since GHGs and clouds are overlapped in the way they impair emissions, there is no way to determine LWCF from it.
Clear skies (including the effect of GHGs only)
Average skies (including the effect of GHGs AND clouds)
We are obviously missing a measurement of the effect of “clouds only”. In other words, we need more information to determine the size of the overlapped, redundand component here, where GHGs and clouds reduce emissions together. The redundant “space” right now is only allocated to GHGs, which is wrong. It underestimates the GHE of clouds, and overestimates that of GHGs.
Anyhow, with accurate data on cloud opacity and altitude it should be possible assess it.
E., that’s what the CERES datasets entitled “CRE” are for … cloud radiative effect. Those are the measurements of “clouds only”.
w.
Only if they magically made GHGs disappear.. 😉
Great Post Wills!
It gave me an idea that should work for all. From Figure 1 & 2 it is clear Desert Areas are a large source of warming. Deserts need to be covered with Vegetation to add cloud cover. So build Nuclear Power Cogeneration Plants that use Seawater Cooling and produce fresh water through desalination near the deserts as the water source.
The plants could be run at full load if the extra power not required by a connected grid was use to run additional desalination units.
So we could get a cooling impact from the additional clouds, non CO2 produced Power with additional food and or lumber production.
The thing I like about this idea is that you can run the nukes at a steady rate, and shut off some desal pumps whenever you need it for the grid … allows nukes to be more dispatchable.
w.
Last time you did this in 2017, the average was 0.0 W/m2. Not it is negative with a rather high value.How come and what does this high negative value mean for climate sentivity?
https://wattsupwiththat.com/2018/01/18/ceres-edition-4-and-the-cloud-radiative-effect/
And wouldn’t this cloud feedback together with the assumed IPCC forcing values for GHG etc, lead to cooling?
So, either the cloud feedback may be negative but somewhere between the 2017 and 2020 results,
or GHG + etc forcings are higher than thought?
This one uses raw data that includes the seasonal variations. The previous one had seasonal variations removed.
So this one is focused on short-term variations, and the previous one looked at long-term variations.
It showed that in the long run, clouds cooled the tropics, warmed the poles, cooled the oceans, and warmed the lands.
Regards,
w.
Thank you.
So the last one is the one to be compared with climate model input, and how did it change with 3 years more data?
I recall Richard Lindzen having a similar theory, that clouds had an ‘iris effect’ on cooling the planet. And of course, was attacked for even suggesting something beyond the consensus. Good luck Willis, in your attempts . . .