Reposted from Dr Judith Curry’s Climate Etc.
Posted on March 6, 2021 by curryja |
by Judith Curry
Conclusion from Michael Mann’s new paper: “We conclude that there is no compelling evidence for internal multidecadal oscillations in the climate system.”
Michael Mann’s most recent paper:
Multidecadal climate oscilliations during the past millennium driven by volcanic forcing
Abstract. Past research argues for an internal multidecadal (40- to 60-year) oscillation distinct from climate noise. Recent studies have claimed that this so-termed Atlantic Multidecadal Oscillation is instead a manifestation of competing time-varying effects of anthropogenic greenhouse gases and sulfate aerosols. That conclusion is bolstered by the absence of robust multidecadal climate oscillations in control simulations of current-generation models. Paleoclimate data, however, do demonstrate multidecadal oscillatory behavior during the preindustrial era. By comparing control and forced “Last Millennium” simulations, we show that these apparent multidecadal oscillations are an artifact of pulses of volcanic activity during the preindustrial era that project markedly onto the multidecadal (50- to 70-year) frequency band. We conclude that there is no compelling evidence for internal multidecadal oscillations in the climate system.
From the Penn State press release Apparent Atlantic Warming Cycle an Artifact of Climate Forcing:
<begin quote>
“It is somewhat ironic, I suppose,” said Michael E. Mann, distinguished professor of atmospheric science and director, Earth System Science Center, Penn State. “Two decades ago, we brought the AMO into the conversation, arguing that there was a long-term natural, internal climate oscillation centered in the North Atlantic based on the limited observations and simulations that were available then, and coining the term ‘AMO.’ Many other scientists ran with the concept, but now we’ve come full circle. My co-authors and I have shown that the AMO is very likely an artifact of climate change driven by human forcing in the modern era and natural forcing in pre-industrial times.”
The researchers previously showed that the apparent AMO cycle in the modern era was an artifact of industrialization-driven climate change, specifically the competition between warming over the past century from carbon pollution and an offsetting cooling factor, industrial sulphur pollution, that was strongest from the 1950s through the passage of the Clean Air Acts in the 1970s and 1980s. But they then asked, why do we still see it in pre-industrial records?
Their conclusion, reported today (Mar. 5) in Science, is that the early signal was caused by large volcanic eruptions in past centuries that caused initial cooling and a slow recovery, with an average spacing of just over half a century. The result resembles an irregular, roughly 60-year AMO-like oscillation.
“Some hurricane scientists have claimed that the increase in Atlantic hurricanes in recent decades is due to the uptick of an internal AMO cycle,” said Mann. “Our latest study appears to be the final nail in the coffin of that theory. What has in the past been attributed to an internal AMO oscillation is instead the result of external drivers, including human forcing during the industrial era and natural volcanic forcing during the pre-industrial era.”
<end quote>
Mann has a blog post on the paper at RealClimate
Wow. In one fell swoop, the pesky problems of the ‘grand hiatus’ in the mid 20th century, debates over the attribution of 20th century warming and the role of multidecadal internal variability, and the difficulty of attributing the recent increase in Atlantic hurricane activity to AGW, all go away. Brilliant! Almost as ‘brilliant’ as the Hockey Stick.
As it happens, I have a draft chapter in my pocket from a report I’m writing, I’ve excerpted the relevant text below (apologies for not having links to the references):
9.Atlantic Multidecadal Variability
The Atlantic Ocean is particularly important to the global ocean circulation due to the existence of North Atlantic Deep Water (NADW) formation in the northern North Atlantic, a vital component of the Atlantic Meridional Overturning Circulation (AMOC). The AMOC includes the northward flow of warm salty water in the upper Atlantic and the southward flow of the transformed cold fresh NADW in the deep Atlantic, which is a major driver of the substantial northward Atlantic heat transport across the equator.
Basin‐scale multidecadal fluctuations have been observed in the Atlantic sea surface temperature (SST). The large‐scale multidecadal variability observed in the Atlantic has been referred to as the Atlantic Multidecadal Oscillation (AMO). The multidecadal character of the AMO is distinguished from interannual ocean variability forced by the leading mode of atmospheric circulation variability over the North Atlantic, the North Atlantic Oscillation (NAO). The term Atlantic Multidecadal Variability (AMV) is often used, because the observed multidecadal fluctuations in the Atlantic may not be an oscillation at a single frequency but consist of a broader band of low‐frequency signals.
9.1 Index definition and climatology
The Atlantic Multidecadal Oscillation (AMO) is associated with basin-wide SST and sea level pressure (SLP) fluctuations. For the positive AMO phase, this is sometimes presented as an almost uniform warming of the North Atlantic. The traditional AMO index associates the positive AMO phase with a pattern of horseshoe-shaped SST anomalies in the North Atlantic with pronounced warming in the tropical and parts of the eastern subtropical North Atlantic, an anomalously cool area off the U.S. East Coast, and warm anomalies surrounding the southern tip of Greenland.

Figure 9.1. Atlantic Multidecadal Oscillation Index (1880-2018).
The past 100 to 150 years of Atlantic SSTs are characterized by a net century-long rise and periods of multidecadal warming and cooling. However, the rationale for the ‘Trend+AMO’ separation is confounded by lack of linearity in the global warming trend, and hence detrending aliases the AMO index. The nonlinearity is particularly pronounced during the period 1945-1975, when global SSTs showed a slight cooling trend.
To address the ambiguities associated with detrending in formulating the AMO index, Johnstone (2017) has formulated an Atlantic ‘Arc’ Index, based on the leading Principal Component of north Atlantic SST variability (60°N to 0°, 70°W-0°W). The Atlantic ‘Arc’ SST index reflects coherent variability within a basin-scale arc-shaped pattern (sometimes referred to as a ‘horseshoe’), a signature of the AMO that encompasses the tropical North Atlantic, the midlatitude eastern boundary and much of the subpolar north (Fig. 9.2).

Figure 9.2. The Arc pattern is delimited by the bold black line, which encompasses the tropical North Atlantic, the midlatitude eastern boundary and much of the subpolar north Atlantic. From Johnstone.
The Arc pattern is recognized as a spatial signature of the AMO, identified with coupled ocean-atmosphere variability, and is closely related to a ‘tripole’ pattern of SST response to the NAO. The Arc Index displays a net warming in addition to multidecadal period recognized as a cool phase of the AMO (Figure 9.3). Since the Arc Index combines both the AMO variability and the overall warming trend, it is more usefully interpreted as defining multidecadal regimes and shifts (see section 9.4).
The Arc Index (Figure 9.3) shows abrupt shifts to the warm phase in 1926 and 1995, consistent with the conventional AMO analysis in Figure 9.1. Johnstone’s analysis indicates a shift to the cold phase in 1971, which differs from the analysis shown in Figure 9.1 that indicates the shift to the cold phase in 1964. The AMO index of Klotzbach and Gray (2008) also indicates a shift to the cold phase in 1970.

Figure 9.3. Time series of the Atlantic Arc Index from 1880 through early 2018. From Johnstone.
9.2 Paleoclimate reconstructions
The brevity of available instrumental data limits our understanding of the Atlantic Multidecadal Variability (AMV). Paleoclimate proxy‐derived reconstructions of AMV‐related signals that extend beyond the instrumental era provide an important basis for understanding the nature and stationarity in time of the AMV.
The recent Wang et al. (2017) AMV reconstruction using terrestrial proxy records (tree rings, ice cores, etc.) over the past 1,200 years has both broad spatial coverage and high temporal (annual) resolution. Wang et al. (2017) found that large volcanic eruptions and solar irradiance minima induce cool phases of Atlantic multidecadal variability and collectively explain about 30% of the variance in the reconstruction on timescales greater than 30 years. They isolated the internally-generated component of Atlantic multidecadal variability, which they define as the AMO. They found that the AMO is the largest contributor to Atlantic multidecadal variability over the past 1,200 years.
Zhang et al. (2019) provides a summary of studies that have analyzed paleoclimate data to investigate whether AMV is internally or externally driven. Over the past 12 centuries, the reconstructed solar and volcanic forcing do correlate with the Wang et al. (2017) AMV reconstruction, but their combined contribution explains less than one third (28%) of the total AMV variance; the reconstructed AMV is dominated by internal variability. The internal variability component of the Wang et al. (2017) AMV reconstruction also reveals significant signals at multidecadal timescales above a red noise background and its amplitude during the preindustrial period, especially before the Little Ice Age, is on the same order as that found in the instrumental AMV index. Paleo proxies also supportthe existence of an AMOC‐AMV linkage over the past several centuries.
Knudsen et al (2010) used paleoclimatic data to show that distinct ~55-70 year oscillations characterized the North Atlantic ocean-atmosphere variability over the past 8,000 years (the Holocene). The Holocene AMO signal appears to have been quasi-periodic and the associated climate response to have been of highly variable intensity, both in time and space. In the tropical Atlantic, the AMO response signal was generally relatively weak during the Northern Hemisphere warming of the Holocene thermal maximum (HTM) between 5,500 and 9,000 BP, after which it picked up in intensity. Through the past 8,000 years, minor shifts appear to have occurred in the dominating period within the 55- to 70-year band. The dominant oscillation period in the interval of 5,500–8,000 BP was ~65 years, whereas it shortened somewhat between 5,500 BP (before present) and ~2,700 BP (55–60 years). The period of the dominant oscillations increased slightly again after ~2,700 BP (65–70 years), but the oscillations were generally not as well defined as during the early Holocene, when the AMO period bandwidth appears to have been narrower.
Knudsen et al (2010) provides the following additional insights. The AMO response signal exhibits a general shift in its pattern within the last 8,000 years, as the signal was most pronounced in the Arctic during the HTM, whereas in the tropics its maximum was generally reached after the HTM. Between 2,000 and 3,500 BP, there was a statistically significant recurrence of multidecadal oscillations in the Arctic. This interval overlaps with a part of the neo-glaciation between 2,000 and 3,000 BP, which was characterized by relatively high SST and generally warmer, and particularly unstable, climate conditions in parts of the northern North Atlantic region. Such conditions meant that the Arctic sites temporarily became more sensitive to multidecadal SST oscillations, possibly due to an associated reduction in Arctic sea-ice cover. However, the major changes in North Atlantic circulation patterns that followed the neo-glaciation in both hemispheres led to a generally weakened AMO response signal after ~2,000 BP. This change was accompanied by a distinct SST decline between 2,000 and 500 BP in some parts of the northern North Atlantic.
9.3 Climate dynamics
Despite ongoing debates about the climate dynamics of the AMV, it is generally accepted that the AMV represents a complex conflation of natural internal variability of the Atlantic Meridional Overturning Circulation (AMOC), natural red-noise stochastic forcing of the ocean by the atmosphere (primarily the NAO), and external forcing from volcanic events, aerosol particles and greenhouse gases.
9.3.1 AMO
The Atlantic Multidecadal Oscillation (AMO) is the most prominent mode of multi-decadal Atlantic variability; however the AMO’s physical origins remain a topic of ongoing debates. Observed AMO SST changes have long been attributed to slow variations in northward upper-ocean heat transport by the AMOC. Ocean processes offer a plausible mechanism for large multidecadal climate variations; such inferences are based largely on climate model simulations due to the short record of AMOC circulation that begins only recently in 2004.
Several additional hypotheses for AMV mechanisms have been proposed. Anthropogenic aerosols have been hypothesized to be a prime driver of the observed AMV. The argument is that an increase in the linearly detrended AMV SST index is forced by the increased downward shortwave radiative heat flux induced by the decreased anthropogenic aerosols through their interaction with clouds. However, the observed decline in the subpolar AMV SST signal over the most recent decade is inconsistent with the recently observed change (a slight decrease) in anthropogenic aerosols over the North Atlantic region. As summarized by Zhang et al. (2019), the hypothesis that changes in external radiative forcing is a prime driver of AMV disagrees with many observed key elements of AMV.
Using observations and models, Delworth et al. (2017) examined the relationship between the North Atlantic Oscillation (NAO) and Atlantic decadal SST variations. Consistent with many previous studies, on short time scales NAO-related surface heat flux anomalies drive a tripole pattern of SST anomalies in the Atlantic. On decadal and longer time scales, there is a lagged response of the ocean to the NAO fluxes, with the AMOC playing a prime role in modulating meridional oceanic heat transport and generating an AMO-like SST response. A prolonged positive phase of the NAO enhances the AMOC after a decadal-scale delay. Delworth et al. (2017) found that decadal-scale SST variability in the subpolar and tropical North Atlantic are well correlated. While ocean dynamics plays a crucial role for decadal-scale SST variability in the extratropical North Atlantic, the results of this study suggest that its direct influence in the tropical North Atlantic appears to be smaller, with local air–sea fluxes playing a larger role.
Lin et al. (2019) argues for two different sources for AMO variability, identifying 50–80 year and 10–30 year AMOs that are associated with different underlying dynamics. Associated with a positive AMO at 50–80 year period is enhanced westerlies north of 60N but weakened between 40-60N, which is dynamically consistent with an enhanced polar vortex and linked to variability in the Pacific. The atmospheric variability associated with the 10–30 year AMO is a zonally asymmetric pattern with blockings prevailing over high latitude North Atlantic and cyclonic anomaly over subtropical North Atlantic, which is independent from the variability over Pacific sector. While the 10–30 year AMO may be linked directly to the dynamics over the tropical Atlantic, the 50– 80 year AMO is heavily related to the cross-basin interaction between the North Atlantic and the Greenland-Iceland-Norwegian Seas. (Note: consistent with the stadium wave.)
Willis et al. (2019) identified a tripolar SST anomaly between the Gulf Stream, the subpolar gyre, and the Norwegian seas that varies on 8–20 yr time scales. Their results suggest that the AMO is confined to the subpolar North Atlantic, while the tropical Atlantic varies primarily on shorter (intradecadal) time scales. In another study, Muller, Curry et al. (2013) identified a strong narrow peak in the AMO with period of ~ 9 yrs.
Nigam et al. (2018) showed that the decadal component of the AMO is closely related to the Gulf Stream variability: the northward shift of the Gulf Stream (GS) path coincides with the cold AMO phase with cold SST anomalies in the subpolar gyre. The GS’s northward shift is preceded by the positive phase of the low-frequency NAO and followed by a positive AMO tendency by 1.25 and 2.5 years, respectively. The temporal phasing is such that the GS’s northward shift is nearly concurrent with the AMO’s cold decadal phase (cold, fresh subpolar gyre).
Kwon et al. (2019) found that the evolution of SST anomalies is very different in the warm versus the cold phase of the AMV. For the AMV warm phase, the warm SST anomalies in the western subpolar gyre are damped by the surface heat flux, and thus pose anomalous heating in the lower troposphere and reduce the overall meridional gradient of the atmospheric temperature. Consequently, the storm track activity weakens. As the blocking substantially influences the seasonal mean atmospheric circulation, the negative phase of NAO dominates at the same time.
RuprichRobert and Cassou (2014) found that the full life cycle of AMOC/AMV events relies on a complex time-evolving relationship with both North Atlantic Oscillation (NAO) and East Atlantic Pattern (EAP) (Figure 9.8). The AMOC rise leading to a warm phase of AMV is statistically preceded by wintertime NAO+ and EAP+ from lag -40/-20 yrs. Associated wind stress anomalies induce an acceleration of the subpolar gyre (SPG) and enhanced northward transport of warm and saline sub- tropical water. Concurrent positive salinity anomalies occur in the Greenland–Iceland–Norwegian Seas in link to local sea-ice decline; those are advected by the Eastern Greenland Current to the Labrador Sea participating to the progressive densification of the SPG and the intensification of ocean deep convection leading to AMOC strengthening. From lag -10 yrs prior to an AMOC maximum, the opposite relationship is found with the NAO for both summer and winter seasons. NAO- acts as a positive feedback for the full development of the AMV through surface fluxes but, at the same time, prepares its termination through negative retroaction on AMOC. Relationship between EAP- and AMOC is also present in summer from lags -30/+10 yrs, while winter EAP- is favored around the AMV peak.
All together, the combined effect of NAO and EAP are responsible for an irregular and damped mode of variability of AMOC/AMV that takes about 35–40 years to build up and about 15–20 years to dissipate. In addition to the direct NAO-/EAP- action, the termination of AMOC/AMV events is also induced by the advection of anomalous fresh water from the subtropical North Atlantic basin along the mean western boundary ocean circulation, and also from the Arctic due to considerable ice volume loss associated with overall atmospheric warmer conditions when AMOC is enhanced.

Figure 9.8 Schematic diagram for an AMOC/AMV positive event. RuprichRobert and Cassou (2014)
Update: An excellent new publication was pointed out to me on twitter that supports the general conclusions of my write-up https://journals.ametsoc.org/view/journals/clim/32/22/jcli-d-19-0177.1.xml#.YEO-7oO1x98.twitter
9.4 Recent shifts
As summarized by Robson et al. (2012), in the mid-1990s the subpolar gyre of the North Atlantic underwent a remarkable rapid warming, with sea surface temperatures increasing by around 1.8oC in just 2 years. This rapid warming followed a prolonged positive phase of the North Atlantic Oscillation (NAO), but also coincided with an unusually negative NAO index in the winter of 1995/96. By comparing ocean analyses and carefully designed model experiments, they showed that this rapid warming can be understood as a delayed response to the prolonged positive phase of the NAO and not simply an instantaneous response to the negative NAO index of 1995/96. Furthermore, they inferred that the warming was partly caused by a surge and subsequent decline in the meridional overturning circulation and northward heat transport of the Atlantic Ocean.
Robson et al. (2016) showed that since 2005, a large volume of the subpolar North Atlantic Ocean has cooled significantly, reversing the previous warming trend. By analyzing observations and a state-of-the-art climate model, they showed that this cooling is consistent with a reduction in the strength of the ocean circulation and heat transport, linked to record low densities in the deep Labrador Sea. The low density in the deep Labrador Sea is primarily due to deep ocean warming since 1995, but a long-term freshening also played a role. They inferred that the observed cooling of a large region of the upper North Atlantic Ocean since 2005 cannot be explained as a direct response to changes in atmospheric circulation over the same period.
Johnstone (2017) describes a ‘coupled shift model’ of low-frequency North Atlantic climate change, based on abrupt transitions between quasi-stable sea surface temperatures and coupled atmospheric circulations. This hypothesis describes recurrent step-like changes in North Atlantic SST, wherein high-amplitude SST perturbations are occasionally maintained as anomalous multidecadal climate states by positive atmosphere-ocean feedbacks. Statistical evidence is presented that low-frequency SST changes were not gradual processes as commonly described, but through a series of short, discrete events, characterized by abrupt ~1 year step-like shifts that separate longer multidecadal periods of relatively little change.
The strong Atlantic warming of the mid-1990s (Figure 9.1), which is represented by filtered AMO indices as a gradual process lasting a decade or more, can be traced to an abrupt and remarkably continuous rise in basin-scale SST, beginning in October-November 1994, and essentially accomplished as a +0.8°C SST change across most of the North Atlantic by July 1995 (Figure 9.3). The abrupt warming of 1994-95 went undamped in successive months, during the next few years, and fully through the subsequent two decades up to the present, rapidly introducing a new warmer climate state. The basin-scale expanse of the 1995 shift can be seen in the abrupt shift in monthly SST anomalies over both the subpolar North Atlantic (50-60oN) and the subtropical margins of NW Africa, which warming together in nearly simultaneous fashion (Arc Index, Figure 9.2).
Shifts appear in the annual Arc SST record (Fig. 9.3) as pronounced year-to-year jumps in 1925-26 (+0.5°C), 1970-71 (-0.3°), and 1994-95 (+0.6°) that were followed by multidecadal persistence of similar anomalies with respect to prior years (1926-1970: +0.5°C, 1971-1994: -0.2°C, and 1995-2014: +0.5°). Each of these intervals lacks a significant linear Arc SST trend, suggesting that large transient climate changes were followed by restabilization of the upper-ocean heat balance and persistence of new anomalous conditions over years to multiple decades. Arc SST changes 1926, 1971 and 1995 occurred with moderate same-signed anomalies of winter (October-March) Niño 3.4 SST, suggesting a systematic role for ENSO in the generation of low-frequency North Atlantic climate changes.
A more specific regional indicator appears in the correspondence of Arc SST shifts with high-amplitude SST changes off northwest Africa, which peaked September 1925, August 1970 and November 1994. West African SSTs are a prominent component of the Atlantic Multidecadal Mode (AMM), which may serve as a bridge across time scales, sustaining SST perturbations as sustained climate anomalies.
A physical implication of the shift model is that low-frequency climate changes occur through occasional pulses of upper-ocean heat uptake and release, rather than gradual or cumulative processes.
Atmosphere-ocean conditions leading to 1994-95 warming share notable similarities with the warming of 1925-26 and (oppositely) with the cooling of 1970-1971, suggesting predictability of major North Atlantic climate shifts. All three events were preceded during the prior 2-3 years by uniquely strong sea level pressure (SLP) anomalies of opposite sign around the Norwegian Sea within a broader NAO-like pattern. In each case, the transitional winter featured moderate ENSO conditions favorable to the developing temperature change, and each shift was distinguished by extreme local SST changes off NW Africa.
Historically, Atlantic shifts have been marked by extreme short-term SST changes off NW Africa: behavior that is not currently evident, as subtropical and tropical areas of the Arc remain in a warm state begun in 1995. However, it is notable that subpolar SSTs from 50-60N show evidence of abrupt cooling since 2015 (Fig. 9.10), behavior suggestive of a ‘partial’ shift that might soon involve the broader North Atlantic, including the tropics. The current divergence between subpolar and tropical North Atlantic SST is potentially analogous to behavior seen during the late 1960s-early-1970s, when rapid subpolar cooling in 1969-70 slightly preceded the sharp 1971 drop in tropical SST. Based on historical patterns, an abrupt shift to cooler conditions may be imminent, although the unusually long regime from 1926 to 1970 suggests that a substantial delay of up to 10-20 years may also be plausible.

Figure 9.10. Annual SST anomalies for the subpolar and tropical North Atlantic. Subpolar SST (blue, 60°-50°N) displays a sharp drop and persistently cool conditions since 2015 (20°N- 0°, red). Similar divergence around 1970 might provide an early indication of tropical and broader North Atlantic cooling within the next few years.
To what extent was the 1995 shift in the AMO predictable by climate models? Msadek et al. (2014) summarize the decadal prediction experiments conducted using the GFDL Climate Model. Initializing the model produces high skill in retrospectively predicting the mid-1990s warming, which is not captured by the uninitialized forecasts. All hindcasts initialized in the early 1990s show a warming of the SPG (subpolar gyre); however, only the ensemble-mean hindcasts initialized in 1995 and 1996 are able to reproduce the observed abrupt warming and the associated decrease and contraction of the SPG. The enhanced Atlantic decadal prediction skill is achieved primarily by initializing AMOC anomalies, instead of predicting AMOC anomalies at northern high latitudes.
In contemplating a possible future shift to the cold phase of the AMO, it is instructive to consider the prior shift to the cold phase that occurred in the 1960’s and early 1970’s, when the sea surface temperatures in the North Atlantic Ocean cooled rapidly. Hodson et al. (2014) demonstrated that the cooling proceeded in several distinct stages:
- 1964–68: The initial cooling is largely confined to the Nordic Seas and the Gulf Stream Extension. There are no notable atmospheric circulation anomalies during this period, aside from a small low MSLP anomaly over the Arctic in October–June.
- 1968–72: As the cooling progresses, cool anomalies extend to cover much of the subpolar gyre (SPG) and northern midlatitudes. There is a hint of low SLP anomalies over North Africa, but the most prominent evidence of circulation anomalies is an anti-cyclonic anomaly in July–September, which extends over northern Europe and into Asia.
- 1972–76: The cool anomalies reach their maximum magnitude and spatial extent during this period. The western part of the subtropical North Atlantic does not show a significant cooling, resulting in a tripole (or horseshoe) pattern. The pattern of SLP anomalies projects on the positive phase of the NAO.
9.5 Climate model simulations
Many coupled climate models simulate Atlantic Decadal Variability that is consistent in some respects with the available observations. However, the mechanisms differ strongly from model to model, and the inadequate observational database does not allow a distinction between ‘realistic’ and ‘unrealistic’ simulations (Latif and Keenlyside, 2011). Ruiz-Barradas et al. (2013) examined historical simulations of the AMO in CMIP3 and CMIP5 models. Variability of the AMO in the 10–20/70–80 year ranges is overestimated/ underestimated in the models.
Cheng et al. (2013; 2015) examined the Atlantic Meridional Overturning Circulation (AMOC) simulated by 10 models from CMIP5 for the historical and future climate. The multimodel ensemble mean AMOC exhibits multidecadal variability with a 60-yr period; all individual models project consistently onto this multidecadal mode.
As summarized by the NCA (2017), the simulated AMOC-AMV linkage varies considerably among the coupled global climate models, likely resulting from the spread of mean state model biases in the North Atlantic. The AMOC-AMV linkage depends on the amplitudes of low-frequency AMOC variability, which is much weaker in climate models than in the real world owing to the underestimated low-frequency AMOC variability that amplifies the relative role of external radiative forcing or stochastic atmospheric forcing in AMV.
The timing of a shift to the AMO cold phase is not predictable; it depends to some extent on unpredictable weather variability. However, analysis of historical and paleoclimatic records suggest that a transition to the cold phase is expected prior to 2050. Enfield and Cid-Serrano (2006) used paleoclimate reconstructions of the AMO to develop a probabilistic projection of the next AMO shift. Enfield and Cid-Serrano’s analysis indicates that a shift to the cold phase should occur within the next 13 years, with a 50% probability of the shift occurring in the next 6 years.
Evaluation of the Mann et al. paper
With that context, you can see why I am not accepting the aerosol explanation (pollution and/or volcanoes) for an explanation of what causes the AMO. There is substantial discussion and disagreement in the climate dynamics community on this topic, which isn’t surprising given the apparent complex interactions between ocean circulations and the AMOC, weather and interannual climate variability, and external forcing from the sun and volcanoes.
So, what exactly is wrong with Mann’s analysis? He relies on global climate models, which are inadequate in simulating the AMO. This was most recently emphasized by Kravtsov et al. (2018), who concluded that:
“While climate models exhibit various levels of decadal climate variability and some regional similarities to observations, none of the model simulations considered match the observed signal in terms of its magnitude, spatial patterns and their sequential time development. These results highlight a substantial degree of uncertainty in our interpretation of the observed climate change using current generation of climate models.”
Relying on global climate models, which don’t adequately simulate the multi-decadal internal variability, to ‘prove’ that such multi-decadal internal variability doesn’t exist, is circular reasoning (at best). How does this stuff get published in a journal like Science? Peer review is sooooo broken.
What Mann is seeing in the climate model simulations is the shorter period tropical expression of the AMO that is limited to the North Atlantic – not the multi-decadal variability that is linked to the global oscillation. This tropical expression may very well be forced to some extent by tropical volcanic eruptions, but says little about global multi-decadal variability that is of greatest interest.
The true multi-decadal climate variability is mostly internally generated, although solar variations can help set the tempo and major volcanic eruptions can mask the variations or help trigger a shift.
Why does this matter? The different phases of the AMO are linked to: Atlantic hurricane activity, mass balance of Greenland and weather patterns influencing North America and Europe (notably droughts); this is not to mention global temperature change.
From the Penn State press release, a primary motive for cancelling the AMO appears so that Mann can attribute the increase in Atlantic hurricane activity since 1995 to AGW. Cancelling the AMO isn’t going to help much here. As discussed in my recent post on the AIR insurance sector report, the number of major hurricanes (Cat 3+) in the Atlantic during the 1950’s and 1960’s (previous warm phase of the AMO) was at least as large as for the last two decades, when SSTs were significantly cooler.
A further key issue with the AMO is that all of the acceleration in sea level rise in recent decades is coming from Greenland melt, which is heavily influenced by the AMO.
Assuming that nature continues to behave as it has for the past 8 millennia, at some point (possibly in the next decade), we will see a shift to the cold phase of the AMO, with a slow down in Atlantic hurricane activity and Greenland mass loss.
In closing, Mann’s quest to cancel the Medieval Warm Period and now the AMO, in the interests of showing that recent warming is 100% anthropogenic, is not at all convincing to scientists who understand anything about climate dynamics and global climate models.
Of note –
M Mann filed a “motion for partial summary judgement …” in the CEI/Simberg/NR/Steyn lawsuits on January 21, 2021.
In Mann’s statement of facts, there are 2-3 lies/mistatements/outright fabrications on each page (to be expected from Mann).
One of the most astonishing claims is that Dr Curry’s testimony (deposition?) should be excluded under the Daubert standard. See page 12 of motion.
Apparently, Mann has filed multiple motions to exclude testimony and / or depositions of most every defense witness.
Mann is gonadally unable to mann up and face the facts (“You can’t handle the truth!), so of course the testimony and depositions that would pull the curtains back on his fraud must be excluded.
Cancel Culture is a powerful thing at Penn. It now extends to natural phenomena. Can Mann cancel COVID next?
minor point, I believe MannBoy is at Penn State U in State College, PA.
Penn, or UPenn, is in Philadelphia, PA.
Sadly, UPenn has a healthy cancel culture of its own.
M.Mann is missing a wheel, what a moron !
The computer model that we designed to get rid of multi-dacadal oscillations, showed that they didn’t exist, and presto…they don’t exist…well if you ignore all other evidence.
Besides, computer models are much more realistic and truthful than measurements, data, and observations. (sarc)
Mann has, once again, beclowned himself. His model doesn’t reproduce the AMO, so the dishonest fool concludes that it doesn’t exist rather than conclude, based on actual evidence for the AMO, that his model is faulty.
It goes a little further than that. He’s buying justification to manipulate aerosols as needed to have the models match climate.
I think that should be ‘multiDucktail oscillations’
I got as far as:
“That conclusion is bolstered by the absence of robust multidecadal climate oscillations in control simulations of current-generation models.”
The individual who composed that sentence is not “of this world”.
Environment Canada Climate Change are of the opinion that computer models are more realistic and destroyed 100 years (1865-1965) of temperature data in support of that belief.
Unlike NASA and NOAA, ECCC was too lazy to alter the data.
Thank you Catharine McKenna./s
Just another addition to the “When climate models are used to cancel observations” chapter in the very sad history of the climate scam.
No-one is trying to cancel the observations. The paper is about what is causing the Atlantic Multidecadal Oscillations. Mann is claiming that the main cause over the past millennium is volcanic forcing. Curry appears to be arguing that the main cause is an internally generate oscillation (for which she gives no evidence since the only possible evidence would come from climate models that she doesn’t believe in).
Izaak Walton posted: “. . . since the only possible evidence would come from climate models . . .”
It must be wonderful to be omniscient.
climate models are not evidence
How dare you insult the sacred models.
“since the only possible evidence would come from climate models”
Really? And there’s no observational evidence that the oceans warm and cool and warm and cool over long periods, all by themselves? They need volcanoes or CO2 to make that magically happen over a 50 or 60 year cycle?
My bet is that if the AMO wasn’t turning cold we would never hear any of this baloney about CO2 dunnit, because when the AMO is warm, it is also CO2 dunnit. How that thin 1/2 inch layer way up in our atmosphere (according to John Kerry) does all that is simply miraculous..
”My bet is that if the AMO wasn’t turning cold we would never hear any of this baloney”
As surely as the sun rises in the morning!!
” Mann is claiming that the main cause over the past millennium is volcanic forcing.”
Which is the most obviously transparent and blatantly outrageous nonsense ever to spew forth from this weasel’s devious mind.
That there is no tide of outrage from even his fellow climate scientists, speaks volumes.
BTW, who ”peer reviewed” it?
Why is that blatantly outrageous nonsense? Even Dr. Curry herself appears to agree to some extent. She seems to agree with Zhang that “Over the past 12 centuries, the reconstructed solar and volcanic forcing do correlate with the Wang et al. (2017) AMV reconstruction, but their combined contribution explains less than one third (28%) of the total AMV variance;”
So the question appears to be whether solar and volcanic forcing contribute more than 28% to the AMV as Mann suggests or not.
Mann et al. explicitly says why they think Wang et al are wrong
namely:
“Both these studies, however, use a lagged correlation and regression analysis in an attempt to estimate and remove the forced signal, interpreting the residual series as an internal AMO oscillation. Attempts to remove estimates of forced variability from a time series containing both forced and unforced components, however, require a direct estimate of the forced component of response rather than simply the time series of the forcings alone, because a simple regression approach using raw forcing series cannot account for the temporal structure in the response to forcing (e.g., the decadal–time scale exponential recovery following impulsive volcanic forcing). ”
You are certainly entitled to disagree with Mann et al.’s analysis
but calling it “blatantly outrageous nonsense” is hardly useful. Can you explain what is wrong with the quoted paragraph above?
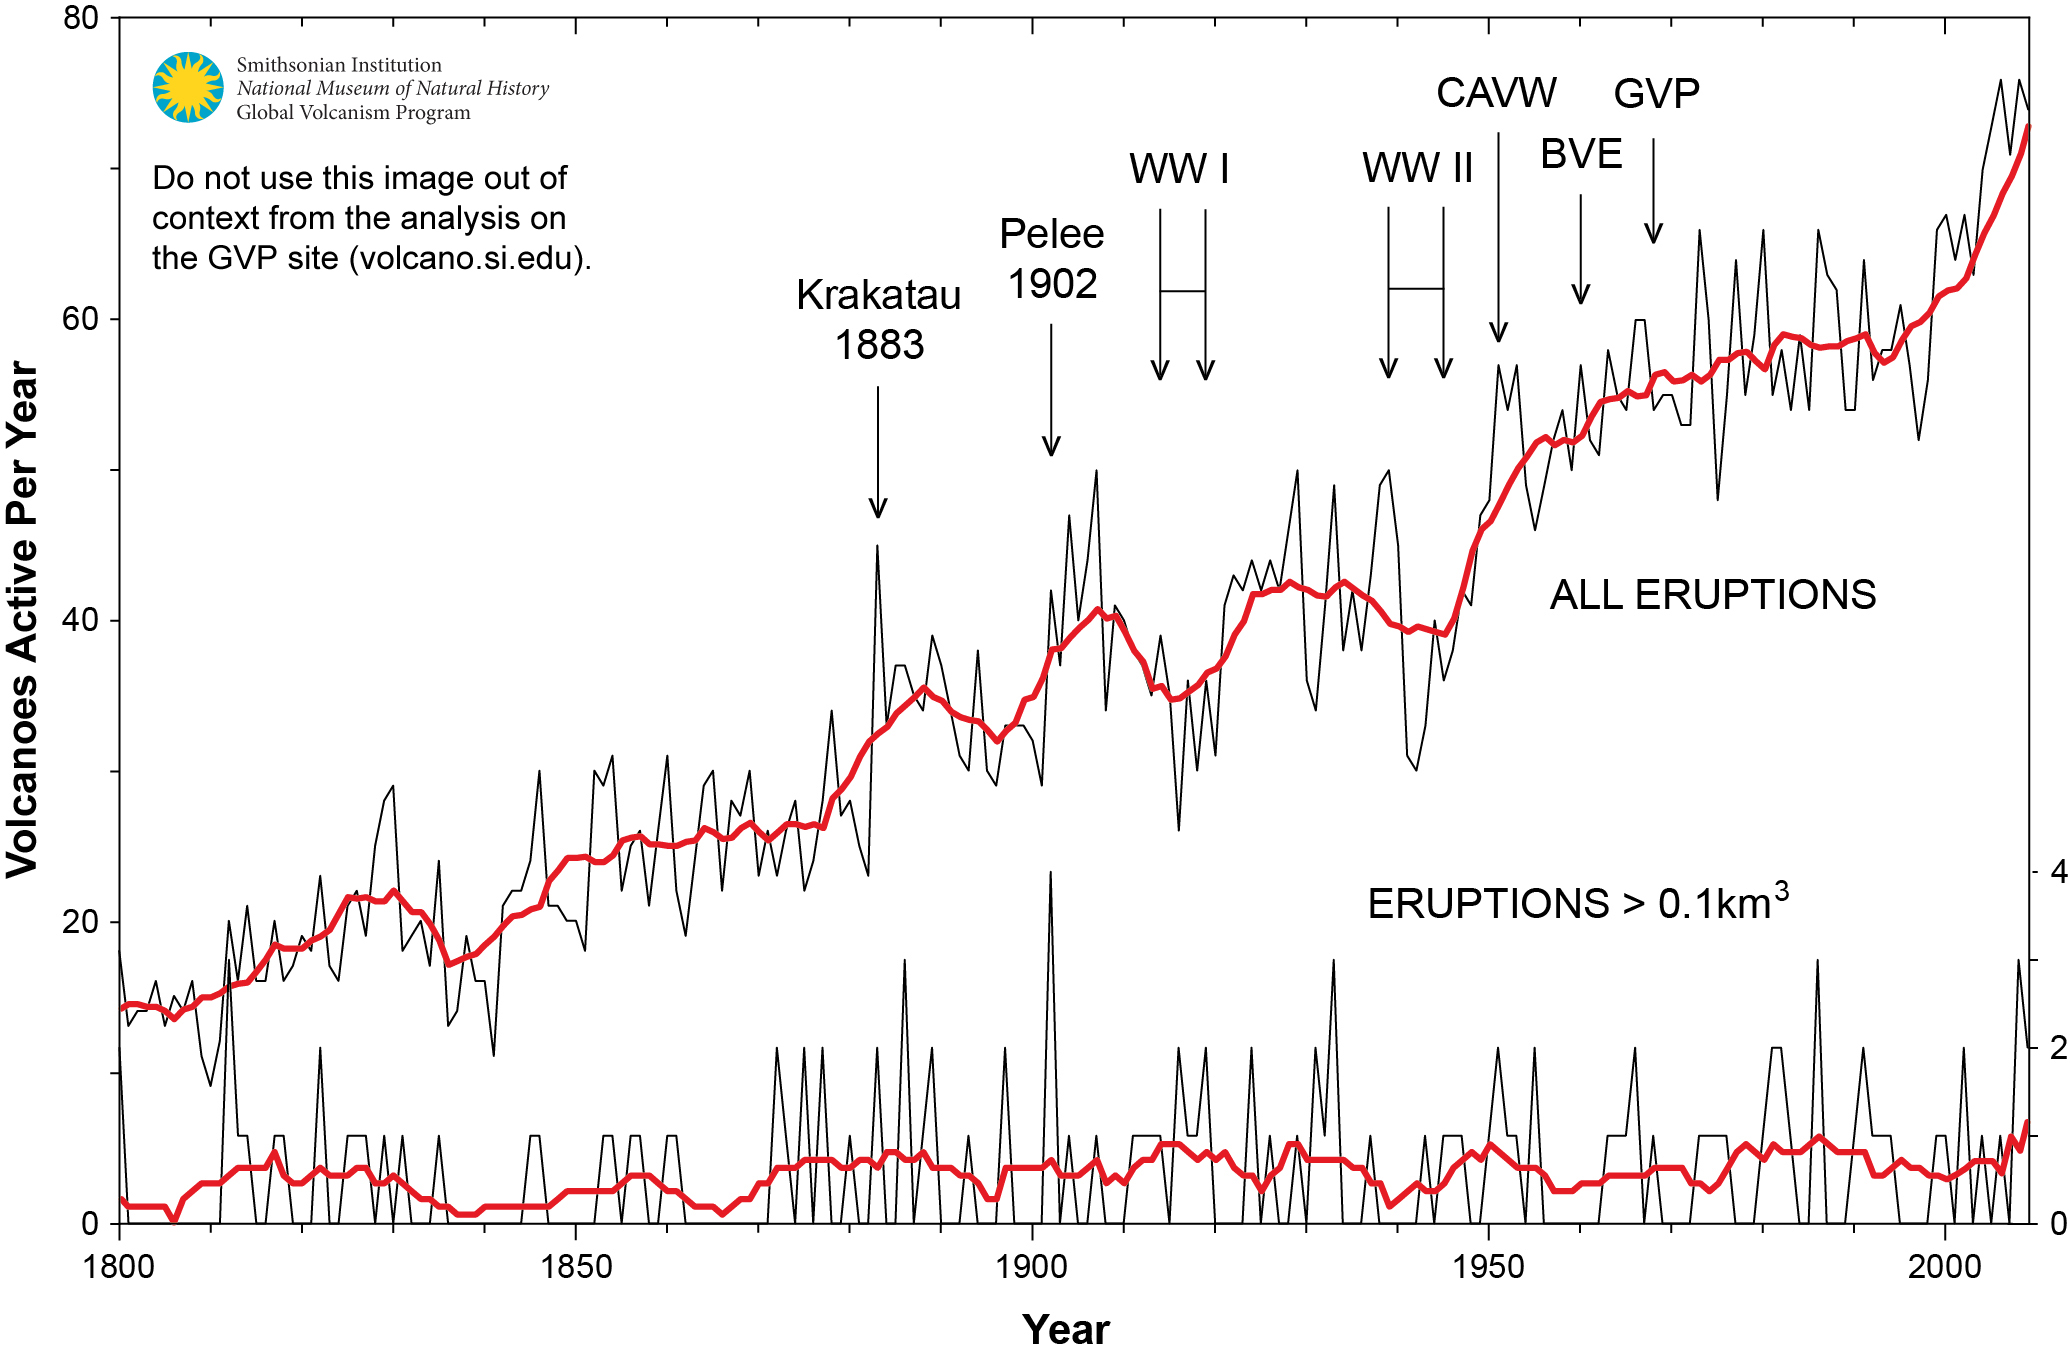
”Mann et al. now show that this variation is forced externally by episodes of high-amplitude explosive volcanism”
But…..
”Strong evidence that the historical trend in volcanism is more apparent than real comes from the lower plot of figure 1. Here only the larger eruptions generating at least 0.1 km 3 of tephra (VEI >= 4), the fragmental products of explosive eruptions, are plotted.”
Of course izzy-a-dope finds the TRUTH un-useful. !
It IS blatant nonsense.
Just mindless gish. !
“Can you explain what is wrong with the quoted paragraph above?”
I can try:
“…both forced and unforced components, however, require a direct estimate of the forced component…”
Can you explain the logical fallacy in that aprt of your quoted paragraph? Hint: “estimate”. You may help my poor intellect by starting your discussion of how to seperate forced and unforced phenomena in historical records. Or any other record, for that matter.
“So the question appears to be whether solar and volcanic forcing contribute more than 28% to the AMV as Mann suggests or not.”
Rookie mistake Izaak. The first question is whether the relationship is causal at all.
The only evidence that it isn’t internal oscillations are climate models that haven’t gotten anything else right so far.
‘Zak, I see your argument and raise you two volcanoes. Whether the volcanoes influence the weather, or whether the weather happens by itself, the weather follows whither the sea currents dictates. In the end, convection at global scale is empirically obvious, whether they cause the weather, or whether the weather causes them is moot, but you cannot divorce weather from volcanoes or any other geologic weather, such as quakes and especially quakes not happening when they “should”.
In the end, Mann seems to admit that “anthropogenic forcing” pales into insignificance next to natural phenomena. To blame volcanoes for the weather still does not make his pet theory magically become true, nor does it make his models any more useful. Especially seeing as his entire gospel rests on the foundation of climate models, models which have hitherto bluntly ignored geology, a facet often discussed amongst the heathens on this site.
What useful thing have we gotten from their models, except fear porn? What?
But, in the end, they are trying to rewrite their bible, the dirtly little revisionists, that’s blaspemy, that! We should hound the bastards out of the congregation, they have perverted the Faith! Before they come up with new heresies, like the sun influencing the atmosphere, or maybe they start saying things like the actual landscape makes any attempt at “averaging” a fool’s errand. Are they going to deny the dogma of averaging next? Then they’ll attack the holy gospel of adjustificationating, thereby eradicating from human memory the glorious achievements of Mannkind during the Adjustocene.
Stop this Mann, before he makes us all lose faith! He is the anti-Crisist!
“To blame volcanoes for the weather still does not make his pet theory magically become true, nor does it make his models any more useful.”
He is building support for high sensitivity found in the models. He wants CO2 to be the control knob for climate and needs to be able to manipulate aerosols to make that happen.
So, he is Chief Engineer to the Chief Evangelist Baal Gates, and their quest is to prepare earth for the return of their gods?
https://greenpets.co.za/index.php/en/paranoid-goy/213-planet-x
Once bitten twice shy.
There’s no limit in how ridiculous Mann can be… Once volcanoes now man. Brilliant.
Obvious question:
Are there any volcanoes that support hps hypothesis?
If there are no geological ash layers that indicate the sulphate emissions he needs then his latest hypothesis is debunked.
This could be even quicker to break than his hockeystick.
Mount Pinatubo erupted in 1991.
https://en.wikipedia.org/wiki/Mount_Pinatubo
“Pinatubo is most notorious for its VEI-6 eruption on June 15, 1991, the second-largest terrestrial eruption of the 20th century after the 1912 eruption of Novarupta in Alaska.”
“The effects of the 1991 eruption were felt worldwide. It ejected roughly 10 billiontonnes (1.1×10¹⁰short tons) or 10 km3 (2.4 cu mi) of magma, and 20 million tonnes (22 million short tons) of SO
2, bringing vast quantities of minerals and toxic metals to the surface environment. It injected more particulate into the stratosphere than any eruption since Krakatoa in 1883. Over the following months, the aerosols formed a global layer of sulfuric acid haze. Global temperatures dropped by about 0.5 °C (0.9 °F) in the years 1991–1993,”
end excerpts
So, one of the largest volcanic eruptions in the 20th century caused the temperatures to drop by 0.5C for about two years.
Michael Mann is going to need a lot of large volcanic eruptions to make his claims pan out that volcanic eruptions are the cause of temperature drops in the past.
Take for example the temperature drop of 2.0C that took place over the period from 1940 to 1980 (US). How many volcanic eruptions does Mann need to drop the temperature 2.0C over 40 years?
It looks to me like he would have to have four simultaneous Pinatubo-type eruptions in 1940, to get the temperture down 2.0C, and then he would need four simultaneous Pinatubo-type eruptions every two or three years after that for 40 years to keep the temperatures there.
This also applies to all those who claim human-derived SO2 is causing the cooling, the Human-caused Global Cooling crowd. Humans couldn’t produce a Pinatubo-type effect in the atmosphere if they tried. You see what is required. Humans are not putting out that much SO2, and they don’t put it high enough in the atmosphere.
The US surface temperature chart (Hansen 1999):
Exactly, Pinatubo did cool things off for a few years but then the AMO moved into its positive phase. If anything, Pinatubo delayed the onset of the +AMO. Seems like it’s just the opposite of what Mann et al propose.
I think we should note that the AMO is trending negative – before this next round of Icelandic volcanism kicks off. I’m afraid its one of those data points that might get cancelled.
Oh, just wait for it . . . Michael Mann’s next paper, prepared under the auspices of Pennsylvania State University, that shows how to date and size volcanoes using a select set of tree ring data. Potential Nobel-prize winner.
Another abject lesson in how to make inconvenient empirical data fit your paradigm.
Let me get this straight – he used already flawed computer models that do not model the phenomenon well to prove that the phenomenon does not exist?
Mann should change his name to “P.T. Barnum”.
“models that do not model the phenomenon
wellat all to prove that the phenomenon does not exist.”Yep, this is the stuff that passes as science today. So the Lysenko-ists can “follow it.”
we have a winner
Robert,
Mann et al. used two different sets of forcings in his model. In one run they used the forcings from the CMIP5 last millennium experiment and they observed the usual AMO signatures. They then did a control run with constant forcings and did not observe the AMO. There conclusion was then that the primary cause of the AMO is external forcing and not natural internal variability.
Izaak, you really mean to tell me “they” ran a control run on a computer model using constant forcings and did not observe any oscillations?
Stop the presses! Wow, who would have ever imagined that would be possible? What a breakthrough in computer modeling!
Yes. And despite what you might think nonlinear systems do often have periodic solutions in the absence of periodic forcings. Which would strike you as more surprising — a flag that flapped in a constant wind or one that didn’t move?
The climate models are as CLUELESS as you are about anything to do with climate, izzy-a-dope !
They know NOTHING about natural variability and cycles.
Of course the “control” simulations don’t show any cycles. !
Why are you so DELIBERATELY BLIND to this basic concept !?
Every comment you make shows just how incapable you are of rational thought.
Izaak, surely you must know that in the real world there is no such thing as a truly constant wind speed.
It is true than a non-linear system with feedbacks, given the smallest of variations in inputs, can amplify those perturbations into major oscillation amplitudes. Random perturbations in nature, even initially at the smallest imaginable initial levels, are part and parcel of chaos theory.
So, to directly answer the question you posed, both proposed end states would, hypothetically, surprise me equally with the understanding that the word “constant” truly means “having zero variation”.
Keep in mind that at sub-sonic conditions vortex shedding by the flagpole and the flag itself flapping in the breeze necessarily propagates pressure (and therefore wind velocity) perturbations upstream of the flag, thereby “automatically” overturning the stated boundary condition of constant (upstream-of-flag) wind.
If you want to discuss results from abstract, purely mathematical equations of non-linear system constructs, please seek out others.
Forcings are not data. They are calculations.
I can only chuckle that you cannot see the problem here. We know there has been warming, so if you run control runs that have no warming and the AMO is truly real, then those runs are telling you the model is wrong. This is why he is trying to get rid of the AMO. It is solid evidence that AGW is nonsense.
Instead, Mann and his cohorts must ASSUME the AMO does not exist or they must be wrong about everything. They are forced into a corner. Going to be very sweet when the AMO does turn and that could be within a few years.
Richard,
Again nobody is denying the existence of the AMO. The question is soley about its cause. Others have suggested that up to 30% of the AMO can be explained by external forcing so Mann et al.’s paper might be at the extreme end but it is not completely out of step with other people’s work.
WRONG AGAIN, izzy-clueless.
Mickey mouse is using INCOMPETENT ZERO-SKILL MODELS to show that other natural cycles don’t exist
Its is not even NON-SCIENCE,
it is just blatant balderdash.
Look at the data of NAO, calculate the running mean for a year or two, what you will find is a hint to the AMO
“They then did a control run with constant forcings and did not observe the AMO.”
Or any other climate change. By design.
Model magic
No reality needed
Judith asks the question, “How does this stuff get published in a journal like Science?”
The short answer is the Science magazine of “old”, i.e. the pre-Obama years, isn’t the same magazine since its editorial transformation during the first Obama-term in an effort to “up the marketing sell” of the climate change scam. That transformation was complete circa June 2013 when Marcia McNutt arrived on the editorial staff there under John Holdren’s quarterbacking efforts to push editorial staff changes there to suppress dissenting views in the peer-reviewed climate science literature.
Science magazine editorial staff, similar to Nature magazine, has been taken over by climate zealots who think it is okay push junk science (pal reviews, rejection of CAGW dissenting papers) in the name of climate action advocacy, a noble cause corruption at work.
It is why I refused to renew my AAAS membership and canceled the mag subscription. I would hope this happens en mass, so that AAAS and Sci mag can experience first-hand, “Go Woke, Go Broke.”
“and Sci mag can experience first-hand, “Go Woke, Go Broke.”
Just one small addition = sci fiction mag.
I object to your slur on the work of geniuses like Asimov, Huxley and Heinlein. SciFi writers (the proper ones, not the ones working for Hollywood) take their craft seriously, and do their best not to “get things wrong”. What is under discussion is the stuff published in magazines that get paid to pervert science as part of the Bolshevik attack on knowledge, to be replaced by belief and faith in “expert opinion”. Asimov published a number of corrections and apologies for the occasional mistaken predictions, he NEVER tried to rewrite the science texts to conform to his predictions, the way Mann is trying to do here.
Maybe if Mann read more SciFi as a child, and less “Boopa has Two Daddies now” he would have some common sense.
I’ve long considered leaving the AAAS, but kept hoping for a turn around. But this year their pushing diversity over scientific integrity was the last straw. I cancelled my membership.
However, this rot was longer in coming than the Obama Administration. I recall their pushing for Al Gore as the ‘science canidate’ in 2000. It’s just become more obvious in recent years.
The problems at AAAS began with Donald Kennedy. Bore fruit under McNutt.
The most recent issue os Scientific American has an article about why justice movements succeed. I read Sigma Xi’s “American Scientist” which usually has one good article plus Henry Petrosky’s column but is also heavily “woke”.
SA is a shell of its former self. I stopped subscribing years ago, and have not renewed my membership in Sigma Xi as they became politically driven science manipulators. What a travesty. What a lack of honesty and integrity. Yes, I miss Petrosky.
I’ve written this before, but I would like to chime in again regarding John Holdren.
During the Obama administration I had the opportunity to interview for a senior position under John Holdren at the White House Office of Science and Technology Policy. When I arrived for my interview, Holdren and one of his staff were at the whiteboard trying to calculate the spread of radiation from Fukushima, which had just happened. They were trying to calculate it with no real data. They thought they needed to do that in order to decide what should be done. Like the Japanese weren’t already calculating the spread infinitely better with real data. I mentioned several names of people to call in Japan. I got a job offer (actually to fill two open positions), but I turned it down. I couldn’t bring myself to work for such an idiot.
Also, it’s a sad state of affairs these days in public and corporate administration when senior appointments are made exclusively based on what people have between their legs or what color their skin is.
No, not what they have between their legs, but what they say they would have liked there. Same with skin, how many dignitaries have been outed the last year, pretending to be “blackish”? Even Kamala Harris denounces her Indian blood to pretend she’s a Negro.
Boom
Smack down Sunday
Can see him tearing up, lower lip quivering
So persecuted
The abstract of Mann’s new paper begins: “Past research argues for an internal multidecadal (40- to 60-year) oscillation distinct from climate noise. Recent studies have claimed that this so-termed Atlantic Multidecadal Oscillation is instead a manifestation of competing time-varying effects of anthropogenic greenhouse gases and sulfate aerosols. That conclusion is bolstered by the absence of robust multidecadal climate oscillations in control simulations of current-generation models.”
That’s as far as I needed to read before I started to laugh.
Regards,
Bob
PS: I learned a while ago, that it’s best to view climate science as comedy. It’s very entertaining if taken that way.
“the absence of robust multidecadal climate oscillations in control simulations” …
that is the absolute crap pseudoscience that is now passed off as science in a once reputable science journal. Not funny. Pretty sad IMO.
Control simulations
‘nuff said
I used to be proud of my papers in Science. Is there a known date when it became a libtard, bogus, fraudulent science mag and not a Journal? Plus or minus 1, 3 or 6 months. I don’t need to use my resumé any more, but just in case I need a footnote??
There is such a thing as laughing through the tears. It’s a Jewish strategy for withstanding repression. If the Democrats had their way, none of us would dare to breathe a skeptical word. So, we’re not repressed … yet.
Judith Curry’s article above is a wonderful example of Brandolini’s law wherein it takes ten times more effort to debunk BS than it took to create it.
Mann’s use of climate models in an attempt to prove anything is risible on the face of it. Judith went to considerable effort to show exactly why that is the case. She’s a saint.
Absolutely. Kudos and thanks to Dr. Curry. Brilliant.
Dark comedy…very dark..,….and very costly to mankind if they get away with it.
Indef, climate science is a joke
In so far Mann is involved, laughter is assured 😀
Mann was ahead of his time. He tried to cancel the Medieval Warm Period in 1999. Cancel culture didn’t start until after Trump became president.
But he is into it big time now. He tried to cancel Judiths Steyn deposition in his new years too late motion. Now he is trying to cancel the AMOC using bad models and circular reasoning. Once a buffoon, always a buffoon.
You would think any reputable magazine or organization would see his name on the paper and drop it in the round filing cabinet or the shredder without being read. I’m certainly not going to believe anything he says.
The ignorant buffoons at NPR and the other US networks will have him and other crackpots like Mark Jacobsen spewing their half-truths and contortions to their audiences and talking like the junk they publish is “science”. The same thing happens in the UK on BBC, and Autralia on ABC with their talking head crackpot fake scientists.
Reputable. Fewer and fewer of them exist.
Judith’s dismay at his junk claims being published in Science mag speaks to how badly AAAS and Science magazine have fallen over the last decade in their pursuit of climate change policy advocacy.
Also to be clear, the AMO and the AMOC are different things. One is an oscillation in SSTs and current positions versus the other being meridonal overturning circulation patterns.
Agree. I wrote two posts on Science’ Marcott mess for Judith back in 2013. The second (also appearing as essay ‘High Stick Foul’ in my ebook Blowing Smoke) conclusively proved that Marcott had committed academic misconduct in his Science paper. I sent a copy requesting retraction to McNutt, then editor in chief of Science. Told her I was publishing in a book if no reytraction.Her assistant acknowledged receipt. Never heard back—Science is a corrupted journal. So the essay made the book in 2014.
So I can invent antigravity by building a model that can’t detect it? I think I can solve the time travel problem too and now alchemy will be simple as pie. Who knew we could solve all the worlds problems by just building computer models that can’t reproduce reality. But if this is the case why don’t we save all those trillions of dollars to be invested in wrongly named “green, renewable, sustainable, virtuous” energy systems by just making models that don’t have CAGW built into their code? We can also abort the western economic suicide path we are all on and start building on our strengths using cheap reliable energy in the most environmentally responsible ways we have available.
Hollywood CGI animations regularly demonstrate faster-than-light travel and time travel all the time in their movies, so they must be a real thing. I saw the simulation.
If you want to convince those like me that understand a little about ocean currents, don’t do this. http://www.realclimate.org/index.php/archives/2021/03/the-rise-and-fall-of-the-atlantic-multidecadal-oscillation/
“A scientist has to admit when they are wrong. Unfortunately for all of us, my colleagues and I weren’t wrong about the unprecedented warming revealed by the now iconic “Hockey Stick” curve, despite the unrelenting attacks on it by climate change deniers over the past two decades. But I was wrong about the existence an internal AMO oscillation when I coined the term twenty years ago”
I was wrong, but really right in the big issue?
It’s all about him.
He only admits being wrong when it’s himself that’s proving him wrong. When it’s someone else, never wrong.
Mike Mann is a jackass. There is no other conclusion.
I applaud your restraint, Joel.
No winky. You could have said much worse and still remained inbounds.
I just LOVE how he calls his own Hockey Stick graph “iconic”. I can think of many adjectives to describe that fraudulent fabrication, but ‘iconic’ isn’t one of them.
It may well, to him and the followers of the cult of scientism be, literally iconic. As in it is an icon of their faith.
It is a religious symbol.
I disagree. Perhaps it is the most “iconic” of all icons describing totally mendacious science. Instantly pops into my head whenever I detect BS science.
He jut misspells chronic
I thought it was a misspelling of ironic.
Someone will get to the bottom of this, I’m sure. But iconic is certainly an error on someone’s part.
Climate change denier, is a ridiculous term dreamed up by those deluded people who think co2 is the driving force in climate change, I don’t believe co2 is driving climate change ,I’m not a climate changer denier , I do know climate has always changed whatever the co2 concentrate in the atmosher be it 4000 ppm or 180ppm .
The down votes are unfair, obviously given by people blind to the quote tags.
Yes mad micky admitting a small mea culpa to strengthen his hockey shtick nonsense, you are quite right
I followed your link.
“…If you assume that all trends are a simple linear ramp, and call everything left-over an “oscillation”,…”
Right there, we have a summary of this Mann’s intellect. How many natural (chaotic) systems exhibit “simple linear ramps”? Not even water warms up linearly in a kettle. Being wrong is one thing, flaunting your ignorance is another. We really should spend more time attacking the people who are promoting this sort of nonsense as science, Mann is just a lightning rod, catching the blinding flash that we seem unaware of being the cause of the deathly rumble that is to follow later. Mann is just a symptom, we have to eradicate the disease.
Cancel culture.
AMO was created by old white men.
Mann has come full circle, and Slate Magazine asks, “What exactly is a circle jerk?”
“Mann’s quest to cancel the Medieval Warm Period and now the AMO, in the interests of showing that recent warming is 100% anthropogenic, is not at all convincing to scientists who understand anything about climate dynamics and global climate models.”
A thoughtful person might read something into this statement about the intelligence and honesty of the “distinguished professor of atmospheric science” Mickey Mannish. Yes you might very well think that, but I couldn’t possibly comment.
Tectonic activity in the North Atlantic modulates the Atlantic Multidecadal Oscilation –AMO, as I have shown almost 9 years ago if not earlier but here is the first WUWT reference to it i could find.
https://wattsupwiththat.com/2012/11/19/cooling-in-the-near-future/ search NAP and substitute talktalk.net with co.uk) needs updating with recent available data.
No surprise that there is correlation of tectonic and solar activity (see other NAP link in the same above linked wuwt article.
What drives the AMO is ENSO.
Tisdale (ref. 1) describes the long term after-effects of ENSO. Eschenbach (ref. 2) provides the mechanism for these long term after-effects – advection.
ENSO goes through a multi-decadal cycle very similar to the AMO. If one plots a long term moving average of ENSO (say a 160 month moving average, or an EWMA of montly ENSO with λ=1/160) this multi-decadal cycle is readily apparent. This ENSO cycle has a highly significant correlation with the AMO.
If one further strips the short term variations from such a long term EWMA of ENSO, in effect separating removing the short term-effects of ENSO (convection) from the long-term effects (advection), then the correlation with AMO is significantly enhanced, with a level of significance <10-100.
Vuk says “No surprise that there is correlation of tectonic and solar activity”. Could it be that rather than tectonic activity being the cause of AMO, that the correlation between tectonic activity and the AMO is due to a common cause – solar activity?
References :
1 – Tisdale, Bob; Regression Analyses Do Not Capture The Multiyear After-effects of Significant El Nino Events, Climate Observations, July 27, 2009.
2.- Willis Eschenbach explains (wattsupwiththat.com/2019/06/14/a-second-look-at-radiation-versus-temperature)
Perhaps it causes both, but it was the sun alone, the correlation would be found in Pacific, Indian or Southern Ocean.
Why Atlantic only?
I suspect that because of the very active 5,000 miles of the mid Atlantic ridge. Perhaps correlation can be explained by effect on the ocean currents particularly in the down-welling areas in the Iceland’s vicinity
Solar input is important but the TSI variability as currently measured doesn’t provide for sufficient energy input variability.
However, there is a degree of correlation between solar activity and the N. Atlantic tectonics, but it does require a credible hypothesis.
Perhaps TSI is not an adequate measure of solar activity. The effect of solar activity is found in many places.
Ref: WUWT: ENSO predictions based on solar activity, posted byJavier, From Dr. Judith Curry’s Climate Etc. September 1, 2019
The models don’t show any internal oscillations, therefore they don’t exist.
Science is truly dead.
Think of it as an example of the use of Occam’s razor. External forcings can explain the AMO and therefore there is no need to postulate any internal oscillations.
Under Occams’s razor, would not the simplest system be the one that has it’s own internally-originated oscillations, thereby not involving the complexity of an unknown number of poorly characterized external forcings interacting with said system?
Gordon,
The external forcing are real and correspond to things like volcanic eruptions. In contrast there appears to be no evidence for internally generated oscillations.
Izaak,
In case you haven’t yet heard: absence of evidence is NOT evidence of absence.
Whether absence of evidence is proof or not proof depends on what the AGWers need this year.
“appears to be no evidence for internally generated oscillations.”
.
WRONG, its just that climate models and Mickey mouse are so incompetent they don’t recognise known cycles.
Their level of ignorance is on par with yours.
ENSO, heard about ? Sun, heard about ?
Using the same logic, you could also prove that the AMO causes volcanoes.
Not being facetious, but consider the mass of water needed to raise one body of ocean by one inch, consider the pressure on the mantel, and there must be a feedback mechanism between ocean convection and geostresses. AMO has to influence volcanoes, and volcanoes influence AMO, ENSO and every other O. The earth is not a closed system, but it comes close, and every single little thing affects every other single thing, sometimes bigly.
”External forcings can explain the AMO”
Yes and so can my cat’s vomit if examined closely.
I though the entrails are the true measure?
The problem with using models as proof, is the fact that every other prediction made by the models has failed miserably.
Models are not proof. Even the best real world models require validation before their output is accepted.
Only someone who doesn’t know the first thing about science would think you could prove anything using them.
Mark,
If you want to explain anything then you have to use a model since only in models can you show causality. In the real world all you have are observations and correlations. The claim being made is that external forcings alone can explain for the Atlantic multidecadal oscillation. What Mann et al. is saying is that if you take the underlying set of equations and subject them to known historical forcings then you get a good model of the AMO while if you take the same equations and use constant forcings then you get a bad model. Does that count as validation? Is it an explanation or is it proof?
WRONG as always
Its just that climate models and mickey mann are SO INCOMPETENT that without these forcing , they don’t recognise cycles
The climate models are basically just MEANINGLESS STRAIGHT LINES
Yeeees, now show us a climate model that actually predicts something real. You cannot build a model of a train to explain the workings of a ram pump, no matter how pretty your little plastic locomotive…
In other words, sir, consensus is, your models are worthless until further notice. Worthless,we all tell you, worthless! Maybe fix your models before you try using them to fix society? You can look at the excellent work Rotter & cie have done for ENSO, where they used real-world data to build a model, not using a model that needs constant alterations to conform to reality.
Was it Rotter, made that excellent .gif of the Nino/Nina water current cycles? One of them thar dudes run this site… sure got me hooked on my daily fix of Wattsup, whereas the hockey stick made me despair of mankind’s descent into stupidity and fraud parading as “consensual science”.
Apparently you don’t know what validation means
Validation means his paycheck didn’t bounce.
The delusion is strong in this one.
Only models can show casuality?
Really? Is that the lie you want to push today?
Models do not and cannot show casuality.
Izaak Walton posted: “If you want to explain anything then you have to use a model since only in models can you show causality.”
Well, two of earliest “breakthrough” discoveries of fundament scientific laws of causality were obtained solely from human observation of physical facts, not from model constructs:
1) Archimedes’ principle (aka, the physical law of buoyancy) — objects float because they displace an amount of water (or any other fluid in question) equal to their weight.
2) Newton Laws of Motion — (a) objects will stay at rest or stay in constant motion because no force is acting on them, (b) time rate of change of the momentum of a body is caused by and is equal in both magnitude and direction to the force imposed on it, and (c) when two bodies physically interact, they apply forces to one another that are equal in magnitude and opposite in direction because in the absence of external forces, total system momentum must be conserved.
There are many, many more such examples of discoveries involving causality made solely in the human mind, perhaps with assistance of pencil and paper, and with nothing resembling what we today would call “models” (computer or otherwise). Einstein’s explanation for the cause of Brownian motion immediately comes to mind as a more recent case.
Think of it as total balderdash !
Fantasy based on non-science.
Only the most nil-educated and GULLIBLE need “believe”
Circular reasoning is all Mann has to support his delusions. Is it hate speech to deprive him of his lifeblood?
A question I keep asking in various places but never get an answer to- is where can I see the details of any climate model? That is- the formulas, the data, and the computer code? I’m no climate scientist but I have a fair ability to look at formulas, data and computer code. I’d like to get a sense of what these models are all about. Instead of comparing models based on what they predict- it makes a lot of sense to see how the model works- even if it’s only an old fashioned flow diagram.
Increasing CO2 => increasing radiative forcing => increasing temperatures => increasing water vapor => creates tropospheric “hot spot” => amplifies (3X) CO2 forcing => we’re all gonna die!
Joseph,
Did you try searching on google. A quick search using “climate model source code” points me to
http://edgcm.columbia.edu/ModelII/
where you can download the actual source code for the GISS model II code.
NWS NCEP Climate Forecast System source code & associated info…
https://www.nco.ncep.noaa.gov/pmb/codes/nwprod/cfs.v2.2.11/
Knock yourself out.
Well he is the award winning and best in class of model manipulation to get a desired result.
I first encountered the hockey stick graph in an airline magazine in flight. We’ve been descending ever since.
He’s not a modeler, as far as I know. His best known trick is to come up with “novel” statistical methods, and then ignore the criticisms from statisticians.
Well, for sure there is that. But I would put in the “also-ran” category the fact the MM was able to secure and maintain a tenured position at Penn State in spite of what others have quipped should have been the state pen.
Even though it seems to me Mann’s cancellation of AMO is stupid on the face of it, if this paper is not retracted we will be reading in 6 months that Mann has “proven” that global warming/climate change is 100% human caused.
A lot of people WANT to agree with this, and just being obviously wrong is not going to stop them.
Even competing papers proving him wrong will be ignored.