Guest “we had to destroy village in order to save it” by David Middleton
Equivalent of Covid emissions drop needed every two years – study
Equivalent falls in emissions over a decade required to keep to safe limits of global heating, experts sayFiona Harvey, Environment correspondent
Wed 3 Mar 2021Carbon dioxide emissions must fall by the equivalent of a global lockdown roughly every two years for the next decade for the world to keep within safe limits of global heating, research has shown.
Lockdowns around the world led to an unprecedented fall in emissions of about 7% in 2020, or about 2.6bn tonnes of CO2, but reductions of between 1bn and 2bn tonnes are needed every year of the next decade to have a good chance of holding temperature rises to within 1.5C or 2C of pre-industrial levels, as required by the Paris agreement.
[…]
The Grauniad
The Grauniad article is referring to Le Quéré et al., 2021: “Fossil CO2 emissions in the post-COVID-19 era.”
Covid emissions? WTF? Fossil emissions? WTF’ingF? Fossils stopped emitting gases before they became fossils.
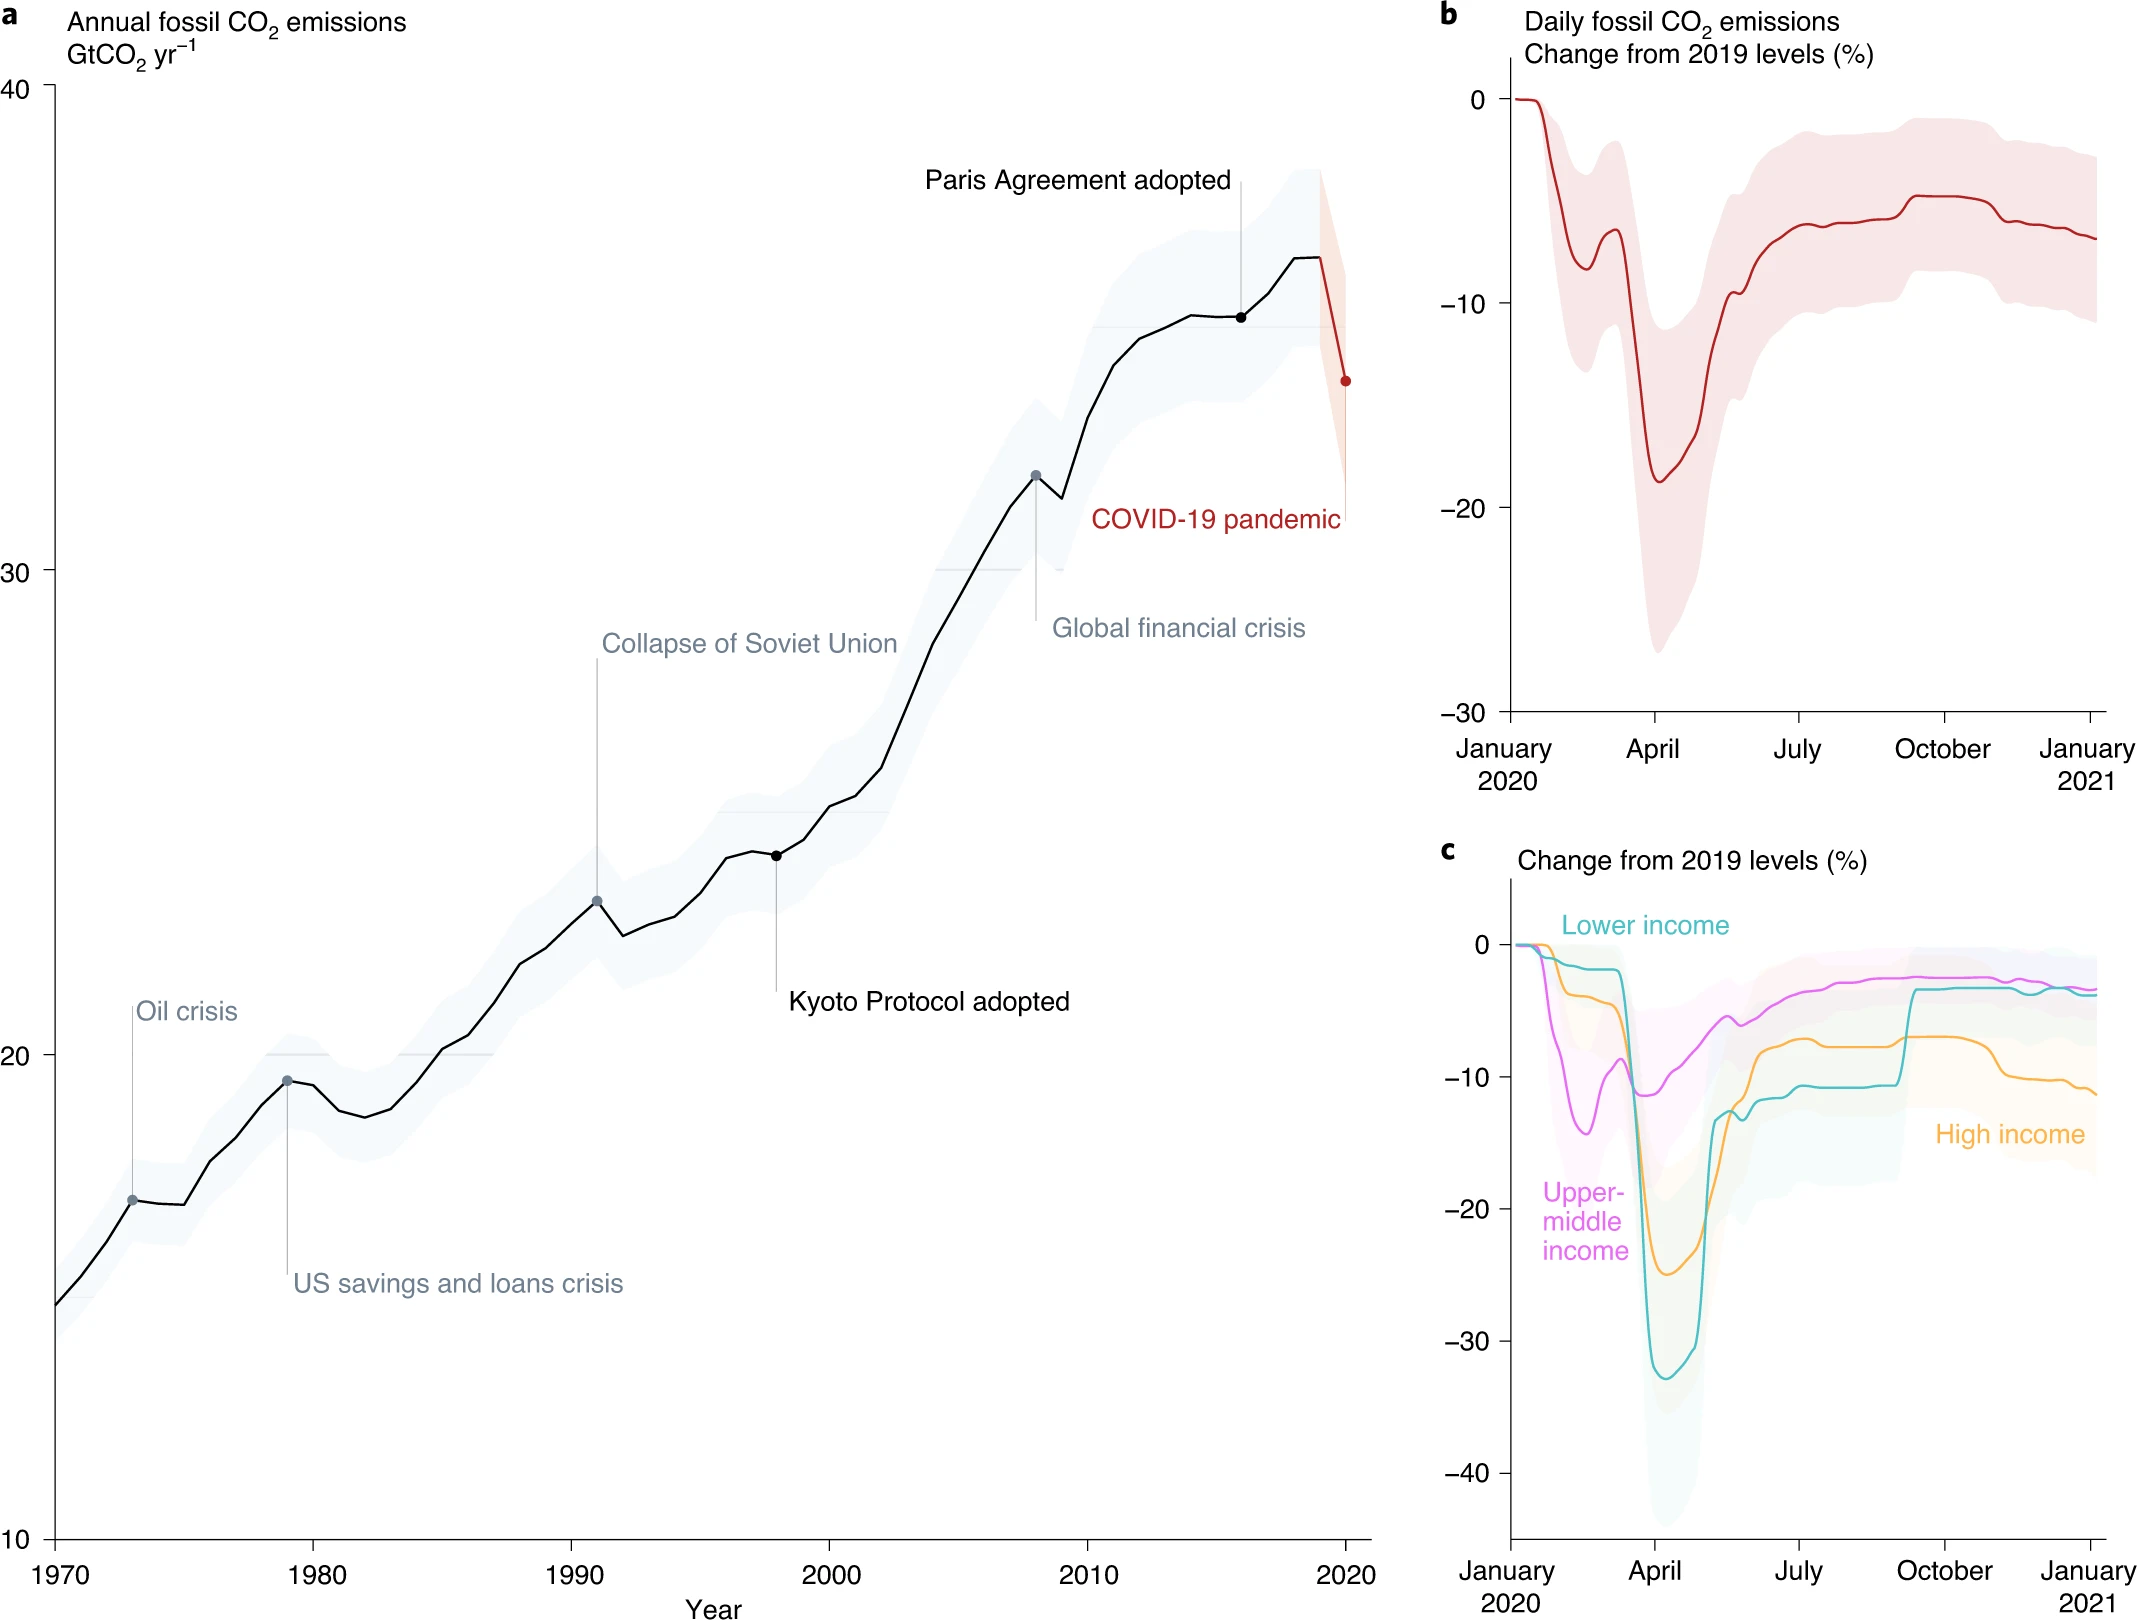
After just reading the first few paragraphs of The Grauniad dreck, I jumped to the Le Quéré and saw that it mostly prattled about rich countries not becoming Third World countries to save the planet… But, it did feature this nifty graph:
Source data“
The first thing I noticed was the effectiveness (/SARC) of Kyoto and Paris:
| Date | Notable events | Δ GtCO2 Emissions | From-To | |
| 12/11/1997 | 1997 | Kyoto Agreement Adopted | 0.2 | 1998-1999 |
| 2/16/2005 | 2005 | Kyoto Agreement Effective | 1.9 | 2006-2007 |
| 12/12/2015 | 2015 | Paris Agreement Adopted | 0.5 | 2016-2017 |
| 11/4/2016 | 2016 | Paris Agreement Effective | 1.2 | 2017-2018 |
| Average | 1.0 |
While, financial events seem to be the only way to reduce CO2 emissions:
| Date | Year | Notable events | Δ GtCO2 Emissions | From-To |
| 1/1/1973 | 1973 | Oil Crisis | -0.1 | 1974-1975 |
| 1/1/1979 | 1979 | US Savings and Loans Crisis | -0.6 | 1980-1981 |
| 1/1/1991 | 1991 | Collapse of the Soviet Union | -0.5 | 1992-1993 |
| 1/1/2008 | 2008 | Global Financial Crisis | 1.2 | 2009-2010 |
| 1/1/2020 | 2020 | COVID-19 Pandemic | -2.6 | Just 2020 |
| Average | -0.5 |
The Grauniad journalist wrote that we needed a COVID-style lockdown every other year to save the planet (my paraphrasing). However, Le Quéré et al appear to be calling for what would amount to a cascading COVID-style lockdown:
Although the measures to tackle the COVID-19 pandemic will reduce emissions by about 7% in 2020, they will not, on their own, cause lasting decreases in emissions because these temporary measures have little impact on the fossil fuel-based infrastructure that sustains the world economy2.
[…]
The task of sustaining decreases in global emissions of the order of billion tonnes of CO2 per year21, while supporting economic recovery and human development, and improved health, equity and well-being, lies in current and future actions.
Le Quéré et al., 2021
This is what “decreases in global emissions of the order of billion tonnes of CO2 per year” through 2050 would look like:

This would result in global CO2 emissions as low as The Great Depression. Figuring out how to immediately do this “while supporting economic recovery and human development, and improved health, equity and well-being,” would be a neat trick, considering that only economic distress has s successful track record in reducing emissions.
Had COVID attacked “the fossil fuel-based infrastructure that sustains the world economy” instead of people, this sort of reduction would have been achievable. But it would have only delivered “equity”… we’d all be equally dead in a few years.
What’s even more insane than the total reduction they are calling for?
Growing at a slower pace, world population is expected to reach 9.7 billion in 2050 and could peak at nearly 11 billion around 2100
17 June 2019, New YorkThe world’s population is expected to increase by 2 billion persons in the next 30 years, from 7.7 billion currently to 9.7 billion in 2050, according to a new United Nations report launched today.
[…]
UN Department of Economic and Social Affairs
If we insist on destroying the economy to save the planet, in 2050 the per capita emissions would only be about 1/3 of what they were in 1900. This would also deliver equity… Unless you’re a king.
Oh… I almost forgot…
Saving the Planet?
References
Boden, Tom, Gregg Marland, Bob Andres. Global CO2 Emissions from Fossil-Fuel Burning, Cement Manufacture, and Gas Flaring: 1751-2008. June 10, 2011. Carbon Dioxide Information Analysis Center, Oak Ridge National Laboratory. Oak Ridge, Tennessee 37831-6290
Le Quéré, C., Peters, G.P., Friedlingstein, P. et al. Fossil CO2 emissions in the post-COVID-19 era. Nat. Clim. Chang. 11, 197–199 (2021). https://doi.org/10.1038/s41558-021-01001-0
The reality is these New World Order scumbags actually want a pan-g e n o c i d e to reduce human population to less than 1 Billion by 2100.
Like some zombie-apocalypse where 95% of humanity is turned into living-dead, these idiots always somehow imagine they’ll be part of the survivors, never realizing the revolutions they inspire will consume them too.
… will consume them, and also their children.
May be tricky getting out to all those private islands with the torches and pitchforks….
It would also be difficult for them to get food to the islands.
Tommy Wils had it right I think
“….keep within safe limits of global heating, research has shown…..” Appeal to authority, logical error, the piece is worthless, at least didn’t formerly pass as term papers in science.
It is tiresome reading (did not actually finish it–) “scientific papers” [“must be addressed” in abstract ] that are essentially advocacy pieces. They are in many fields, variable in the amount of advocacy, maybe sometimes hide their own possible worth. What percentage of journal article length could be reduced by taking out the advocacy?
https://www.nature.com/articles/s41558-021-01001-0
Fossil CO2 emissions in the post-COVID-19 era, a title that seems out of place, first author apparently has similar paper in both 2017 and 2018 before 19.
Good catch and posting, David. When Fiona Harvey says “research has shown” she (?) really means modelling, carefully adjusted to show how greedy SUV owners are, “has shown”. First they chopped up an/or cooked our flying friends, now they want to stop this awful greening of the earth. What would make these people happy? Please don’t anyone answer that.
Extra! Extra! Read All About It!
When I see, what the one or the other woman publishes as scientific paper, I don’t wonder they have to discuss about genderisation, but the target shouldt be to have a look at the qualification of womans work.
Exactly, what do masculine and feminine attributes have to do with a man and woman, respectively, work. Diversity [dogma] is a progressive path and grade.
So we burned less fossil fuel but the CO2 content in the air still rose at the same rate ….. what’s that tell you?
Yes, while is is generally accepted that CO2 emissions declined up to 18% temporarily, there is no indication that there was a decline in even the rate of increase of atmospheric CO2 concentrations! Mauna Loa says it is business as usual.
“Although the measures to tackle the COVID-19 pandemic will reduce emissions by about 7% in 2020, “
Basically this is a modest decrease only on mans contribution of 4% to total atmospheric CO2, not the 96% contributed by Nature.
tonyb
Here are the official figures
Global Monitoring Laboratory – Carbon Cycle Greenhouse Gases (noaa.gov)
There is a link to an article explaining why we can’t see any changes in the upwards curve
tonyb
Thanks tonyb. Great link, but Clyde has already prejudged this. The facts mean nada to him…
global alarmists playing 3d chess while mother nature plays 4d chess… no wonder they usually get it wrong and need to rely on computer modeling GIGO to keep “relevant”
tony
Thank you for the link. It provides us with a common reference point.
While the average CO2 emissions-decrease for all of 2020 has been estimated variously at about 7% to 10%, during the period of initial COVID shutdown, it has been estimated to have been about 18%. This is an interesting time because from around August to May there is a strong increase in CO2 concentration every year, usually with a noticeable shoulder around March. While the greatest annual variance (+/- 1 sigma) is from about March to June, 2020 plots right in the middle of the average of the preceding decade. That is, if one did not know about the COVID emissions reduction, it could not be deduced from the 2020 Mauna Loa de-trended seasonal variation data. Pt. Barrow shows higher that usual levels for CO2 during the March to May time frame!
The increase of about 2.4 ppm for the period of February 2020 to February 2021 is just about the same as the long-term increase for the decade.
I think that the take away from this is that the clamor to reduce anthropogenic CO2 emissions, to slow the rate of growth, is not supported by the empirical data. There is no obvious change in the slope of the rate of change during the period of time the lock-down was most severe, and there was no obvious impact to the long-term growth. So, why would we expect that draconian reductions in CO2 emissions of a similar magnitude would have the hoped-for reductions, and justify destabilizing the world economy?
Could this be because the atmospheric level of CO2 is not driven by anthropogenic emissions? The first person to explain the d13C behaviour will get a free pint from me. I’ll give you a clue … the d13C of incremental atmospheric CO2 since 1750 has been -13 per mil. And it is still -13 per mil. I am genuinely interested in your models.
Fossil fuel emissions have cumulatively increased the total volume of CO2 being exchanged in the active carbon cycle. This can be measured or at least estimated in the atmosphere, oceans and biosphere.
If the CO2 from fossil fuel emissions was simply staying in the atmosphere, the δ13C would have dropped from around -6‰ around -13‰. The current δ13C is around -8.5‰. This just tells us that most of the CO2 emitted by fossil fuel combustion didn’t stay in the atmosphere. Plants preferentially take up 12C and the Earth has greened… So a lot of it became plant food. But without knowing the exact exchange rates and volumes between the atmosphere, oceans (surface and deep waters), biosphere and the soil, it’s not possible to perform an accurate material balance.
David
Furthermore, I don’t think that there is good data on the isotopic fractionation that takes place with evaporation and out-gassing. We have poor information on the amount of CO2 contributed in the deep oceans from volcanic vents. Lastly, much of the out-gassing that takes place represents upwelling of deep water that contains the isotopic signature of air and plankton from 1,000 years ago.
Clyde,
I completely agree about isotopic fractionation across the atmosphere-ocean boundary being poorly defined. If you look at the various attempts at isotopic mass balance in the literature you will see significant changes in the model assumptions over time, and even using values specified to a single significant figure. And yet they are still having trouble obtaining an isotopic mass balance, both in terms of long term trends as well as inter-annual variations.
This is why I raise the issue regarding atmospheric δ13C. David maintains that it is difficult to establish an accurate material balance model. I completely agree. The point that I am making is that the published material balance models are ignoring characteristics of the observations (that are independent of the models) in their model development. The two key characteristics are (i) the long term constancy of the net δ13C of the incremental atmospheric CO2 which can be determined directly from the observations without any material balance model and (ii) the inter-annual variations related to ENSO which show that their models fail to incorporate the fact (again observable from the data) that the δ13C of the incremental CO2 changes between El Niño and La Niña events.
Let me give you a very simple example. Using published Scripps values for the South Pole (seasonal cycle, which is quite minor, removed by Scripps):
Jan 1980 CO2 336 ppmv, δ13C -7.50 per mil
Jan 2019 CO2 406 ppmv, δ13C -8.44 per mil
Average net δ13C of the incremental CO2 between those dates is:
((406 * -8.44) – (336 * -7.50)) / (406 – 336) = -13.0 per mil
This value is determined without any consideration of sources and sinks. Any isotopic mass balance model must reflect this observed characteristic of the data.
No doubt. We know, with reasonable certainty, the rate of CO2 rise since 1959 and with a bit less certainty over the past 2,000 years.
We have a pretty good handle on the volume of anthropogenic emissions over the past 200 years.
We can measure how the isotopic composition is changing.
Most everything else is little better than a SWAG.
“If the CO2 from fossil fuel emissions was simply staying in the atmosphere, the δ13C would have dropped from around -6‰ around -13‰. The current δ13C is around -8.5‰. This just tells us that most of the CO2 emitted by fossil fuel combustion didn’t stay in the atmosphere.”
Bill Gates and Nick Stokes say CO2 stays in the atmosphere for hundreds of years once it is there.
I guess they are wrong. Maybe someone should tell them.
The total volume of CO2 in the active carbon cycle is what will remain elevated for an extended period of time. Whether that’s decades or centuries, is unknown.
Bill Gates doesn’t have a clue about the science. Nick Stokes is either confusing residence time and e-folding time… Or, more likely, oversimplifying e-folding time.
When performing a mass balance calculation on the active carbon cycle, you have to include all of the components:
It tells me that the termite population is still increasing.
It seems logical that because CO2 greening is increasing the volume of biomass, it would also follow that the termite population would increase correspondingly.
Joe is going to ban volcanos , with the. navy working on the 750+ under the oceans.
Redistributive change, planned population schemes, dysfunctional normalization, cargo cult (i.e .intuitive, inferential) science, secular indulgences, em-pathetic appeals, totalitarian impulses, for social progress are legacy choices.
Imagine if they REALLY got what they wanted, like you said, for developed countries to become 3rd world countries, how they would SCREAM in agony as their many comforts vanish before their eyes. They are frothing marxist hypocrites using fossil fuels every day.
If you look deeper and reflect what is on the way, we are half on the way to become 3rd world country. In energy question we are leading that way.
For leftists (like FIona) to write such blather is conspicuous moral preening. How sick that such people need to do that, it is depraved.
If she didn’t write that garbage, The Gruniad would replace her. Which is certainly how she qualified to replace whoever was in the named position before. The problem then isn’t necessarily Fiona, but those who hired her.
Check the graphs from the observatory on Mauna Loa. There hasn’t been a significant flattening of the rise in CO². What exactly has been accomplished with all these lockdowns?
content://com.android.chrome.FileProvider/images/screenshot/1614970679335746514191.png
It shouldn’t show up in the MLO data.
Since 2000, it’s been rising an average of 2.2 ppm per year. If we assume all rise is from fossil fuel emissions, a 1-year 7% decrease in emissions would only lower it to 2.0 ppm. That’s not going to be noticeable.
In January 2021, MLO recorded 415.25 ppm… Without the COVID lockdown it would have been 414.45 ppm.
The major driver of annual variations in CO2 growth is ENSO. Are you realy saying that w/o lockdown the rate of increase would have been lower?
I’m saying that without the lockdown, rate of CO2 increase would have indistinguishable from the rate with a lockdown.
Unfortunately, David;
Over the years, we’ve heard from many adamant alarmist commenters here that the entire CO₂ “Parts Per Million” rise is due to mankind’s CO₂ emissions.
Otherwise, Earth would be at a blissful blessed 280ppm… Which we know to be false, especially the blessed part.
When arguing poorly understood chemical reactions and carbon uptakes/deposits, it’s not a good idea to give the most arrogant climastrologists any ground. Let them prove every PPM they claim mankind caused.
I see that as confirmation that human CO2 emissions are trivial compared to the global scale of emissions, and thus any reductions in human emissions would be even more trivial.
Of course, what part humans play in atmosperic CO2 levels is an entirely different discussion from possible harm/benefits that result from rising atmospheric CO2 levels.
Over a one year period, they are trivial. I haven’t done the math, but I think we would have to cascade the emission cuts for about 20 years before it became noticeable in the MLO record… And even then, I think it would be barely noticeable.
30 to 70 years within the estimated CO2 turnover rates
David
The working assumption of the Paris Non-treaty is that if there is no cheating, and everyone lives up to their commitments, it will take about a 5% reduction annually (with China being excused) for the next decade, to prevent Armageddon.
https://scitechdaily.com/the-truth-behind-the-paris-agreement-climate-pledges-insufficient-to-address-climate-change/
Yet, with a forced temporary reduction, with no cheating (even China participating), of more than 3X that rate, there is no discernible impact during the annual CO2 ramp-up ‘season.’ For the full-year, with about 2X the reduction in the annual Paris goal, there is similarly no discernible impact. Indeed, the 2020 CO2 atmospheric behavior was average for at least the last decade.
So, once again, the science (actual observations) is being ignored and rationalized to achieve an arbitrary goal of a 2 deg C cap, by decreasing anthropogenic CO2 emissions annually, by an amount that is 1/2 of a recent world-wide experiment that showed no effect on rate of seasonal increase, or rate of linear growth for the full year. This strikes me as being little more than wishful thinking on the part of alarmists that imposing financial hardships will be rewarded by saving their souls through the penance.
Disney’s First Law: Wish and it will come true.
???
Which way what? Business as usual would mean a lower CO₂ PPM?
Might be a typo.
Definitely a typo… Or I subtracted where I should have added, or vice versa.
Thank you for confirming that my original observation was correct. And thank you to ATheoK for restating my point clearly.
Your observation is correct. Your conclusion is simply not derivable from that observation.
My concluson was that your original statement made no sense. Since you have now confirmed that I was correct, I am not sure what your point is.
My original statement made no sense because I had the numbers backwards.
Your observation that atmospheric δ13C would be lower if 130/410 ppm CO2 was directly from fossil fuel emissions, is correct. However, this observation doesn’t support the conclusion that the 130 ppm rise wasn’t mostly caused by fossil fuel emissions, because you’re not incorporating the oceans, the terrestrial biosphere and soil into your material balance calculation.
Thank you David. I think we may be making progress on our mutual understanding. We are on the same side after all. I have done a lot of analysis of the data, so your comment that I am correct about the decline in atmospheric δ13C is a step in the right direction (but please don’t patronize me). However, I think you are still missing my point. I am presenting data that is based solely on observations (not on any material balance model) and then checking that against the AGW models. I am able to show that their models are not consistent with observations. I think that might be important. Perhaps we can pursue this in more detail?
You’re basing it on one observation and ignoring all of the other observations.
Material (mass) balance is an equation.
https://en.m.wikipedia.org/wiki/Mass_balance
In order to perform a material balance calculation, you need to include all of the observations.
The published mass balance models attempt to take into account all sources, sinks, and fractionation effects. They ‘adjust’ the input assumptions to see if/how they can match the observations (atmospheric CO2 and δ13C measurements), which are the actual NET effect of the source/sink relationships that the model is attempting to mimic. The observations are the ultimate constraint on model validity. If the observations show that the incremental CO2 has had a NET δ13C of -13 per mil, on average, then the mass balance model must replicate that.

The Keeling plot is based entirely on mass balance principles (equations!).
The intercept of the Keeling plot is the longer term average NET δ13C of the incremental atmospheric CO2. The fact that it is a good linear trend demonstrates that it has been consistent over time (r-squared 0.99), which is a major constraint on any model. This observational fact becomes even more significant when you see that the Keeling plot of the Law Dome ice core data going back to 1750 shows an intercept of -13.1 per mil with r-squared of 0.99.
The short term fluctuations seen on the Keeling plot above reflect the effects of ENSO (and Pinatubo), and must also be honored by any mass balance model, i.e. they are another constraint.
This is just telling you that plants took up a lot of anthropogenic 12CO2.
Boy, I wish I’d known it was that simple (/s). At least you finally seem to accept that the mass balance model/hypothesis needs to match the observational data, which has been my point all along.
According to the latest mass balance model of Keeling et al (2017), in isotopic mass balance terms observed atmospheric change accounts for only 13% of the effect of anthropogenic emissions. Uptake by the terrestrial biosphere explains only another 14% of the imbalance. The bulk of the required isotopic ‘adjustment’ (69%) is achieved by assumptions about disequilibrium fluxes. The largest of these is the ocean-atmosphere exchange for which the fractionation terms are poorly defined, as Clyde Spencer has already noted.
You have to make assumptions for components that can’t be directly measured.
The atmospheric CO2 concentration and δ13C can be measured with reasonable accuracy over about the past 2000 years.
Henry’s Law, seawater measurements and fossil corals allows us to estimate the same for the surface waters of the oceans.
We know with reasonable accuracy the volume of CO2 and δ13C from fossil fuel emissions. The cumulative volume is about twice the magnitude of the ~130 ppm rise.
We can estimate how much of the 12CO2 has been taken up by the biosphere (global greening).
We don’t know how quickly CO2 cycles into the deep oceans.
We know that fossil fuel combustion is a source.
We know that the oceans have been a net sink (increasing DIC & TA).
We know that the terrestrial biosphere has been a net sink (global greening).
Ultimately, a material balance calculation has to get you from ~280 to ~410 ppm CO2 over the past 200 years or so. Where direct measurements can’t be made, models and assumptions have to be used. There’s no way to balance the equation without fossil fuel combustion being the largest source component for the ~130 ppm rise.
That said, I do think a case could be made for CO2 rising from 280-340 ppm without fossil fuel emissions.
David,
A nice list, much of which I can agree with but, despite them “knowing” so much and being able to make assumptions about the unknowns, Keeling et al (2017) stated that: “A further difficulty is that the global δ13C budget does not balance convincingly”. Indeed. That was a reference to the model of van der Velde et al (2013), where they found that “the year-to-year variability in the isotopic disequilibrium flux is much lower […] than required to match atmospheric observations […], under the common assumption of low variability in net ocean CO2 fluxes”. This issue remains unresolved in the literature as far as I can tell since Keeling et al (2017) did not address this particular characteristic of the observed data.
The best quote in Keeling et al (2017), however, is this one from the abstract (remember that this was published less than four years ago):
“Using updated records, we show that no plausible combination of sources and sinks of CO2 from fossil fuel, land, and oceans can explain the observed 13C-Suess effect unless an increase has occurred in the 13C/12C isotopic discrimination of land photosynthesis.”
Does that help to explain why I am skeptical of these models and what is “known” or assumed?
Your final sentence is interesting. I am sure that you are aware that the (AGW) models of atmospheric CO2 growth, such as that of Keeling et al (2017), are based on it being 100% due to anthropogenic sources (fossil fuels and land use changes). Do you think that natural sources continue to be involved in atmospheric growth (combined with fossil fuel emissions)?
Being skeptical is fine, particularly when 13C is being treated as diagnostic. Carbon isotope excursions are useful geochemical tools… But they aren’t really diagnostic of anything. They are decent indicators.
The muted 13C Suess response definitely shows that the rise from 280 to 410 ppm was more complicated than just fossil fuel emissions.
I think that the natural sources were dwarfed by fossil fuel emissions after the 1960’s.
I think that the natural sources were dwarfed by fossil fuel emissions after the 1960’s, in terms of the net source/sink imbalance.
We’ll have to agree to disagree over the diagnostic value of δ13C observations. But thank you for all your feedback. It was appreciated.
🍻
David
See my remarks above to TonyL.
If we could just get them all into one place…. something like a fort with a palisade of wooden posts with plenty of splinters and pointy-ended tops…. and no ladders, mind you…. and then just close the gates, take the keys and drop food and TP into that place about once a month….
Really, when people start rattling on about reducing human populations, when most of the planet doesn’t have anyone living on it (it’s all in cities, look at NASA’s “World At Night” map), then they should be the first to volunteer for it, don’t you think?
OT a bit but…in the news…Greenpeace activists vandalize air france jet. OMG!!
And they recorded their actions and tweeted all about it. Since the Twitter Terms of Service explicitly prohibit the postings of unlawful conduct, I expect Twitter will ban Greenpeace permanently from their platform.
https://abcnews.go.com/International/wireStory/greenpeace-paints-air-france-jet-green-daring-eco-76279140
The plane was is storage, 23 years old and the second oldest 777-200ER in their fleet. I hope they declare the plane a total loss and sue the pants off Greenpeace.
In my mind’s eye the cops arrive and refuse to arrest the greenpeace folk until the paint job is complete. I doubt very much if, left to themselves, they would have completed the job – more like just splash a bit o’ green on an easily accessible bit of plane, get a snap, and run for the hills.
A bit like the graffiti scene in Life of Brian….
“Equivalent of Covid emissions drop needed every two years – study”
This is not the original headline, it was changed from this:
“Global lockdown every two years needed to meet Paris CO2 goals – study.”
https://web.archive.org/web/20210303163030/https://www.theguardian.com/environment/2021/mar/03/global-lockdown-every-two-years-needed-to-meet-paris-co2-goals-study
Don’t you just love the Stasi that work for this toilet paper journal.
The RealClearEnergy link was clearly based on the original headline:
Global Lockdown Needed Every Two Years for Climate Goals F. Harvey, TG
Environmental Journalist Epic at the Grauniad:
Hey Robert, we need to hire a new person to cover the Environment.
What happened to the old one?
She got stuck in the ice on that boat proving the Arctic ice was all gone, the environment guy from the New York times ate her.
Who should we hire?
Same as always, find someone who didn’t have the grades to get into a science program and took journalism instead. Then look at the bottom 10 percentile of that group to find someone who can’t get a job in the news. Pick the one least likely to know it might be risky to travel to dangerous places accompanied by people just as stupid as they are.
Of course, the Mona Loa observations did not notice anything. I guess that might mean that the human contribution just does not mean a lot.
https://www.esrl.noaa.gov/gmd/ccgg/trends/
Let’s unpack this a bit…
The Grauniad journalist wrote that we needed a COVID-style lockdown every other year to save the planet (my paraphrasing). However, Le Quéré et al appear to be calling for what would amount to a cascading COVID-style lockdown:
>The key is cascading… the covid lockdowns caused massive economic damage. But the green fantasy is not a lockdown every other year, but a decrease on top of the earlier decrease on top of the previous lock down. Can you imaging the damage to living conditions that would cause?
Although the measures to tackle the COVID-19 pandemic will reduce emissions by about 7% in 2020, they will not, on their own, cause lasting decreases in emissions because these temporary measures have little impact on the fossil fuel-based infrastructure that sustains the world economy2.
>No, it is not the fossil fuel infrastructure that causes the CO2 emissions, it is the humans that depend on fossil fuels for survival, heating, medical care, food production and transportation. That is not going away, unless the misanthropic green fascists get their way.
I think the point was that the fossil fuel infrastructure was still there and we would go back to taking full advantage of it once the shamdemic was over.
Oh, they might let a few plebs out from time to time when some work is needed. The COVID passport idea is being normalised in the UK. Gone from definitely not government policy, to being already in use – just in another form. Failure to volunteer, and you will need an ankle tag to leave your home, we’ll only take it off if we send you to prison.
I’m from the government, and I’m here to help.
https://www.england.nhs.uk/coronavirus/secondary-care/workforce/digital-staff-passport/
“we had to destroy village in order to save it”
It takes village idiot to raze village.
H. Clinton said something about a “Global pillage”.
Yeah, good luck with that. India and China’s oil & gas use (and corresponding CO2 emissions) has exceeded pre-Covid levels already.
Total (world) liquid fuel demand is expected by the EIA/IEA/OPEC to hit pre-pandemic levels by the fall or early 2022 by the latest.
Ya baby
Loving it here in Alberta
Boom is on, busy as heck
The direct causal links: estimated CO2 emissions trend -> measured CO concentration trend -> measured global average temperature trend, has always seemed doubtful.
That’s not to deny a ‘greenhouse effect’.
The CDIAC-based diagram above indicates relatively insignificant emissions before 1945 yet the putative GAT rose more steeply in the 30 year period before 1945 than 1980 – 2015.
https://www.woodfortrees.org/plot/hadcrut3gl/mean:12/plot/hadcrut3gl/from:1910/to:1945/trend/plot/hadcrut3gl/from:1980/trend
I’ve never come across an adequate explanation from the alarmist side.
Like the aerosol explanation for the post-1945 ‘dip’, the land-use explanation is merely an ad hoc hypothesis (‘a hypothesis added to a theory in order to save it from being falsified’ Wiki), indeed land clearing has been at least as intensive in the past seventy years.
Before about 1960, atmospheric CO2 was increasing faster than emissions. This was probably due to the warm up from the Little Ice Age and land use changes.
In the 1950’s atmospheric CO2 stopped rising, possibly even declined, despite rising emissions. This was probably due to the Mid-20th Century cooling period.
I think about half of the rise from 280-410 ppm can be explained by natural sources.
Thank you.
How about 96% as TonyL suggested?
You can’t get past about 50% if you honor all of the observations.
Under the first “nifty graph”:
In other words, their fantasy estimates that fail to show a dip in actual CO₂ measurements yet show large dip in their “nifty graph”.
Economy killing lockdowns that fail to change atmospheric CO₂ at all.
Paris agreement, an utter failure.
COVID lockdown, an utter failure in reducing COS.
Fiona Harvey dream fantasy tyrannical shutdowns like 2020’s COVID19 shutdown, still utter failures.
Under the first “nifty graph”:
In other words, their fantasy estimates that fail to show a dip in actual CO₂ measurements yet show large dip in their “nifty graph”.
Economy killing lockdowns that fail to change atmospheric CO₂ at all.
Great, appropriate, clips from “Monty Python and the Holy Grail”! My Mom (God rest her soul) and I watched it first run in a theater in Ellisville, MO, that doesn’t exist any more. She was in stitches over the entire movie. She loved all of their movies, and albums. My favorite part of the movie was John Cleese’s bit from this: https://www.youtube.com/watch?v=Xel0c6mpqPA
Monty Python and the Holy Grail might have been the first movie I went to see twice at the theater, the second and third being Midway and Star Wars.
Between VHS ands DVD, I’ve probably seen it over 200 times since 1975… I could probably recite most of the script from memory and I still laugh my @ur momisugly$$ off everytime I watch it… Just like Animal House and Caddyshack.
😆
“Monty Python and the Holy Grail might have been the first movie I went to see twice at the theater, the second and third being Midway and Star Wars.”
With me, it was “2001: A Space Odyssey” (in Cinerama) and “Patton.” I saw both more than once in first run. But I love “Monty Python and the Holy Grail”! One of these days, I’ll have to tell you about my own Castle Anthrax experience. Not in public, though…
Judging from the lingering hard spot and tingling in my deltoid maybe my body just clumped that mRNA like kitty litter, gradually broke it down and pissed it away.
“we had to destroy the village in order to save it” said no one ever !
The true quote was “it’s a shame we didn’t get here in time to save the village, before the Viet Cong destroyed it”. Which was misquoted to serve a political agenda that no one would have supported if quoted accurately.
Peter Arnett, with AP at the time, is the source of the quote. Arnett was fired by CNN for fabricating another story about the Vietnam War in 1998.
Where is the part where the actual CO2 level is shown to have continued to increase despite these cuts?
A missed opportunity to make a more sellable point.
That’s not a point of any kind.
The “cut” was in the rate of increase. Over the past decade, fossil fuel emissions have added about 2.2 ppm CO2 per year to the atmosphere. A 7% reduction of 2.2 would be about 2.0. 0.2 ppm is less than the annual natural variability.