Reposted from Dr. Roy Spencer’s Blog
December 1st, 2020 by Roy W. Spencer, Ph. D.
The Version 6.0 global average lower tropospheric temperature (LT) anomaly for November, 2020 was +0.53 deg. C, essentially unchanged from the October, 2020 value of +0.54 deg. C.

The linear warming trend since January, 1979 remains at +0.14 C/decade (+0.12 C/decade over the global-averaged oceans, and +0.19 C/decade over global-averaged land).
For comparison, the CDAS global surface temperature anomaly for the last 30 days at Weatherbell.com was +0.52 deg. C.
With La Nina in the Pacific now officially started, it will take several months for that surface cooling to be fully realized in the tropospheric temperatures. Typically, La Nina minimum temperatures (and El Nino maximum temperatures) show up around February, March, or April. The tropical (20N-20S) temperature anomaly for November was +0.29 deg. C, which is lower than it has been in over 2 years.
In contrast, the Arctic saw the warmest November (1.38 deg. C) in the 42 year satellite record, exceeding the previous record of 1.22 deg. C in 1996.
Various regional LT departures from the 30-year (1981-2010) average for the last 23 months are:
YEAR MO GLOBE NHEM. SHEM. TROPIC USA48 ARCTIC AUST
 2019 01 +0.38 +0.35 +0.41 +0.36 +0.53 -0.14 +1.14
 2019 02 +0.37 +0.47 +0.28 +0.43 -0.03 +1.05 +0.05
 2019 03 +0.34 +0.44 +0.25 +0.41 -0.55 +0.97 +0.58
 2019 04 +0.44 +0.38 +0.51 +0.54 +0.49 +0.93 +0.91
 2019 05 +0.32 +0.29 +0.35 +0.39 -0.61 +0.99 +0.38
 2019 06 +0.47 +0.42 +0.52 +0.64 -0.64 +0.91 +0.35
 2019 07 +0.38 +0.33 +0.44 +0.45 +0.10 +0.34 +0.87
 2019 08 +0.39 +0.38 +0.39 +0.42 +0.17 +0.44 +0.23
 2019 09 +0.61 +0.64 +0.59 +0.60 +1.14 +0.75 +0.57
 2019 10 +0.46 +0.64 +0.27 +0.30 -0.03 +1.00 +0.49
 2019 11 +0.55 +0.56 +0.54 +0.55 +0.21 +0.56 +0.37
 2019 12 +0.56 +0.61 +0.50 +0.58 +0.92 +0.66 +0.94
 2020 01 +0.56 +0.60 +0.53 +0.61 +0.73 +0.13 +0.65
 2020 02 +0.76 +0.96 +0.55 +0.76 +0.38 +0.02 +0.30
 2020 03 +0.48 +0.61 +0.34 +0.63 +1.09 -0.72 +0.16
 2020 04 +0.38 +0.43 +0.33 +0.45 -0.59 +1.03 +0.97
 2020 05 +0.54 +0.60 +0.49 +0.66 +0.17 +1.16 -0.15
 2020 06 +0.43 +0.45 +0.41 +0.46 +0.38 +0.80 +1.20
 2020 07 +0.44 +0.45 +0.42 +0.46 +0.56 +0.40 +0.66
 2020 08 +0.43 +0.47 +0.38 +0.59 +0.41 +0.47 +0.49
 2020 09 +0.57 +0.58 +0.56 +0.46 +0.97 +0.48 +0.92
 2020 10 +0.54 +0.71 +0.37 +0.37 +1.10 +1.23 +0.24
 2020 11 +0.53 +0.67 +0.39 +0.29 +1.57 +1.38 +1.41
The full UAH Global Temperature Report, along with the LT global gridpoint anomaly image for November, 2020 should be available within the next few days here.
The global and regional monthly anomalies for the various atmospheric layers we monitor should be available in the next few days at the following locations:
Lower Troposphere: http://vortex.nsstc.uah.edu/data/msu/v6.0/tlt/uahncdc_lt_6.0.txt
Mid-Troposphere: http://vortex.nsstc.uah.edu/data/msu/v6.0/tmt/uahncdc_mt_6.0.txt
Tropopause: http://vortex.nsstc.uah.edu/data/msu/v6.0/ttp/uahncdc_tp_6.0.txt
Lower Stratosphere: http://vortex.nsstc.uah.edu/data/msu/v6.0/tls/uahncdc_ls_6.0.txt
I doubt that I can post this comment before the griffbot starts crowing about the Arctic anomaly being the warmest since 1979. Just bear in mind what the average maximum temperature is in the Arctic during November. Does this imply melting? Think!
(Obviously not expecting griff to think or deviate from his agitprop).
It’s people like Griff that shot the scales from my eyes regarding the climate Scientology.
I would like him to know that.
As the earth warmed a bit from the 40s-70s cooling period, the sea ice extent started to decrease after 1979.
No one contests that, warming period.
Contest is, is it natural or human caused?
Climate scientists seized on this and predicted the end for the polar bears, culminating with that disgusting Greenpeace commercial of polar bears falling out of the sky and dying horrible deaths.
But, all objective evidence shows the bears loving it, 3-5 times as many bears as there used to be, definitely no negative impact.
Now a climate scientist would stop and say they may have made a mistake, need to re-evaluate.
But no, like Griff they just push out the timeline of when the decreasing summer extent of sea ice MUST destroy the bears.
And so they become climate scientologists.
So thanks Griff, people like you are the reason I am a skeptic
On the other hand, the tropics don’t look too hot.
The only one alleged conservative TV Network, One America News, today the scrolling banner read….. “November the hottest November ever”.
Hey Roy how about sending them some correct information.
High temperature in the 10-day forecast for Nome, Alaska is -9C
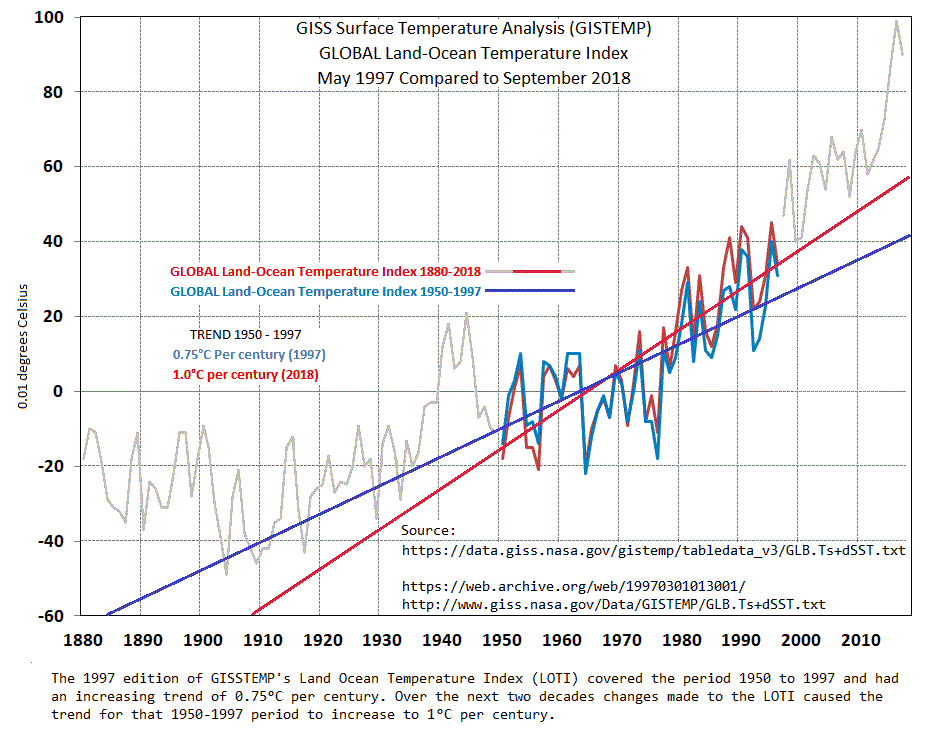
NASA’s GISTEMP hasn’t updated their Land Ocean Temperature Index (LOTI) for November, maybe in two weeks or so it will be out. Anyway, so far in 2020 January through October they have averaged 330 changes each month. Since 2003 the average number of changes to LOTI’s November data has been 304 with a range of 7 to 755. Since 1997 the changes to LOTI have produced a moderate increase in the global warming trend of about 0.25°C per century:
“maybe in two weeks or so it will be out”
Probably a week. But, if you’re curious, TempLS usually gets almost the same surface temperature result as GISS, using unadjusted land data, and is out now. It was a very warm November, just behind November 2015, and up by 0.18°C from October. Unless December is very cool, 2020 will be the warmest year in the TempLS record.
Nick, we are in a warming trend for the last 170 years or so, and as such, it should come as no great surprise that recent years have been the warmest in the empirical record. The issue is two fold, is it a problem? And is it due to CO2?
For me personally, Milwaukee is enjoying warmer winter nights, and cooler summer afternoons. That’s true for much of the United States, and probably true for a lot of other places. Not to put too fine a point on it, I am sick and tired of the bullshit that the so-called mains stream media spews endlessly on this issue.
I’m the guy sitting at the card table in the public square with the sign that says, “CO2 Is Not A Problem, Change my mind.”
“I’m the guy sitting at the card table in the public square with the sign that says, “CO2 Is Not A Problem, Change my mind.”
I like that!
I would like to see that sign appear everywhere there is a public discussion of Human-caused Climate Change. Show one to your local politician if he decides it’s a good idea to promote a carbon dioxide tax, or some other foolishness related to CO2.
A sign like that will quickly demonstrate that proponents of Human-caused Climate Change don’t have the facts to support their position. Assuming they deign to take part in the discussion.
Hi Nick
looking at your TempLS chart, then look at the following chart.
There is only two places the that heat is going to – up – North and South
Here you see the effects at altitude
https://ozonewatch.gsfc.nasa.gov/meteorology/figures/merra2/wind/u45_75s_100_2020_merra2.pdf
https://ozonewatch.gsfc.nasa.gov/meteorology/figures/merra2/wind/u60s_100_2020_merra2.pdf
and hey presto – the dilution of ozone over Antarctica – record setting
https://ozonewatch.gsfc.nasa.gov/meteorology/figures/ozone/to3areas_2020_toms+omi+omps.pdf
And in the north above 60N
https://ozonewatch.gsfc.nasa.gov/meteorology/figures/ozone/to3capn_2020_toms+omi+omps.pdf
For every action there is a reaction
And then there is the sea ice
https://nsidc.org/arcticseaicenews/charctic-interactive-sea-ice-graph/
Kind regards
Forgot this

El Nino is one thing, but not everything
Poor Nick-o-bait complains about the NATURAL warming out of the COLDEST period in 10,000 years
YAWN !!!!!!
Context is everything! Sane, honest scientists, like the originator of the CO2-causes-warming idea, Arrhenius, assumed more than a hundred years ago that the warming would be a good thing.
And forgot this

Atmospheric Entanglement
The lowest ozone value above the Arctic – NHPC >60N (Northern Hemisphere Polar Cap) is on the 27th of September
The lowest ozone value above the Antarctic – SHPC > 60S (Southern Hemisphere Polar Cap) is on the 30th of September.
Why – Because they are both responding to the same pressure displacement from the low latitudes.
Your chart is recording only one of the byproducts of high volume low latitude convection – no more – no less.
Notice how NASA Ozonewatch and associates are silent at the moment…. They have no answers.
https://ozonewatch.gsfc.nasa.gov/meteorology/figures/ozone/to3capn_2020_toms+omi+omps.txt
https://ozonewatch.gsfc.nasa.gov/meteorology/figures/ozone/to3caps_2020_toms+omi+omps.txt
TempLS uses the COLDEST period outside the LIA.. ie the 1970 “cooling” period as a reference
Pretty sick form of cherry-picking…… of course everything is warmer now.
Whoever runs that is obviously pretty much a charlatan/conman.
This guy’s thoughts are hair-raising.
https://www.youtube.com/watch?v=eeQsGVfbD6E&feature=emb_logo
You are right. It is brazenly delusional and almost like someone might talk when being cared for in an ‘institution’.
Lurch needs video speed @+1.5….. life’s too short.
Yes and yes.
Bucket loads of progressive projection here.
I think it’s clear that one weak solar cycle is not enough to offset warming. The stepladder continues to ratchet up, though at a benign/diminishing rate.
While SW radiation may drive the warming in the indo-pac, the greenhouse effect likely reduces cooling as the heat accumulates and is then released during el Nino events (plus some additional heat from clear daytime skies during el nino).
It’s been 2 weak cycles, a question, will it be 20?
Global warming or cooling takes a long time.
We are living in an Ice Age, to not live in an Ice Age requires a warmer ocean.
During our Ice Age the average temperature of ocean stays within the range of 1 to 5 C
and that is a cold ocean. We have been falling into Ice Age for 10 million year, or before this Earth had a warmer ocean than 5 C and had earlier warmer periods with ocean above 10 C.
Our ocean average temperature presently is about 3.5 C and within our Ice Age [within hundreds of thousands of years] the it’s been 4 C or warmer and within last 1/2 million years, the Ice Age has been the coldest it’s been for hundreds of millions of years, and recently in terms centuries, the Little Ice Age has been the coldest for thousands of years, and Little Ice Age dipped to an ocean temperature by about .2 C cooler or about 3.3 C.
If our present recovery from coldest times of LIA AND a 5000 years trend of decline and if ocean were warms to 4 C, one should see, an ice free polar ice in the summer. And might see ice free winter {or hardly any polar ice ice form in the winter].
It’s considered that in the earlier part of our Holocene [Holocene climatic optimum] there wasn’t polar sea ice during the summer. And during the Holocene climatic optimum the world’s greatest forest [Taiga] was even larger than it is presently.
{Or I guess one could say, we had tundra shortage during Holocene climatic optimum- and I guess one also say, a desert shortage, globally}.
What Wiki says:
” The Holocene Climate Optimum warm event consisted of increases of up to 4 °C near the North Pole (in one study, winter warming of 3 to 9 °C and summer of 2 to 6 °C in northern central Siberia). Northwestern Europe experienced warming, but there was cooling in Southern Europe. The average temperature change appears to have declined rapidly with latitude and so essentially no change in mean temperature is reported at low and middle latitudes. Tropical reefs tend to show temperature increases of less than 1 °C; the tropical ocean surface at the Great Barrier Reef about 5350 years ago was 1 °C warmer and enriched in 18O by 0.5 per mil relative to modern seawater. In terms of the global average, temperatures were probably warmer than now (depending on estimates of latitude dependence and seasonality in response patterns).”
https://en.wikipedia.org/wiki/Holocene_climatic_optimum
gbaikie
December 6, 2020 at 11:00 am
Good clear perspective. We need more of this at WUWT and less bickering and troll baiting.
Thank you.
It’s all relative, the cycle before the recently finished solar cycle may have been weaker than previous decades, but was still relatively high.
“at a benign/diminishing rate.”
Based on what?
Based on FAR MORE evidence that YOU have ever produced.
El Ninos caused warming surges in 1979/80, 1998/2000 and a big surge with the big blob in 2015-2017.
Between those solar powered ocean energy events.. NADA, NOTHING. !
CO2 does not cause El Nino events.
As you are well aware….There is NO EVIDENCE that human CO2 has caused any of this highly beneficial warming out of the coldest period in 10,000 years.
The greenhouse effect likely leads to more heat accumulated in the Indo-Pac warm pool. More heat to be discharged during those events.
“likely”… roflmao !!
Baseless supposition, you mean ?
Do you have any evidence at all to back up that silly statement.
Or do you already know that there is absolutely NO SCIENTIFIC BACKING for that nonsense.
So your “rate” is based on two data point?
Poor loy…. your rate is based on absolutely NOTHING
NO EVIDENCE of anything
PURE FANTASY.
“Based on what”
The actual data, as opposed to models.
The recent super El Niño step was similar in size and slightly smaller than the 1998 step, despite a much larger increase in greenhouse gases during a similar timeframe. As Spencer states, the long-term rate is .14° per decade, about half of what’s needed for costs to ever exceed the benefits.
Aaron, why do you ignore the AMO, PDO and millennial cycles? Just another example of science denial.
Only warming has come from solar driven El Nino events .
Solar activity has been high for quite a while.
Minor internal radiative effects DO NOT effect global climate.
Does not reduce cooling. CERES shows that, as the OLR follows atmospheric temperature
According to the 2004 guess er…. model from NASA the temperature anomaly at the end of 2020 should be 1C +/- 0.75C, so Iguess the models are accurate /sarc
Accurate ‘ish, at least with error bars and swags.
~points finger and hisses~
“Deeeee Niiiiiiii Yeeeeerrrrrr!”
again /sarc
Let me guess – all the warming is in places with no people, e.g. oceans basins, Siberia etc?
No need to guess, you can look at the map.
https://www.nsstc.uah.edu/climate/
Much of the warming was in North America, Europe, Asia and Australia. So not all places with no people.
Warmest November in Australia too I think, according to UAH; also BOM, whose records go back a bit further. Warmest northern hemisphere fall/autumn (Sep/Oct/Nov) in UAH also, narrowly warmer than second-placed 2019. ENSO neutral or naturally cooling La Nina conditions current during the period. Most odd.
wasn’t it gorgeous. 🙂
Rest of SH .. not so warm
ie WEATHER..
One day rusty nail will figure out the difference.
And absolutely NO EVIDENCE that humans have caused any of this highly beneficial warming.
Solar energy still very high…
Ocean seismic activity a far better match to temperatures than CO2
(even though CO2 is caused by natural warming)
TheFinalNail, ocean effects are often longer lasting than our simple metrics. The ocean warming from the latest El Nino persisted for several month and has just recently started to fade. Same thing happened after the 2016 El Nino. Easily seen in the data.
https://woodfortrees.org/plot/hadsst3gl/from:2014/to/plot/hadsst3gl/from:2014/to:2018.1/trend
Now watch the SST trend head down as the oceans cool. UAH will soon follow.
This makes 2020 the 2nd warmest November in the UAH record, only 0.02°C below the previous record set last year.
Of the 11 months so far of 2020, 6 have been 2nd warmest for their respective calendar month, and unless something truly spectacular happens in December, 2020 is very likely to be the 2nd warmest year in the UAH history. This will put it somewhere between 1998 and 2016.
And?
“And?”
And hopefully we can all agree that the imminent ‘global cooling’ predictions by the likes of David Archibald etc, that were a common feature on this site when it first started, can safely be consigned to the dustbin.
Hopefully, given the complete LACK OF SCIENTIFIC EVIDENCE…
….. we can consign the CO2 warming fairy-tale to the dustbin
Wouldn’t you agree, rusty !
I’m interested in what you would consider “SCIENTIFIC EVIDENCE” for CO2 warming. I.e. what would falsify your hypothesis that CO2 warming is a fairy-tale?
So you don’t know what scientific evidence is.
Why not just say that !!
You do know that warming by atmospheric CO2 has NEVER been observed or measured anywhere on the planet, don’t you ?
Its a theoretical and modelling construct, based on erroneous understanding of how the atmosphere works.
It DOES NOT EXIST in real life.
What your falsify your fairy-tale that atmospheric CO2 causes warming, cooling, wet weather, dry weather, more rain, less rain, less hurricanes, more hurricanes..
… and all the other thousands of totally moronic claims of the AGW farce.
When you INVENT a substance that can do …. ANYTHING..
…. it can’t be falsified
But it ISN’T SCIENCE, its just fantasy -fiction.
What about the hockey stick in the dust bin.
”And hopefully we can all agree that the imminent ‘global cooling’ predictions by the likes of David Archibald etc, that were a common feature on this site when it first started, can safely be consigned to the dustbin.”
No. Depends what you mean by imminent. If you mean next year, possibly, but in our case, temps could peak for 30-40 years before starting to fall. We need to wait at least another 10 years before commenting with any kind of conviction. Keep the dustbin lid closed.
We suffered global cooling after 1997-98 Super El Nino and now are yet again enduring cooling after 2015-16 Super El Nino. How long will the current cooling trend last? No one can say. But we’re in La Nina conditions, which are more likely to be followed by another Pause or cooling.
The El Nino/Big Blob effect in the Arctic is diminishing slowly.
Before that 2015 El Nino, Arctic trend was basically dead flat this century. (since 1998 El Nino)
The 1998 El Nino didn’t cause a spike in the Arctic, The step change was actually in 1995
And yes the Arctic WAS COOLING between the 1979/80 El Nino and that step change
Interestingly, If you look at this graph
You can see a slight step up in 2005, followed by COOLING, then another slight step up in 2010, followed by COOLING, then a big step, followed by COOLING.
This is definitely NOT a signature of CO2 warming.
There is actually NO SIGN of any CO2 warming in any un-corrupted data.
Plenty of UHI effects, and data adjustments….
but CO2 warming .. NADA, NOTHING
Well, since you asked, a few other trivia facts:
The last 7 Novembers, starting in 2014 have all been in the top 9 warmest Novembers.
November 1990 set a record at the time of 0.25°C. This record would only be beaten nineteen years later in 2009, and then only by 0.02°C. The last 6 years have all beaten it, the last two times by more than 0.25°C.
Once 2020 is completed, 18 of the 20 warmest years will have been in the 21st century. Six of the 10 warmest years will have been in the last ten years.
If you are after broader point, this does suggest we have had an unusually long run of hot years even given the warming trend. But I’m not suggesting this marks an acceleration in the warming rate, it’s just an interesting counterpoint to those arguing global warming stopped as soon as they saw a few years below the trend.
Bellman, everything you just stated is completely explained by natural ocean cycles. There is absolutely no need to apply any warming from AGW or anything else. The oceans explain is all. Why do to ignore the simplicity of easy explanations?
Did I mention AGW?
If everyone was so convinced that their pet theories completely explained all the warming, I suspect they wouldn’t be so eager to jump on anyone pointing out that warming has occurred.
Glad you agree that AGW isn’t happening.
Maybe you are capable of learning.
“Glad you agree that AGW isn’t happening.”
Did I say AGW wasn’t happening?
You really need to calm down and read what other people are saying before jumping to conclusions.
Do you have any proof that it is ?
Or are you just another empty sock !
Starting 1700 or whenever, was the COLDEST period in 10,000 years
Be VERY THANKFUL of the highly beneficial NATURAL warming since then.
Of course , as the solar input has been at its consistent HIGHEST since the LIA, only a complete moron would expect cooling !!
A pot of water always warms up when you continue to heat it.
Or does basic PHYSICS delude your tiny little mind.
“The last 7 Novembers, starting in 2014 have all been in the top 9 warmest Novembers.”
You say that like it proved something.
Doesn’t prove anything, but it is indicative of a warming trend. But you don’t need to look at arbitrary records for that, just look at the statistically significant trend over the last 40 years.
And the cooling from 1940-1970
And the massive cooling from 3000 years ago down to the Little Ice Age.
Be VERY GLAD of the slight but highly beneficial NATURAL warming out of the LIA, Coldest period in 10,000 years
BE VERY GLAD the temperature didn’t go the other way.
BTW, Warming in the last 40 years is ONLY from El Nino releases of solar forced ocean warming.
Apart from UHI effects smeared across the whole of the surface data, and the large but “not-real” data adjustments…….
There is no warming that can be attributed scientifically to human anything.
“And the cooling from 1940-1970”
I’m talking about the UAH data – the data this post is about, and that starts in December ’78.
“BTW, Warming in the last 40 years is ONLY from El Nino releases of solar forced ocean warming.”
Really? To use your own demands, do you have any empirical scientific evidence to back that claim? I’m particularly interested in evidence for the “ONLY” part.
OMG you are VERY THICK aren’t you Bellhop !!
No warming, just a zig-zag, from 1980 -1997
No warming from 2001-2015
(waiting for you to show your mathematical incompetence by putting a linear trend trough cyclic data. 😉 )
Still running away from posting empirical evidence of warming by atmospheric CO2, I see.
So funny !
“nd that starts in December ’78. ”
yep, just at the coldest point since the climb out of the LIA.
Of course that is where you would start if you wanted to cherry-pick to show a warming trend
Its a pitifully short period of time, isn’t ..
… doesn’t show us anything except the El Nino step changes.
“No warming, just a zig-zag, from 1980 -1997 … No warming from 2001-2015”
Average anomaly 1980-1997: -0.104°C
Average anomaly 2001-2015: +0.137°C
Average anomaly 2017-2020: + 0.393°C
Your claim is that all this warming is caused by El Niños. I’d like to understand how a big El Niño in 1998 causes a decades long change in global temperatures, rather than just dissipating as my primitive notion of physics suggest is should.
“Of course that is where you would start if you wanted to cherry-pick to show a warming trend”
I’m starting there because that’s where Spencer and Christie decided to start the satellite data. I’m only commenting on the UAH data, because that’s the only data WUWT regularly publishes, possibly because it shows the least amount of warming. If you have a problem with UAH being used maybe you could take it up with this site rather than me. But I expect any data showing a longer time period will be rejected by you as well.
“Still running away from posting empirical evidence of warming by atmospheric CO2, I see.”
I try to avoid these silly games because I’m not a scientist, anything I say is likely to be simplistic or misleading. And, I know this game of asking for “empirical” evidence and then tearing any evidence as not being “empirical” enough, or not actually proving something – hence my question as to what sort of empirical evidence would convince you. Judging by some of your comments below, it’s obvious the answer is nothing as you believe you are in a war against the theory.
However, if you do really want some empirical evidence that increasing atmospheric CO2 can cause an increase global temperatures, the obvious evidence is that as we’ve increased atmospheric CO2 temperatures have increased. Indeed, looking just at UAH, there’s a clear, statistically significant correlation between annual temperatures and CO2 levels.
Of course, none of this is proof. Correlation doesn’t mean causation etc. But it is evidence, which is what you asked for.
“Unprecedented”…is that the word you should use?
Maybe “extreme?”
Who uses the word “Unprecedented”?
I can’t find it in any of the above comments.
Glad you agree that the current warming is NOT “unprecedented”
In FACT, nearly ALL of the last 10,000 years have been WARMER than now.
That’s how “unprecedented” it is.
Yet still well below most of the last 10,000 years
And that SLIGHT warming has been HIGHLY BENEFICIAL natural warming out of the COLDEST period in those 10,000 years.
They don’t graduate air-con thermostats in 0.02C intervals for a reason.
What do you expect to happen when the Sun is pretty much near its maximum since the LIA….
…. cooling ????
Interesting that you are able to conjur up (unsourced) TSI data dating back to the 1600s when the instruments that are able to accuratly measure TSI only date back a few decades.
Did you mean sunspot numbers? Are you using a ‘model’ (choke!) to extrapolate TSI from sunspot numbers? What is your source?
Your data look completely unlike the actual TSI values currently published by PMOD/WRC:
https://www.woodfortrees.org/plot/pmod
You poor thing. Source is the most up-to-date estimates of solar energy.
If you don’t know where to find them, not my problem.
They have been keeping track of solar sunspots etc since the 1600’s
TRY NOT TO BE MORONICALLY IGNORANT all your life !!
“Your data look completely unlike the actual TSI”
You poor mathematically illiterate dolt.
Read what my graph says it is..
… find the full data set back to and graph it.
Are you capable of doing that ???
Don’t display your mathematical incompetence and lack of understanding so blatantly.
We could also look at the 40 year trailing TSI average
IFF you are capable of reading a basic graph, you can see that TSI has been pretty much on 10 for the last several decades.
The amount of accumulated energy is enormous.
It would be a lot easier if you said what data you are using, rather than telling people to guess and insulting them for not finding it.
In any event I’m puzzled by your point. You say that TSI is currently the highest since the 17th century and that explains why warming is continuing, yet your graph shows TSI over the last 30 years as being comparable to the late 18th century and mid 19th century, when temperatures were much colder.
OMG , you are yapping mindlessly pretending you know stuff…….
Yet are CLUELESS about where to get TSI data. ….. Hilarious. 😄
Those single peaks in the late 18th century and mid 19th century caused some of the warming out of the LIA (coldest period in 10,000 years)
FACT IS, from solar data, the last 50+ years have been the highest combined/ accumulative TSI since the depths of the LIA.
That is what the data CLEARLY SHOWS.
Choose to remain ignorant.. Its your choice.
“OMG , you are yapping mindlessly pretending you know stuff…”
I hope I didn’t give the impression that I know stuff. I know very little of the actual science. I really have little knowledge of how TSI is measured or how much of an effect it has on temperatures.
But I do know that when someone is asked to provide a source for some data, instead tells people they’re ignorant and should find the source for themselves, that’s probably a good sign they don’t have much confidence in their own source.
“Those single peaks in the late 18th century and mid 19th century caused some of the warming out of the LIA…”
What data are you using for the LIA temperatures? Those peaks in TSI don’t seem to have any correspondence with warming in CET. Temperatures where falling rapidly after 1740, at the time your data shows TSI rising for example.
Based on another graph you posted I assume your source is
https://spot.colorado.edu/~koppg/TSI/
Would it have been so difficult just to provide this link?
Note, the data is described as “unofficial”
So you agree my graphs are correct.
Thank you. !
See is wasn’t that hard for you to do you own homework, no was it.
Earlier reconstructions show an even stronger solar TSI in the last 50-60 years.
If you are going to bother commenting, you should at least try to keep up.
“So you agree my graphs are correct.”
You are keen to score cheap points aren’t you. No don’t agree your data is correct, nor do I disagree. I simply wanted to know what your source was so I could check it for myself. You know, as skeptics are meant to do.
As to the data, I merely mentioned that the author regards it as “unofficial”. It’s his best guess of what the TSI was in the past few centuries, based on various assumptions like any model.
“See is wasn’t that hard for you to do you own homework, no was it.”
You see, the general idea is that if you provide data, you should be able to tell people what the source was, rather than forcing them to guess.
“Earlier reconstructions show an even stronger solar TSI in the last 50-60 years.”
Yes, which is why you were asked what your source was – the particular reconstruction you used differs quite a lot from others, and there’s no reason to suppose your preferred model is better than any other.
Now we’ve established what data you are using, all that remains is for you to demonstrate how the TSI levels can explain the current warming.
So you found the data and are INCAPABLE of reproducing the graphs
I guess that says it all doesn’t it.
“and there’s no reason to suppose your preferred model is better than any other. “
Greg Kopp’s series is the flattest of all the TSI series, were you IGNORANT of that , as well…
Previous series give a far greater TSI anomaly over the last 50-70 years
“how the TSI levels can explain the current warming”
Only a complete moron in DENIAL of all science and reality, doesn’t realise that the SUN provides the energy for the Earth’s systems.
“So you found the data and are INCAPABLE of reproducing the graphs”
What are you on about now. Yes of course I can do anything I like with the data. The question wasn’t about the accuracy of your representation of the data, it was about what data you used.
“Previous series give a far greater TSI anomaly over the last 50-70 years”
Again, that was why you needed to specify which data set you were using. The data you were using didn’t agree with other data sets.
“Only a complete moron in DENIAL of all science and reality, doesn’t realise that the SUN provides the energy for the Earth’s systems.”
Yes. Now explain how the small changes in TSI can be used to explain the observed changes in temperature. For bonus points you could try explaining how you are so sure changes in CO2 have no effect on temperature changes.
OMG , you are SO THICK .. is your IQ even in double digits ???
Go and look up all the different TSI reconstructions over time
You will see that only a few years ago there was a much higher range of data, hence the recent maximum is even more pronounced than in the Kopp flattened reconstruction
But really! trying to DENY what is in front of everyone’s eyes, ie the strong series of solar cycles over the last several decade..
… really is the depth of the anti-science sewer that alarmist trolls represent.
For a bonus , you could try answering these two questions..
1… Do you have any empirical scientific evidence for warming by atmospheric CO2?
2… In what ways has the global climate changed in the last 50 years , that can be scientifically proven to be of human causation?
ROFLMAO..
Bellhop thinks the SUN doesn’t heat the planet
So hilariously DUMB. !!
He also agrees that previous versions of TSI reconstruction give a MUCH MORE PRONOUNCED Grand Solar Maximum through the last 70 or so years.
Thanks for making my point for me, dolt !
Now off you trot, someone needs the elevator, Bellhop. !
Other solar proxies eg ¹⁰Be Concentration, also show a large increase in solar activity
And another couple of reconstructions of solar TSI
fred250: Only a complete moron in DENIAL of all science and reality, doesn’t realise that the SUN provides the energy for the Earth’s systems.
Bellman: Yes
fred250: Bellhop thinks the SUN doesn’t heat the planet
You might want to check your dictionary under the word “yes”.
In this case “Yes” means I agree the sun heats the planet.
The question you don’t seem to understand is to what extent small variations in the suns total output change global temperatures, and whether they can explain all of the current warming.
“ He also agrees that previous versions of TSI reconstruction give a MUCH MORE PRONOUNCED Grand Solar Maximum through the last 70 or so years.
Thanks for making my point for me, dolt !”
I pointed out your “most up-to-date” data didn’t support the point you were trying to make, now you agree that older out of date data supported your case more.
All this really says to me is that there’s a lot of uncertainty in estimating historical TSI, which is hardly surprising. If there’s a particular data set you’d prefer I used to check your point, let me know. In the mean time I’ll stick with the Kopp data, just because I’ve already downloaded it.
“I pointed out your “most up-to-date” data didn’t support the point you were trying to make,”
Poor dumb Bellhop
I was USING the most up to date data.
And yes it DOES SUPPORT the point I was making.
The graphs I put forward are USING THE KOPP DATA.
Straight from KOPP DATA.
Just because you are capable of understanding , NOT MY PROBLEM
I can’t help your mathematical ineptitude.
So STOP YOUR MINDLESS TROLLING
Thing Belhop doesn’t understand (apart from everything) is that TSi is not the only solar variable.
Funny how the low period in the 1700s matches the LIA.. and the strong period ni the last 50-70 years matches the warmer period.
Trying to discount the SUN as a cause of warming is childish and anti-science.
But its all the pathetic alarmists have left.
Now stop your childish trolling and go back to junior high for some maths remediation.
“Thing Belhop doesn’t understand (apart from everything) is that TSi is not the only solar variable.”
Once again your mind reading abilities fail you.
So now we are agreed that TSI is not the only solar influence on global temperatures, could you provide some evidence to support your claim that all recent warming can be explained by solar influence, and CO2 has no effect?
“Trying to discount the SUN as a cause of warming is childish and anti-science.”
Just as well I’ve never done that then.
“Now stop your childish trolling and go back to junior high for some maths remediation.”
As soon as you figure out what the word “trolling means.
Do try to keep up with ACTUAL SCIENCE !
I guess its incredibly difficult for someone with your lack of basic education.
THe world is still warming up out of the Little Ice Age.
Wake me up when the world warms up to the levels enjoyed during the Medieval Warm Period.
If you tell me what the average global temperatures where during the Medieval Warm Period, I’ll set the alarm.
Be quite a while !!
Quite a way to go before trees are growing again where retreating glaciers are now.
Given we still have more ice around than we did during the MWP, we’ve got quite a ways to go.
There’s no global warming! COVID is just a flu! Trump won the election!
What a sad, bunch of pathetic old men who are too dumb/crazy to accept reality.
Let it all out Steve……. breathe…. 45 is that your IQ?
Once again, steve demonstrates that he can’t deal with data or logical arguments.
All he can do is whine and insult those who are too smart to agree with him.
“There’s no global warming!”
Where did you get that LIE from ? Are you really that ignorant ????
There has been some highly beneficial NATURAL warming since the LIA (the coldest period in 10,000 years)
Just that there is no evidence of any human causation.
Feel free to produce some actual scientific evidence, if you think there is..
Assumption driven models.. are no evidence.
LIke most warmunists, steve can’t handle actual arguments, so he has to make up arguments to put into other people’s mouths.
Someone steal your doughnut this morning? Maybe you should take your medications before posting?
Note that Australia has an absolutely GORGEOUS November.
Rest of SH must have been quite cool. !
It has been fantastic here in Queensland !
Today it was predicted to snow above 1300m in the hills , we had hail and very cool in Melbourne at the end of our first week of Summer
It is good to see that we have emerged from the cold period in the 70’s. Let’s hope it doesn’t happen again,. Although nat gas is cheap, it’s not that cheap.
Been the best late Summer through Fall weather since moving to Texas. Bring me more of this.
Interesting that we’ve had a plateau (global) for a year and three months. Where next?
Global temperature continues its decline since February 2016. With La Niña ongoing, downtrend is sure to last at least five years. But probably much longer, ie the Pause Redux. Until next Super El Niño.
OT, for griff.
Currently, wind and solar are providing JUST 3.3% of grid demand in the UK
Gas and Nuclear are covering most of the load…
…. with COAL providing MORE THAN wind and solar combined, at 3.5%
Maybe the cooling could be longer than just a couple of short solar cycles.
https://electroverse.net/the-solar-retrograde-cycle-and-little-ice-ages/
https://electroverse.net/antarctic-weather-has-scientists-in-a-spin/
Saw this on Aus. weather https://electroverse.net/agw-cant-explain-australias-extreme-temperature-contrasts/
Not a bad website. As for the Aus BOM. They have been disappearing data from the early years of temp records to prove their warming fallacy.
So – about as warm as the 1930’s
“So – about as warm as the 1930’s.”
No. Far warmer today. Take a look at the first graph.
https://www.climate.gov/news-features/understanding-climate/climate-change-global-temperature
WRONG.. Please don’t use FAKED, highly adjusted crap data.
Use the original data.
Simple simon.. a couple more for you.
Can you read a graph ?
Even Hadcrud shows no arctic warming since 1930s
And sheltered regions away from UHI efects
Portugal… MUCH warmer in the 1940s
USA
Alice Springs FAR warmer in late 1800s
You and your fake graphs Fred. Which corn flakes box did you get these out of? Next thing you will be telling us the election was fraudulent.
It doesn’t matter whether you use adjusted or unadjusted there is no way on Gods earth that 1940 was warmer globally than today. Not a chance in hell. So keep using your sharpie to colour these in, but no one believes your kindergarten graphs Fraud. No one.
Poor simple simon, yet again proves he is mathematically incompetent and is incapable of understanding basic graphs.
Sorry little brain-dead mite.
…. but data CLEARLY SHOWS that the 1930/40 temperature WAS similar or slight warmer time than now.
GET OVER IT !!
Sorry that the ONLY was you can keep your IGNORANCE intact is with MANIC DENIAL of actual REAL WORLD DATA.
Doing this so EVERYONE KNOWS you are a mindless data ignoring cretin.
Please keep going 🙂
“…. but data CLEARLY SHOWS that the 1930/40 temperature WAS similar or slight warmer time than now.”
I’m still confused. In comments above you’re arguing that temperatures currently warmest because we have the highest TSI since the LIA, but here you are claiming temperatures were warmer 90 years ago when TSI was lower.
Either you go with REAL DATA
or you invent crap and alter the real data…..
Which do you want to do.??
TSI is not the only temperature driver. CO2 is NOT a driver at all.
DENYING that the 1930/40 was a very warm period , is just that, Climate Change Denial.
Wouldn’t you agree.
Greenland surface mass balance was lower in the 1930/40s than now.
Iceland temperatures were higher
Central Siberia was warmer as well
Kindergarten graphs, lol so true, and so much persuasive shouting and gnashing of teeth to accompany them. So convincing, show us more.
Loydo doesn’t understand DATA either..
That’s why he never produces any.
Always EVIDENCE FREE.
Nothing to counter actual data… so PATHETIC.
I put charts, because I KNOW the likes of you CANNOT UNDERSTAND actual data.
Still waiting for some of your evidence, empty sock.
“Kindergarten graphs”
That explains why they are SO FAR ABOVE anything you could possibly comprehend
Counter just one of them, or be that yapping chihuahua behind a 2ft fence.
Remain, as always, a meaningless, science-free non-entity.
DENIAL OF SCIENCE AND DATA…
…. the only way you can maintain your childish fantasies. 🙂
It’s only data, when it comes from a simple simon approved model.
Fred
There are three “global” data sets recognised as the gold standard. NOAA’s MLOST, NASA’s GISTEMP, and the UK’s HadCRUT. Choose any of them and you will see all agree the 1940’s weren’t even close to today. Here I will help you:
And here is a bunch of them together. See if you can work out what they all have in common?
https://climatedataguide.ucar.edu/climate-data/global-surface-temperature-data-gistemp-nasa-goddard-institute-space-studies-giss
That’s right, none of them would agree with your Pinocchio statement that the 1940 is as warm as today.
Of course you will say they are fraudulent and corrupted (the go to for people with no argument, as Trump is about to find out with his fraud claims). But Fred, saying it doesn’t make it so. You need to say why they are crooked. All adjustments are explained and documented… but you knew that. So here we go again, why are these data sets not up to your high standard? Is it because they don’t use crayon maybe?
BULLS**T
GISS et al are recognised as a highly adjusted agenda driven load of garbage.
They bear little resemblance to real temperatures, with basically every surface surface station data point being heavily adjusted to get rid of “inconvenient” periods of warming, like the 1940s
If you are UNAWARE of that fact, you really need to go and to some basic research.
See where your previous GISS fabrications come from, and what they do to original data.
Remain simple, simon
GULLIBLY swallow the whole AGW facade without a single rational thought of your own.
Be a good little AGW cult acolite !
Maybe YOU could answer the two questions which all your moronic troll comrades RUN AWAY from !
1… Do you have any empirical scientific evidence for warming by atmospheric CO2?
2… In what ways has the global climate changed in the last 50 years , that can be scientifically proven to be of human causation?
“And here is a bunch of them together.”
OMG, the gullible mind-free moron continues.
Yes mindless twerp, they use the same adjusted base data sets.
That pretense was “BUSTED” ages ago.
BEST was created , using “expectations” of what they wanted the temperature to be, using all the WORST data they could find.. Massive UHI effect smeared all over the place
Of course they did their worst to make it match the other fabrications.
Try not to remain so SIMPLE, slimon.
FACT IS that “pre-adjustments” in raw data the NH was just as warm around 1940 as it is now.
To DENY that the surface data as faked by GISS etal has not been totally mal-adjusted really does show just how IGNORANT you really are.
Fred
“GISS et al are recognised as a highly adjusted agenda driven load of garbage.”
Proof please. A simple credible reference is all I need.
“They bear little resemblance to real temperatures, with basically every surface surface station data point being heavily adjusted to get rid of “inconvenient” periods of warming, like the 1940s”
Proof please. A simple credible reference is all I need.
BEST was created , using “expectations” of what they wanted the temperature to be, using all the WORST data they could find.. Massive UHI effect smeared all over the place”
Proof please. A simple credible reference is all I need.
“FACT IS that “pre-adjustments” in raw data the NH was just as warm around 1940 as it is now.”
Proof please. A simple credible reference is all I need. And not one of your crayon graphs Fred.
So in summary you are saying
– Cowtan and Way
– The Japanese Met service
– Noaa
– Hadley Centre
– And NASA….
Are all wrong, but your crayon graphs are what the real world is about. Wow, just Wow!!! I think I see the glitch in your thinking. See if you can spot it. I’ll give you a clue. It’s the finest climate academies on the planet V’s… well…. Fred.
Poor simple slimon
Yes, all those are based on the same MAL-ADJUSTED data
Are you so DUMB and IGNORANT that you didn’t know that !!
MASSIVE alterations to original raw data were required to fabricate those sets.
A complete fraudulent wipe out of the 1940’s peak in a huge majority of sites.
FFS, do you homework and look at the REAL DATA, not some cultist AGW fabrications.
“A simple credible reference is all I need”
ANYONE can go to the GHCN data and see the MASSIVE ADJUSTMENTS taking place in the data.
Its there for all to see. !!
Why are you SO IGNORANT about the fact that they OPENLY DISPLAY !!
Try not to be an unaware, gullible moron all your simple existence
MASSIVE changes to past data are becoming RAMPANT and EVERYWHERE. !!
https://realclimatescience.com/2020/11/ghcn-v3-unadjusted-data-shows-casa-blanca-cuba-had-a-cooling-trend-since-1880/
https://realclimatescience.com/2020/10/according-to-the-ghcn-v3-unadjusted-data-on-nasa-website-hachijojima-has-seen-no-warming-trend-since-1927/
Fred
That last post is a bit desperate my friend. We are talking global and you have found a few crayon graphs to highlight that some areas may not have warmed as much as the planet. Oh dear.
Only things “desperate” is your TOTAL LACK OF ANY SCIENCE to back up any of the GARBAGE coming out of your mantra regurgitations
STILL WAITING !!!! So far, you are NULL and VOID. !
All you have is mindless trolling.. Its HILARIOUS to watch 🙂
1… Do you have any empirical scientific evidence for warming by atmospheric CO2?
2… In what ways has the global climate changed in the last 50 years , that can be scientifically proven to be of human causation?
Little slimon obvious has never bothered looking at GHCN and seeing the RAMPANT “adjustments”
ALWAYS causing a warming trend where there was never one in the real data.
Produces NOTHING in the way of real data, just mind-numbed rhetoric…..
EMPTY, VOID, NULL.
SO SAD… SO “SIMPLE”
How typical, first simple whines about not posting links.
Then simple whines that the links are not to sites that he approves of.
Next simple will be claiming that Fred never provides links.
Much like his views on science, they are only links when they support what simple wants to believe.
[[The linear warming trend since January, 1979 remains at +0.14 C/decade (+0.12 C/decade over the global-averaged oceans, and +0.19 C/decade over global-averaged land).]]
So, IPCC-brainwashed scientists found a pony in the manure.
+0.14/decade? How can such accuracy be attained from satellites?
I quote Wikipedia:
[[Infrared radiation can be used to measure both the temperature of the surface (using “window” wavelengths to which the atmosphere is transparent), and the temperature of the atmosphere (using wavelengths for which the atmosphere is not transparent, or measuring cloud top temperatures in infrared windows).
[[Satellites used to retrieve surface temperatures via measurement of thermal infrared in general require cloud-free conditions. Some of the instruments include the Advanced Very High Resolution Radiometer (AVHRR), Along Track Scanning Radiometers (AASTR), Visible Infrared Imaging Radiometer Suite (VIIRS), the Atmospheric Infrared Sounder (AIS), and the ACE Fourier Transform Spectrometer (ACE‐FTS) on the Canadian SCISAT-1 satellite.. Over land the retrieval of temperature from radiances is harder, because of inhomogeneities in the surface.]] – https://en.wikipedia.org/wiki/Satellite_temperature_measurements
Duh, how does Spencer get global average temperatures(GATs) for even one day from such spotty unreliable coverage, much less a decade-long average accurate to two decimal places? I suspect that there is no pony in the manure, just a strong desire to find one to make one’s life work have meaning. It would have been more honest and done more good to work all those years in health care.
Physics prohibits gases from emitting Planck radiation that can be used to determine temperature. The surface is solid and emits it, as do water droplets in clouds, but the cloud temperatures are made frigid by the thermodynamic lapse rate and bear little relation to surface temperatures. Any real measurement of surface temperature requires clear air from the measurement surface to space, which is very iffy, so it seems very hard to believe that the temperatures for the entire globe can ever be measured at one time. It looks to me like the year-by-year GAT is really flat within experimental error and the rest is like using a Ouija Board to obtain messages from the beyond and thinking it’s your dear dead mother because she said you get tire tracks in your underwear regularly.
Either way, atmospheric CO2 can’t raise Earth surface temperatures even 0.01C with its weak 15 micron photons that have a Planck radiation temperature of -80C like dry ice. It can’t even interfere with the surface heat deposited by the Sun that stays within a normal range of -50C to +50C. If there were any real but minor GAT increase over the decades, it can’t be CO2 but must be something else, which the IPCC hasn’t been looking for because they might find it and ruin their political program. Meanwhile the horrible leftist-run U.N. IPCC octopus is plotting to rob the world of hundreds of trillions of dollars, as per WUWT’s own article:
https://wattsupwiththat.com/2020/12/05/climate-activists-100-150-trillion-over-30-years-to-fix-global-warming/
http://www.historyscoper.com/whatisenvironmentalismideology.html
After this announcement all kibbutzing talk of how accusing IPCC of leftism is wrong is pure manure sans ponies. Manwhile Spencer and his IPCC-appeasing pals are letting them destroy the world’s future without a fight by giving the IPCC global warming hoax even one iota of credence. We all know that most of that money will be used not to solve a nonexistent crisis but to foist the Marxist idea of social-racial justice after milking the big dumb mainly white virtue-signaling deplorable herd like cows and shearing them like sheep.
We are on the winner’s team all along. Here’s my deepest most thoughtful dismantling of the CO2 global warming hoax using physics, fresh off the presses, free for all to study. I hope it gets wide readership despite IPCC shadow-banning. Once you are “woke”, I hope you become an activist fighting the IPCC’s Great Robbery every step of the way while getting royally pissed-off every time anybody tries to sell it.
https://www.quora.com/What-specific-chemical-properties-of-carbon-dioxide-causes-the-greenhouse-effect-Why-chemically-is-carbon-more-reflective-than-other-gases/answer/TL-Winslow
Take the temperature at the start of the period, take the temperature at the end of the period. Divide by the number of years in the period.
Another month and not much has changed. The reason is pretty clear once you see one graph:
https://woodfortrees.org/plot/uah6/from:1979/to/plot/uah6/from:1979/to/trend/plot/hadsst3gl/from:1979/to/offset:-0.2/plot/hadsst3gl/from:1979/to/offset:-0.2/trend
The satellite temperature follows the changes in the ocean surface temperature (ie. the mixed layer). If you look right at the end of the chart you will see the oceans have just started to cool again after the most recent El Nino. The UAH anomaly will now start to fall with its usual lag.
So, the big question is, why have the oceans been warming? And, even more critical, what has been driving this warming which has been ongoing for the last 400 years.
It could be the sun, it could be ocean currents, it could be something completely unknown, but it clearly isn’t CO2 increases.
I just remind again that the reason for high temperatures since super El Nino 2015-16 is a significant increase of shortwave radiation – not the same thing as total solar radiation. This is not a theoretical issue, because it is based on real satellite measurements. The climate establishment is quiet about this issue because according to IPCC climate models, the temperature increase should be about double as great as measured.
https://www.climatexam.com/single-post/temperature-increase-since-2016-is-not-anthropogenic
Antero,
As has been mathematically proved in my peer reviewed manuscript in the September issue of the journal Dynamics of the Atmospheres and Oceans, all global climate and weather models are based on the wrong atmospheric equations of motion and so it is no surprise that they cannot be trusted. The models violate the Kreiss Bounded Derivative Theory and the basic tenets of numerical analysis.
Jerry
What, based on both data (see below)? Geez, talk about a hair-triggered.
Based on an INFINITE amount more than ANYTHING you have ever produced or are capable of producing.
Why do you choose to be so PATHETIC, loy-dumb ?
Well, I am just an occasional reader and commenter here at WUWT, and I have not followed all the squabble in excruciating detail as some people have.
I would just like to note that I am old enough to remember the ‘Global Cooling’ scare of the 1970’s, when all the ‘experts’ were warning that unless we did just as they demanded, the Earth would cool, there would be crop failures, mass starvation, and we were ALL GONNA DIE!
But….. the various instruments indicated that ‘The Cooling’ stopped right around 1979 or so, and things apparently started warming back up. Warming up, that is, compared to the endpoint of the decade of cooling.
So….. is that why all these temperature graphs BEGIN right at the End of the Cooling, so right at the indicated Coolest Temperatures?
How about all the temperature graphs start at, say, 1900, or some point OTHER than the End (and thus the coolest point in time) of the Great Cooling?
Please don’t flame me….. I am just pointing out what I have noticed, following the debates over the last several years.
The above graphs are satellite measured temperatures and the technology only appeared in the late 1970s. There are other sources of data but none of them are nearly as reliable nor have the global coverage of satellite data.
Richard M,
There are many mathematical flaws with satellite data, especially over cloudy regions. The radiances have to be converted to temperature by inverting an integral. This is an ill posed mathematical problem and the inversion process over clouds involves some questionable approximations. If I recall correctly a large part of the earth is covered by clouds?
Jerry
Simply put the results come from satellites which went into operation from 1978, other temperature records using thermometers go back to 1850, and beyond that it’s ice cores and Geology.
Climate believer,
There are some serious mathematical issues with satellite temperature measurements,
Especially over cloudy regions.
Jerry
Check out NIno34 anomaly temperatures, now down to minus 1.2C – in a few months, winter should be cold.

Check the beautiful La Nina in the equatorial Pacific Ocean – the blue stuff.

In the absence of major century-scale volcanoes:
UAHLT Anomaly four months later = approx. 0.20*Nino34SSTAnomaly + 0.15 = 0.20*(-1.2) + 0.15 = minus 0.09 = approx. minus 0.1C
The above decades-old strong relationship has been a bit wobbly lately – let’s see if it holds up this winter.
Reference:
https://wattsupwiththat.com/2019/06/26/part-of-the-pacific-ocean-is-not-warming-as-expected-buy-why/#comment-2732128
Could you provide a link to a chart comparing actual temperatures to IPCC projections? If such chart exists, of course.
You mean this one ?
I have a feeling there is a more up to date one somewhere.. can’t see it in my folder, sorry.
Thank you!
Pretty nice Nov here in the US central Appalachians — only a couple snow showers. Didn’t have to use much heat.
Admittedly this is anecdotal, but I just dont see it from my personal experience. When I first moved to the Kansas City area we would see multiple days, up to a week, with temperature over 100 degrees F during the day. This was in in 1989. Since about 2000 we have seen less than a week total of temperatures over 100. I just dont think the data on the ground supports the claim of temperature going up. I suspect there is something baked into the adjustments that forces the yearly temperatures to go up after adjustments, regardless of the measured temperature.
Andrew Kerber
Why do people like you always think that a cooling in their small, tiny backyard means that the Globe can’t warm up?
It is exactly as if I would deduce from the warming in our little Germany that the Globe can’t cool down.
PLEASE THINK GLOBAL.
J.-P. D.
Bindidon,
You have hit on a very important issue. The global set of temperature measurements is very sparse, especially over the oceans. There is not a sufficient number of measurements to accurately approximate the mean temperature which is an integral of temperature over the integral of the volume even if the
temperature measurements were perfect.
Jerry