Effects of the pandemic will be detected in the atmosphere much later – To reach the Paris climate goals, decade-long measures are needed
KARLSRUHER INSTITUT FÜR TECHNOLOGIE (KIT)

Based on current data measured in the energy, industry, and mobility sectors, restrictions of social life during the corona pandemic can be predicted to lead to a reduction of worldwide carbon dioxide emissions by up to eight percent in 2020. According to the Intergovernmental Panel on Climate Change (IPCC), cumulative reductions of about this magnitude would be required every year to reach the goals of the Paris Agreement by 2030. Recent measurements by researchers of Karlsruhe Institute of Technology (KIT) revealed that concentration of carbon dioxide (CO2) in the atmosphere has not yet changed due to the estimated emission reductions. The results are reported in Remote Sensing (DOI: 10.3390/rs12152387).
The corona pandemic has changed both our working and our private lives. People increasingly work from home, have video conferences instead of business trips, and spend their holidays in their home country. The lower traffic volume also reduces CO2 emissions. Reductions of up to eight percent are estimated for 2020. “In spite of the reduced emissions, our measurements show that CO2 concentration in the atmosphere has not yet decreased,” says Ralf Sussmann from the Atmospheric Environmental Research Division of KIT’s Institute of Meteorology and Climate Research (IMK-IFU), KIT’s Campus Alpine, in Garmisch-Partenkirchen. “To reduce CO2 concentration in the atmosphere in the long run, restrictions imposed during the corona pandemic would have to be continued for decades. But even this would be far from being sufficient.”
To prove this, researchers additionally studied a long-term scenario that can be controlled well with atmospheric measurements: The goal of the Paris Climate Agreement to limit global warming to 1.5 degrees Celsius can only be reached by an immediate significant reduction of CO2 emissions and a further decrease down to zero by 2055. “The restrictions imposed during the corona crisis, however, are far from being sufficient. They have just resulted in a one-time reduction by eight percent. To reach zero emissions in the coming decades, cumulative reductions of the same magnitude would be required every year, i.e. 16 percent in 2021, 24 percent in 2022, and so on. For this, political measures have to be taken to directly initiate fundamental technological changes in the energy and transport sectors,” Sussmann says.
For the study, the team used data from the Total Carbon Column Observing Network (TCCON). It measured the concentrations in different layers of the atmosphere above Garmisch-Partenkirchen and at other places around the globe. “High-tech infrared spectrometers are applied, which use the sun as a light source. The measurement method is highly precise, uncertainties are in the range of a few thousandths,” Sussmann adds.Long Life of CO2 Prevents Early Detection
According to the researchers, the long life of CO2 and the high background concentrations that have accumulated since the start of industrialization prevent the changes in the atmosphere from being detected. “But also natural impacts make early detection difficult: Anthropogenic emissions, the main cause of the long-term increase in atmospheric CO2, are superposed by annual fluctuations of the growth rate due to natural climate variabilities of ocean sinks and land vegetation,” Sussmann says. Successful emission reduction, hence, is hard to detect by atmosphere measurements.
For their study, the researchers compared the TCCON measurements with the prognoses of the atmospheric growth rate for 2020 – with and without corona restrictions. “Precision analysis of atmosphere measurements revealed that the impacts of COVID-19 measures on the atmosphere might be measured after little more than six months, if the reference state without COVID-19 would be predicted precisely,” the climate researcher explains. “In any case, we would be able to find out within presumably two and half years, whether global political and social measures will help us find viable alternatives of fossil fuels and reach the goals of the Paris Climate Agreement.”
###
Original Publication:
Sussmann, R., and Rettinger, M.: Can We Measure a COVID-19-Related Slowdown in Atmospheric CO2 Growth? Sensitivity of Total Carbon Column Observations, Remote Sens., 12, 2387, 2020. doi:10.3390/rs12152387
More about the KIT Climate and Environment Center: http://www.klima-umwelt.kit.edu/english
Being “The Research University in the Helmholtz Association”, KIT creates and imparts knowledge for the society and the environment. It is the objective to make significant contributions to the global challenges in the fields of energy, mobility, and information. For this, about 9,300 employees cooperate in a broad range of disciplines in natural sciences, engineering sciences, economics, and the humanities and social sciences. KIT prepares its 24,400 students for responsible tasks in society, industry, and science by offering research-based study programs. Innovation efforts at KIT build a bridge between important scientific findings and their application for the benefit of society, economic prosperity, and the preservation of our natural basis of life. KIT is one of the German universities of excellence.
The week ending April 18 saw 17,052 so-called Covid-19 deaths in the USA. The week ending September 19, last week, saw 149. This is over.
Tell all your friends!
Michael Moon,
I’m uncertain if you’re a troll, a Russian bot, or just plain uniformed, but you cited statistic is just flat out WRONG.
According to data summarized by WHO in their September 20, 2020, COVID-19 epidemiological status report, the data over the preceding 7 days for just US COVID-19 attributed deaths was a total of 5,633 (see: https://www.who.int/docs/default-source/coronaviruse/situation-reports/20200921-weekly-epi-update-6.pdf?sfvrsn=d9cf9496_6 )
Tell all your friends . . . about your mistake.
Michael Moon September 22, 2020 at 9:38 am
The week ending April 18 saw 17,052 so-called Covid-19 deaths in the USA. The week ending September 19, last week, saw 149. This is over.
There were that many deaths in Florida on one day last week (Sept 17).
@Joletaxi
“”””””I told my dog about it, he seems to approve, he wags his tail.””””””
I see , dogs understand you better that humans , even if they are not scientists
Corona reduction will NEVER be detected–because fossils are NOT the primary source of the Keeling curve rise in carbon dioxide. Fossil emissions are absorbed by plants making more Life. Indeed, the craziest conspiracy theory I have seen says space aliens are behind the whole climate hysteria, trying to sucker humans into destroying our biosphere so they can move in with some other form of life!
Once Dr. Keeling got past the seasonal variation in CO2 levels and discovered the year-by-year rise, one wonders what is causing that. Could it be natural? It could, and WUWT has had a number of articles and posts about ocean CO2 cycles. But what “hits you over the head” is fossil fuels. All those cars, trucks, buses, coal–of course!
WRONG. Challenging assumptions is one of the fundamentals of science. Your idea can be as obvious and logical as you please , but you still have to test it.
My favorite T-shirt says “Lord, make my words as sweet as honey, for tomorrow I may have to eat them.” I laughed my head off when I first saw that, because I had just made a fool of myself in Biology over speciation.
I have largely joined the other side on the Climate. It IS changing, and dangerously. The facts are the same as they always were about global temperatures–nothing of interest is happening worldwide. Monckton and our other heroes remain correct on those analyses. But something else IS going on.
My degrees are in agriculture, and I have a lifelong interest is that subject, and shelves of books on it. A few years ago, I was reading a Peter Bane book about Permaculture when my head spun around. He was talking about enhancing the soil to sequester carbon in the soil, and I realized that goes both ways. Since 1920, chemicals have been heavily involved in agriculture. At first, this was fertilizers, but today, most crops are sprayed before planting and several times during growth with poisons. This is crazy–we EAT that. It has gravely harmed our younger generations, and it has almost sterilized agricultural land.
Thankfully, this group is smart enough to grasp chemistry. When life forms die, the carbon compounds in them OXIDIZE to CO2 and H2O. Plants REDUCE them (basic meaning–reduces oxygen) to carbohydrates and fats, which have much less oxygen in them. This has no significant effect on atmospheric levels of oxygen because the carbon involved is too small in quantity or percentage (about .04% atm currently).
Despite coronapanic, the relentless killing of Terrestrial life forms continues. That is why the reductions in driving and fossil fuel use have produced no detectable drop in CO2.
It was shocking to me to realize that the carbon dioxide is not coming from fossils. Oh, SOME of it must–but that is taken up by plants fairly quickly.
This shock explains why the two sides in the climate debate are so stuck. Both are wrong about the same thing!
The alarmists are damaging the global economy by attacking our best energy sources. The economic loss is harmful to the environment by reducing our resources for dealing with problems. But these are the people eating organic foods and driving improvements in agriculture that will heal the water cycle and other troubles. These things must be done. Indeed, the poison-based monocropping which produces almost everything we eat is unsustainable–it cannot possibly continue. It is already failing–yields are going down on many farms despite ever-more desperate pesticides and herbicides.
The best introduction to food production is Michael Pollan’s book [i]The Omnivore’s Dilemma[/i]. That is written for laymen. After that, you can read Judith Schwartz’s books or [i]Restoration Agriculture[/i]
LadyLifeGrows,
You have a small bussiness and start the day with adding 100 dollar into the cash register. The rest of the day you have a lot of transactions buys and sells. At the end of the day you have 50 dollar more in your cash register than at the start.
That repeats every day for a month.
After a month, you make the balance and the cash register contains 1500 dollar more than at the beginning of the month. Do you have a good bussiness?
Of course, not at all, you have invested 3000 dollar and returned 1500 dollar, that is far from good.
The same with human emissions: we have added over 200 ppmv CO2 into the atmosphere and the atmospheric CO2 content increased with 120 ppmv. The only conclusion you can have is that humans are the cause of the increase…
Exactly, Engelbeen. We added that much CO2 by fossils. That is why alarmists are so stubborn.
And that is not the whole story. NASA’s satellites have shown increased leaf area as a result. Plant life should have turned all the extra CO2 into plants and life. (Animal that ate the plants, decay organisms, etc.) But energy is not the only way humans have added CO2 to the atmosphere.
We have shattered natural ecosystems by relentless poisoning, which includes fertilizers. We have trashed soil organic matter content. THAT is why CO2 levels stayed so high as we burned more fossils. This also damages water holding capacity, causes very high surface temperatures (e.g. 140F instead of 68F) which further killed bacteria. We spray our crops several times with -cides and then EAT the result. Then we wonder why chronic ailments are now the rule in CHILDREN, not just old geezers.
This real problem is much easier to solve than the warmist fantasy. Farmers may lose money for a while, but after 10 years with restorative agricultures, they are seeing profits. No outrageous government action is needed, no monster taxation. Just get out of the way and the changes needed pay for themselves.
This is the “reduced” smokescreen. They loudly declare that a reduction is not visible, and that it would take years of emission reduction for a “reduction” to show up.
So …………………………
How about a ding?
Just give me a tiny little blip.
A perturbance.
A miniscule deviation
…………. in the data.
Nothing.
CO2 Alarmists are caught on the horns of a dilemma.
Keeling is measuring normal CO2 slope, human contribution is so small it does not matter. Or …
Keeling slope is unstoppable, no matter how much the smashing down of fossil fuel use.
Not matter what, the conclusion is: let the coal burn, it has raised living standards to the sky over the past 100 years, and there is no danger from continuing this life-saving practice.
windlord-sun
Correction: human contribution is not too small to be measured, the difference in human contribution is too small to be measured…
And if we – completely unnecessary – would reduce our emissions to half of what they were, then the increase in the atmosphere would be stopped as emissions and sinks are equal…
As a non scientist it is interesting to read the comments from people who have a suitable background to debate this topic.
What confuses me is that while trying to determine whether human produced CO2 does or does not have a detectable affect on the level of this gas in the atmosphere where is the more important debate on whether/how this human contribution impacts the climate and if this is good or bad. That is surely the main issue?
You dont need to be a Rhodes scholar not even a dodgy climate scientist to work this out.
Firstly lets assume all historical and current data measurements are accurate for if we dont then we all have no idea what is going on and nothing to argue about, so here goes.
1, The ice core data clearly shows CO2 changes lag temp changes by 800 years
2, The MWP is dated 950 to 1250
Ergo we should expect to see a rise in CO2 levels from 1750 to 2050.
I invite everyone to google historical CO2 graphs which start around 1750 to see when the CO2 rise began, you can clearly see CO2 rise began prior to 1800.
Not so hard was it.
Impressive. How much warming occurred during the MWP? And this correlates with a predictable time and quantity of future CO2 increases? All based on ice core proxies? So 800 years after the LIA we should expect what? Unfortunately most of us won’t be around to see.
crakar24,
Not quite right…
Natural CO2 changes lag temperature changes with ~800 years but with not more than 8 ppmv/K
Even if we assume that the MWP was 1 K warmer that today, that is only 8 ppmv extra (in fact a little more).
The recent rise of 120 ppmv CO2 doesn’t lag temperature, it is far beyond what the change in solubility of CO2 in seawater shows at current temperatures (around 290 ppmv).
Regarding the many posts here debating the anthropogenic contribution since 1950 or indeed since pre- industrial times, here is the official position of mainstream scientists explained by Stefan Rahmstorf at Real Climate on 25 January 2018, “The Global CO2 rise: the facts, Exxon and the favourite denial tricks”.
Here are his points:
1.Since the beginning of industrialisation, the CO2 concentration has risen from 280 ppm ( the value of the previous millennia of the Holocene) to now 405 ppm ( presently ~ 418 ppm).
2. This increase by 45% (or 125 ppm) is completely caused by humans.
3.The CO2 concentration is thus now already higher than it has been for several million years.
4.The additional 125 ppm CO2 has a heating effect of 2 watts per square metre of earth surface, due to the well known greenhouse effect- enough to raise the global temperature by around 1 C until the present.
He then attacks the “myth” of denialists as again reported in Die Welt a German newspaper.
This myth is that human contribution to atmospheric CO2 is only 5%.
He follows with 5 Figures detailing (1) Mauna Loa,
(2) CO2 concentration during the Holocene ( from Scripps Institute,
(3) Scheme of the Global Carbon Cycle,
(4) CO2 budget for period 2007-2016,
(5) Annual émissions from fossil fuels,deforestation, the biosphere, atmosphere and ocean (“ the latter are negative meaning net uptake”).
He then states the climate sceptics have, as it were, confused turnover and profit, in economic terms.
He states didactically and confidently that “ if one takes in Figure (3)as the total emissions a natural part ( 60 GT C from soils+ 60 Gt C from land plants ) and the 7 Gt C fossil emissions as anthropogenic, the anthropogenic part is about 5% as stated by Die Welt.
The percentage is highly misleading however since it ignores that the land biosphere does not only release 120 Gt C but also absorbs 122 Gt C by photosynthesis which means that net 2 GtC is removed from the atmosphere.Likewise the Ocean removes around 2 Gt C……it becomes plain wrong when that 5% number is then understood.”
QED.
Or is it?
In discussing the Figure 5, annual emissions of Carbon etc. he shows a large grey shaded area described as “ Total estimated sources do not match total estimated sinks. This imbalance reflects the gap in our understanding.”
In Friedlingstein et al 2019 “ Global Carbon Budget 2019,” there also appears to be a significant degree of uncertainty of S Land , S Ocean etc in arriving at a reconciliation of the Carbon Budget.
In 2007, Tim Ball did an estimate of human production of CO 2 as being more than 4 times less than the combined error on the estimated production of CO2 from all other sources.
Even if human emissions were reduced to zero, the difference would be lost among other uncertainties in the global carbon budget.
While it may well be that annual human emissions are more than twice the total increase shown at Mauna Loa, the actions of the remainder of the climate system parts seem far from settled and this is before we examine the question of residence time.
Herbert,
Except for point 4 (which is way too high, 1 degr.C is only reached at 2xCO2, that is 560 ppmv), Rahmstorf is right, even if I don’t like the rest of his alarmism or that of his institute (PIK).
The uncertainty has zero influence on the net budget of all these natural in/out fluxes. We know with reasonable accuracy the heighth of human emissions (taxes!) and with high accuracy the increase of CO2 levels. The difference is what alle natural fluxes have done and that was a net sink for the past 60 years. No matter if that was more in oceans or more in vegetation…
The atmosphere is an absolutely lousy medium to hold CO2, which is why 98% of all CO2 is held in the 1.3 billion KM^3 of oceans as carbonic acid.. ye olde Henry’s Gas law…
Since the end of the Little Ice Age in 1850, there has been some ocean warming, resulting in some ocean CO2 outgassing, which contributed to a significant portion of the CO2 rise since 1850 (280ppm to 415ppm); scientists aren’t sure how much is due to outgassing, but they should before declaring Armageddon.
It’s ludicrous to say 100% of the atmospheric CO2 increase since 1850 was caused by manmade CO2 emissions, because much of it was simple CO2 ocean outgassing.
The atmosphere is also an absolutely lousy conductor heat, which is why 1000 TIMES more heat is stored in the oceans than in the atmosphere..
We should be ecstatic CO2 is recovering to healthier levels, and we should equally enjoy the 0.85C of beneficial warming recovery we’ve been blessed with since the end of the Little Ice Age, but alas, Leftists say these benefits will “kill us all in just 12 short years”….. Oh, my…
Samurai,
The solubility of CO2 in seawater is accurately known and also the change with temperature and the resulting equilibrium with the atmosphere. That changes with about 16 ppmv/K, that is all. Good for about 13 ppmv increase since the LIA. The rest is from us, humans…
If mans emissions are twice what Mauna Loa shows then there is a very big sink sucking up a lot of CO2.
That sink is adapted to sucking in large amounts of CO2, and while there is an excess, it will keep sucking it up at 2019 rates even if the excess drops by 8%.
Mauna Loa should have shown an 8% drop.
It didnt and that is a big problem for the suggestion that man produced all the CO2 increase since 1900.
Matthew Sykes,
It is a matter of accuracy and a matter of time.
The difference in human emissions is 0.2 ppmv/year
The accuracy of the measuremenents is 0,2 ppmv, so you need at least a year to measure the difference.
Then you have a lot of natural noise: +/- 1,5 ppmv from year to year (Pinatubo, El Niño), so you need several years to be sure of the change…
I have been thinking about this for a while now. The impact of a global lockdown and the associated reduction in fossil fuel emissions should be clearly visible by now. Not as a significant reduction of the levels of CO2 but as a slowing down of the increase. The derivative in other words. The difference may be small, but as many here have pointed out, the climate community claims to be able to measure with double digit precision elsewhere, so why not here? In any case, the global economy seems to be set for another couple of months on a diet, so early next year it should definitely be possible to measure an effect.
So, what if we do see a difference? Well, then I suppose that we have to admit to ourselves that anthropogenic emissions cause the increase of CO2 in the atmosphere. But, it doesn’t mean that CO2 causes global warming. That would remain an open issue.
If we measure no difference, the conclusions could be two: 1) The increase of CO2 in the atmosphere are all natural and humans’ use of fossil fuels plays a very limited role, or none whatsoever. 2) The reduction is too small to be measurable. This would indicate that the global temperature is way less sensitive to an increase in CO2 levels than what the climate research establishment believes.
In either of the above two cases, the CO2 theory falls.
Personally, I think the CO2 increase is due to outgassing of CO2 in the oceans. This is a non-linear, temperature dependent process. The warmer the water gets, the more it releases and the less it absorbs. Only a small increase in temperature will release large quantities of CO2. As many here have noted, there is a lot more CO2 in the oceans than in the atmosphere. This “theory” would also account for the many observations where the temperature increase seems to come before an increase of CO2.
Finally, most of you have probably already seen this but I attach a link anyway. Many years ago, I was puzzled by the “reconstruction” of historic CO2 values based on ice core measurements. Why on earth didn’t anyone do a science literature search? Surely, there had to be CO2 level measurements in the past. And oh yes, there were. Check it out. http://www.scmsa.eu/archives/ART_2006_Beck_CO2_report.pdf
Svan Olaf,
The current reduction is below the detection limit and far below the natural noise, but the natural noise is below the human emissions and these are twice the increase in the atmosphere.
Whatever you try, you can’t change the mass balance that shows that humans are the cause of the increase.
That there is much more CO2 in the oceans than in the atmosphere is of zero interest, all what matters is the equilibrium between the CO2 pressure in the atmosphere and in the ocean suface. At the current average ocean surface temperature, that is at 290 ppmv in the atmosphere. Not 415 ppmv.
I have had years of discussion with the late Ernst Beck. I do admire the enormous amount of work, but he ignored the problems with the historic measurements, not the accuracy (+/- 10 ppmv), but where was measured: midst towns, woods, over, inbetween and under growing crops,… See:
http://www.ferdinand-engelbeen.be/klimaat/beck_data.html
Sorry Sven Olof for misspelling your names, it is getting too late here, need some sleep…
Interesting that the historic measurements are criticized as to their locations. Especially since the most prominent of the modern measurements takes place on top of an active volcano.
That’s a red herring. The conditions for measurements to be considered valid at Mauna Loa are strict. Wind comes from the sea and rises through the slopes of the volcano. They are measuring the CO2 level over the ocean in the middle of the Pacific, not what comes out of the volcano. I did research that issue instead of just repeating that wrong meme.
There is nothing wrong with Mauna Loa measurements. They are highly precise and repeated at many locations over the world.
I was hoping that you would understand the irony. However, on a more serious note, I find it intriguing that both you and Ferdinand Engelbeen seem to be convinced that the historic measurements were done by scientists who produced sub-standard quality measurements and were unable to detect flaws, such as the impact of certain locations, in their results. At the same time you seem to accept the reconstruction of historic CO2 levels, based on ice core analyses.
So, in the left corner we have the 19th or 20th century chemistry scientist, going about his business and in most cases being really careful with his measurements, happily unaware of the impact such measurements could have, politically. In the right corner, we have a climate doomsday scientist whose purpose in life is to scare people of the pending climate disaster and persuading them to buy a Tesla. He is thawing small samples of ice and measuring a tiny bit of CO2, then trying to correlate that particular piece of ice to a certain year and inputing the data into a model on his MacBook.
I know where my money would go. Do you?
I know w
Sven Olof Andersson Hederoth,
I never said or implied that the historical measurements were done by people who were not skilfull. The problem was not the people or to a lesser extent the method (+/- 10 ppmv), the problem was where the samples were taken.
I had many discussions with the late Ernst Beck about the old data and proposed to reject all data that were taken over land, as these are unreliable. He refused that, as the main series that caused the 1942 “peak” were taken at the edge of a forest (Giessen, Germany). That is what Keeling had seen in one of his first ever CO2 measurements over a full day in Big Sur state park: an enormous diurnal CO2 difference between day and night. Fortunately he could measure the the 13C/12C ratio too and did know that vegetation was to blame.
That was the main reason that he started at the South Pole and Mauna Loa, far away of any vegetation.
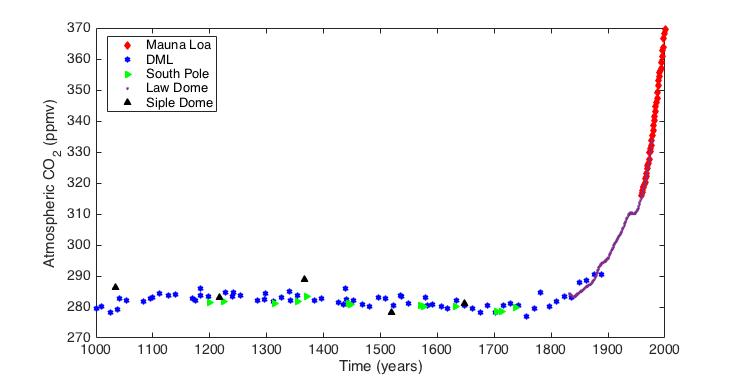
If you take only the historical data taken on board of seaships or coastal with wind from the seaside, then these are all around the CO2 levels that the ice cores show. Unfortunately there are no such data for the period 1935-1950, so no comparison is possible.
About the accuracy of ice core measurements, That question was definitely answered by drilling 3 ice cores at Law Dome which has a very high precipitation rate (1.2 meter ice equivalent per year). Etheridge e.a. 1996 measured CO2 from the atmosphere to closing depth in firn and ice with the same equipment (GC) and found a difference of only 7 ppmv between atmosphere and closing depth (that is a time difference of about 10 year for the measurements at the South Pole. There were no differences between still open pores and already closed air bubbles at the same depth.
The exact age of the surrounding ice was easy to detect by counting the layers. That made a comparison of the CO2 levels between ice and atmosphere quite easy: an overlap of 20 years (1960-1980) between ice core CO2 and CO2 measurements at the South Pole:
http://www.ferdinand-engelbeen.be/klimaat/klim_img/law_dome_sp_co2.jpg
No need for “models”, just measurements.
Of course, if the layers are much smaller, as is the case for Vostok or Dome C then the exact age of gas and ice need to be calculated with a model. That influences the timing and the resolution, but not the measurements themselves.
Sven,
Thank you for that excellent link.
I had heard of E.G.Beck but had not read the 2006 paper setting out the long history of recording CO2 levels stretching back to the early 19th Century.
In November 2008, Dr. Tim Ball wrote a paper, “Measurement of pre-industrial CO2 levels”.
Here is the abstract-
“A major part of the focus on human produced CO2 as the cause of global warming is the claimed increase in atmospheric levels from pre-industrial CO2 to the present. Ice cores provide the historic record and data collected at Mauna Loa the recent record.Both records are drastically modified to produce a smooth apparently continuous curve.This was apparently necessary to confirm the evidence from many 19th Century measures that pre-industrial levels were approximately 270 ppm. These records were adjusted and selected but a rigorous study of the data confirms that CO2 levels are generally higher and vary considerably and annually.”
Beck indicates that the CO2 readings over the 19th and early 20th Centuries moved about considerably and were certainly not the linear line that Keeling shows at Mauna Loa from 1959.
Herbert,
Thanks for your comment. I believe we should not ignore the work of previous generations of scientists. Just because they didn’t have computers, they were not stupid. In many respects, those scientists were equal or even superior to today’s, BECAUSE they didn’t have access to modern technology. They knew that if they hadn’t thought through the experiment properly and really considered the mechanics of the calculations, the faced the risk of having done a lot of time-consuming work in vain.
To me, the Beck report is as close to a “smoking gun” as we will ever get with regards to historic CO2 levels. It proves that atmospheric CO2 fluctuates more than what some want to believe.
Herbert,
As already said to Sven Olof, the problem was not the skill or the measurements (although +/- 10 ppmv was not even enough to detect the seasonal changes), the problem was where was measured. Callendar used several a-priory criteria to include or exclude the historical data. Beck used none.
One can discuss the criteria of Callendar (like within +/- 10% of the bulk of the data, not taken for agricultural purposes,…) but Beck used all data: the good, the bad and the ugly.
After a lot of debate, he removed the ugly data, but still included the bad data.
Like a whole series of the ’30’s with a German research vessel that made a lot of sampling of seawater, including the equilibrium CO2 with the atmosphere at different depths. According to Beck, the samples of 0 meter represented the CO2 levels of the atmosphere, which is completely wrong, as the pCO2 of seawater today changes from 750 μatm to 150 μatm, while the atmosphere is 410-430 μatm everywhere over the oceans. He never admitted that this was wrong.
Why do you think that the extreme large changes between individual years of hundreds of ppmv suddenly disappeared when Keeling started to measure on the South Pole and Mauna Loa and nowadays at over 70 places deemed “background”?
For the 62 year period 29 March 1958 to 24 May 2020, the linear rate of increase of CO2 at the Mauna Loa Observatory was 1.575 ppm per annum. Through to 02 August 2020, the rate had increased to 1.578 ppm pa and through to 13 September 2020, the rate was higher again at 1.58 ppm pa as the CO2 concentration continues to increase at an ever increasing rate.
The earliest seasonal maximum was 317.69 ppm on 12 April 1958. The latest seasonal maximum was 417.49 ppm on 23 May 2020. The concentration is currently in its annual seasonal decline being 411.17 on 19 September 2020.
There is no sign of any anthropogenic effect but there are distinct inflections in the rate of increase of atmospheric CO2 corresponding to the time of the volcanic eruptions at Mount Agung, Bali, Indonesia, 17 March and 16 May, 1963, and Mount Pinatubo, Philippines, 12 June 1991. All of puny mankinds’ efforts are nothing compared to a single volcanic eruption.
The annual rate of change of CO2 concentration reflects the Oceanic Niño 3.4 Index showing that climate change causes CO2 change not the opposite as claimed by the UN IPCC.
Furthermore the autocorrelation function for the annual rate of change of CO2 showed a clear repeated pattern with a period of 1313 days, the average period for the El Niño event. This is confirmed by the Fourier Transform amplitude spectrum which has the greatest amplitude at a period of 1308 days, again the El Niño event.
Remarkably the spectrum shows maxima at 27.17 days, the Moon’s draconic period, and at 29.42 days, the Moon’s synodic period showing that the rate of generation of CO2 is sensitive to the small changes in temperature caused by the Moon passing between the Sun and the Earth.
Climate scientists and the UN IPCC have made two fatal mistakes. Firstly they used the Stefan-Boltzmann equation in calculating temperatures and energy flows. This equation only applies to a steady state situation of a perfectly smooth surface in thermal equilibrium, neither cooling nor heating. The Earth’s surface and atmosphere is never in thermal equilibrium. For example, at the Equator the spot receiving the full Sun’s radiation is moving along the Earth’s circumference at 1674 km/hr so it is impossible for the surface to reach the temperature predicted by the inappropriate Stefan-Boltzmann equation.
Secondly we are told that CO2 causes global warming. However we are not told that there are at least 300 times as many photons in the 15 micron CO2 absorption band as in the rest of the bands combined so there is a better than 300 to 1 chance that a CO2 molecule will absorb and, perhaps, re-radiate a photon from the 15 micron band. 15 microns is the peak radiation from a source at -80 degrees Celsius. Radiation from such a source will never increase the temperature of anything on the Earth’s surface or in the atmosphere.
Bevan,
Did you realize that the rate of change of the CO2 increase dropped after the Pinatubo eruption?
That means that what the Pinatubo emitted as CO2 was completely dwarfed by the extra CO2 uptake by oceans and vegetation (the latter from the extra photosynthesis due to the light scattering from the volcanic dust_…
Yes Ferdinand, that is what I alluded to in my third paragraph. A slightly lesser effect is seen for the Mt. Agung eruption, perhaps reduced because Mt. Agung was 9598 km while Mt. Pinatubo was 8859 km distant from the Mauna Loa Observatory.
I suspect that the temperature drop resulting from the volcanic dust may have increased the solubility of the CO2 and, perhaps, rain associated with the cloud may have washed the CO2 out of the atmosphere, a common phenomenon that produces weakly acidic rain.
I fail to see how the scattering of sunlight would cause extra photosynthesis as the latter is evident in the morning as the Sun rises and in Spring as the Sun’s radiance increases in intensity. An interesting example of the relationship between the Sun’s irradiance, photosynthesis and temperature may be seen on my web page describing my analysis of the Barrow, Alaska, Observatory data (click on my name at the top of the article to go to my web site).
Bevan,
The increased photosynthesis was mainly in the tropical forests. If there is much scattering, some leaves that are normally part of the day in the shadow of other leaves then receive more sunlight from a different angle. That was measured as a strong dent in the δ13C drop caused by the use of fossil fuels. That even surpassed the extra uptake by the ocean surface due to colder temperatures.
The last sentence on your interesting Barrow analysis is not right:
“Presumably the ash cloud from the eruption reduces the Sun’s radiation to a significant degree
If that was true, that would give an extra increase of CO2 not a drop. Maybe the same point as above: extra uptake by colder temperatures and more photosynthesis?
Thank You Ferdinand,
For Your interest. You can see more about the Mt Pinatubo eruption in my description of the Mauna Loa weekly data on my web site.
I think that there are two actions resulting from the Sun’s irradiance of the Earth. One is photosynthesis dominated by phytoplankton which consumes CO2 in the mornings and Spring time. The other is the decay of organic matter by yeasts and such like, driven by the temperature which determines the rate of generation of atmospheric CO2.
The combination of the two effects draws carbon from the soil and rocks with seawater being a go-between. The increase in CO2 concentration may cease when the temperature falls to a critical low, possibly zero degrees Celsius, when water freezes and is no longer available to organic processes – nothing whatsoever to do with mankind.
From the article: “Based on current data measured in the energy, industry, and mobility sectors, restrictions of social life during the corona pandemic can be predicted to lead to a reduction of worldwide carbon dioxide emissions by up to eight percent in 2020. According to the Intergovernmental Panel on Climate Change (IPCC), cumulative reductions of about this magnitude would be required every year to reach the goals of the Paris Agreement by 2030.”
Meanwhile, the Chicoms are increasing their CO2 production by leaps and bounds completely nullifying any and all efforts at CO2 reduction by Western nations.
Just a little bit ridiculous, don’t you think?
We have some really dumb people in high offices.
High-tech infrared spectrometers are applied, which use the sun as a light source.
But hang on.
There’s no infrared in sunlight – that’s what we’re taught at CO2 Sunday school.
Only shortwave radiation comes from the sun.
IR only comes from the warmed earth, to be bounced back down by CO2.
This I know. For the IPCC tells me so.
How can there be IR in sunlight?
If there is, then at the top of atmosphere CO2 will re-radiate IR out to space, DECREASING TSI.
There’s a Caucasian in the woodpile.
Phil,
There is relative much IR in a band near visible light, two bands where CO2 is active with one overlapped by water vapor:
https://en.wikipedia.org/wiki/Absorption_band
The remaining CO2 band has very low energy of the sun to react with…
CO2 residence time in the atmosphere is 16 years, as measured by bomb test fallout clearence.
Arguments to eel out of this by making residence longer run away to intractable (and irrefutable) complexity and are pure BS.
Just like the CO2 supposed warming effect.
IR photons from earth’s surface are extincted within a mile or so of the surface.
So changing CO2 concentration will make no difference.
But arguments to eel out of this by talking about peak shoulders etc., also run away to intractable (and irrefutable) complexity and are thus also utter BS.
Phil,
The speed of a reduction for any 14CO2 excess is way higher than for an excess 12CO2 injection.
The problem is that what goes into the polar deep waters is the isotopic composition of today, what comes out of the equatorial upwelling is the isotopic composition of ~1000 years ago.
For 1960, at the heighth of the bomb spike the returns were as follows:
97.5% of all 12CO2 returned the same year
45% of all 14CO2 returned the same year.
That makes that the removal rate for 14CO2 is about 3 times faster than for 12CO2
Ferdinand
Thanks. What is the reason for the difference in clearance rate between 14 and 12. Just mass?
The difference in mass makes a small difference in isotopic composition (14C/12C ratio) at the air-water and water-air border, because the heavier one is always a little slower than the light ones. But that is a matter of tenths of a percent.
The main problem is the very long time that water with the extra bomb 14CO2 needs to return, which is about 1000 years (if not completely diluted). Thus what returns today is water with the 14C/12C ratio of ~1000 years ago long before the atomic bomb experiments. That is a lot of difference with what returns as 12CO2.
It’s actually embarassing that the covid19 shut-down has had no measurable effect on atmospheric CO2.
Hard to hear, but it is what it is.
Agree.
The only counter I can imagine is “Wait for it.”
In other words, ‘It will take “a while” for the very large reduction in emission to show up as even the most subtle blip at Moana Loa.’
Really?
windlord-sun
Indeed the absence of a lockdown effect on CO2 will be used as an argument for a long residence time.
Because in these people’s minds, cause and effect can be inverted at will, for no reason. As can the arrow of time.
None was expected, so no embarrashment. The decrease in emissions is very small (8 %, 0.4 ppm), the yearly noise in atmospheric CO2 is very high, human emissions are a small part of yearly fluxes, and year to year variations due to temperature are several times higher than variations in human emissions.
You just can’t measure a small signal when there is a lot of noise. About 5 years would be necessary for the signal to increase and the noise to decrease to the point that we see a measurable effect of the reduction in emissions.
The idea of there being an equilibrium level of atmospheric CO2 back in the 1800’s that could’ve only been perturbed by man-made emissions is not supported by the evidence, and therefore Ferdinand’s calculations and many comments asserting how much man-made emissions have changed ML CO2 are merely fanciful ungrounded speculations.
There can’t be a fixed outgassing equilibrium over time as the ocean temperature rise and falls through the solubility range of CO2 all the time in many tropical locations while not so much in others. Henry’s Law is a fixed law, a physical reality for the ocean, and as the ocean warmed, the ratio of the area of warm enough waters for outgassing to the area of colder CO2 sinking waters changed over time, no matter what threshold one would calculate, so by definition there couldn’t possibly have been any physical equilibrium for atmospheric CO2 wrt the ocean, irrespective of MME.
Therefore calculations based on this non-existent equilibrium are invalid, so F. Engelbeen is wrong in his estimates of CO2 origins because he discounts Henry’s Law and doesn’t apply it correctly. Futhermore he has provided no information as to how the ocean in various places outgasses or sinks, his discussions are general and vague, with the only value given an amount of CO2 in ppmv, not wrt ocean temperature or location, indicating an unformed conceptualization of outgassing, without detail, specificity. Without that information he is not in a position to estimate how the changes in SST could have affected CO2 outgassing at all, nor is he in a position whatsoever therefore to claim there is even a possibility of such an equilibrium he claims MME upset and overwhelmed.
The whole idea of a static CO2 equilibrium is therefore false, but some may spend the rest of their lives believing it.
It just so happens that I developed the right principles empirically, starting first with confirming Henry’s Law using Nino3 and ML CO2, see inset #8, finding the threshold first, then I applied that knowledge by finding out how the ocean changed since the 1850s wrt this threshold, with the warming area expanding in size with time, see plots #1-5 below, which demonstrates the impossibility of a static ocean and CO2 equilibrium.
The CO2 residence time is short as evidenced by the occasion of peak tropical forest uptake in the 1990s occurring simultaneously with peak ML CO2 years (CO2 on a detrended annualized cumulative basis).
The DIC (dissolved inorganic carbon) is driving the other part of the pCO2 equation and it has an interesting history too that is temperature and solar activity related.
You are leading yourself to deception. An equilibrium is not needed and everybody agrees nature is never in equilibrium. It is just a useful abstraction. In any case before fossil fuel emissions conditions weren’t far from equilibrium as demonstrated by the small changes in CO2 levels prior to industrialization.
Since then it becomes evident that we are becoming farther and farther from equilibrium. Why? If the CO2 increase is due to warming then the most extreme of the warmists must be correct and we must be suffering the worst warming comparable only to the last deglaciation. Such a lack of self-consistency in people’s beliefs is typical of religions. A modest warming can only produce a modest increase in CO2.
And it just so happens that the rest of the world scientists including all prominent scientists skeptic of the climate crisis are wrong on something so easy and basic and you are right. Henry’s law, Raoult’s law, and Le Chatelier’s principle were all worked out by the scientists of the 19th century. Many generations of scientists have passed without anyone knowing how to properly apply it to the ocean’s CO2 until Bob Weber came along and “developed the right principles empirically”.
You should dedicate 1/10 of your criticism to others to yourself. Self-criticism is absolutely essential. When you are working with something so basic, so well-known, to think that you have found something that proves all the scientists of the past 150 years wrong should give you pause. The chances you are suffering from a severe case of Dunning-Kruger effect are staggering.
The equilibrium concept is not a useful idea, despite your endless faith.
The chances you are suffering from a severe case of Dunning-Kruger effect are staggering.
The chances are very good that this statement applies to yourself. I successfully confirmed Henry’s Law and applied it, and no one else has done that. You can’t even find an independent confirmation and application of Henry’s Law using ocean data from someone else.
Many generations of scientists have passed without anyone knowing how to properly apply it to the ocean’s CO2 until Bob Weber came along and “developed the right principles empirically”.
That’s right Javier, I did, and nothing you have said here matters at all. The real bottom line here is you can’t think through these problems and as such you are an impediment to everyone else’s progress.
“That’s right Javier… The real bottom line here is you can’t think through these problems and as such you are an impediment to everyone else’s progress.”
Bravo. Perhaps the most insightful remark in this entire lengthy thread. The relentless marketing of carbon propaganda by Ferdinand Engelbeen and “Javier” (in which they demand the last word) is not surprising. What is surprising is that people allow themselves to remain engaged in it – which is the objective.
All of their fuzzy arguments cannot prove the UN’s critical assumption: that increasing CO2 in air is caused by human emissions. But a single insight is sufficient to disprove it. In fact, that insight has now been found. Harde, Berry, and Salby have, through half a dozen independent analyses, demonstrated that human emissions are much too small to account for the observed increase of CO2. All of the other arguments in the relentless marketing of UN ideology are academic.
Alex,
The difference between you and me is that I try to be an objective observer and let the observations guide the science.
It is not because the warmists say something that it MUST be wrong. Just look at the observations and if these show what they said, then they are right, even if you and I don’t like the result.
If you think, like Bob Weber does, that a short time correlation between temperature and CO2 rate of change “proves” that the long term change in CO2 is not caused by humans then he and you only show that you don’t have the slightest insight in process dynamics.
If all contrary evidence then is ignored, you are not better than the alarmists who ignore all evidence contrary to their believes…
Javier
I’m not sure how accurate or precise the CO2 record is. From ice cores there are serious questions of gross smoothing at best abd possibly alteration, with air not being isolated.
Plant stomatal data paint a very different picture compared to ice cores. They indicate a much wider amplitude of variation of atmospheric CO2 concentration. I don’t doubt that human activity has increased CO2 in air in the last century (but this is more beneficial than harmful). But I never believe assumptions of Edenic stasis in any past climate parameter. That’s just bad data.
Phil,
There is a large difference between ice core CO2 and stomata CO2:
Ice core CO2 are direct measurements of CO2 in air of the bubbles as used in direct measurments of ambient air (GC, NDIR, mass spectrometer). With one huge drawback: that is an average of 10 years to 600 years, depending of the local snow accumulation rate, thus the time needed to close the bubbles.
Migration of CO2/air in ice was theoretically calculated (based on measurements at ice with a melt layer) is minimal and only broadens the resolution with about 10% (20 to 22 years) after 70.000 years to a doubling (20 to 40 years) at full depth (~150.000 years).
Stomata (index) data are proxies with a better resolution, which are dependent of CO2 levels of the previous growing season. But influenced by other points like drought too. And one enormous drawback: they grow on land, where there is a local variable CO2 level bias above “background”. To compensate for that, stomata data are calibrated over the past century against… ice cores, firn and direct measurements.
The main problem is that nobody knows how the local bias changed over time as there were land use changes in the main wind direction, or even that the main wind direction changed in specific periods (MWP-LIA).
Anyway, stomata data may give a better resolution and therefore larger amplitudes, but that are local/regional data, not global and if the average of the stomata data differs from the ice core data over the same time period (larger than the ice core resolution), the stomata data need to be recalibrated for that period.
Ferdinand
Thanks again.
Those uncertainties and other ecosystem dependencies that affect stomata, no doubt affect all biological proxies such as those used as temperature proxies (pollen, midges etc.) Someone needs to explain that to the likes of Marcott, Shakun et al.
Phil, agreed… Especially tree ring widths/density which reflect temperature during the growing saison, but also drought/rain and the availability of fertilizers (CO2…), minerals,…
Treemomethers are not that good as thermometers…
Bob,
Until recently, there was a near fixed dynamic equilibrium between glacial temperatures in ice cores and CO2 of about 8 ppmv/K. Here for Vostok over the past 420.000 years. Dome C recently expanded that to 800.000 years:
http://www.ferdinand-engelbeen.be/klimaat/klim_img/Vostok_trends.gif
The discrepancy between temperature and CO2 around the trendline is mostly due to the huge lag with which CO2 follows temperature changes.
The residence time of any excess CO2 – whatever its origin – is about 51 years and thus is not short. That is the influence of the increased CO2 pressure in the atmosphere on the uptake. Nothing to do with shorter responses like El Niño or Pinatubo, which are temperature dependent.
And please, if I give you a reference to plots of 6 stations over the world which show an increase in DIC over time, together with an increase in CO2 in the atmosphere, where does the increase of DIC in the ocean surface comes from? If the ocean surface was a source of CO2, that should give a decrease in DIC…
That
What happens is people mis-attribute the DIC increase as being mostly from MME. The increase in DIC began long before MME as a result of more favorable biological growing conditions for corals and their food chain as a result of irradiance-driven warmer waters over time.
The ocean DIC/pCO2 naturally increases when it warms via more productive marine biology. High irradiance and hot spots also breaks down coral skeletons that recycle into more DIC. There’s no sense in trying to attribute the increase in DIC to just MME.
Bob,
What I don”t understand is that you simply ignore all evidence that contradicts your theory.
If the food chain increases, including the growth of carbonate shell plankton (coccoliths) and extra growth of the reefs, they use bicarbonates from the surrounding waters, thus DIC should decrease NOT increase. Higher temperatures do increase pCO2, but that only matters if the pCO2(aq) gets higher than in the atmosphere and then CO2 is lost from the ocean surface waters into the atmosphere. Again a decrease of DIC!
But we measure an increase of DIC! Exact the opposite of your theory and in exact ratio to the increase of CO2 in the atmosphere. That are the measured facts.
If the facts contradict the theory, the theory is wrong.
Thus sorry, all evidence points to humans as cause of the increase of CO2 in the atmosphere. That means that the warmists on this point (and this point only…) are right, even if you and I don’t like that…
Has anyone simply deducted the yearly estimated human CO2 emissions from the years measured total CO2 emissions?
Since humans yearly CO2 emissions doesn’t account for the total PPM yearly increase, thus humans are NOT causing the entire increase.
It appears to me that Nature IS adding to the yearly CO2 growth.
Nature IS subtracting to the yearly CO2 growth. Don’t make the mistake of confounding human emissions with natural fluxes. Natural fluxes just move carbon between the three highly mobile stores (shallow ocean, atmosphere and biosphere) in a temperature-dependent manner. They are very large but over several years they average to a small negative, about half of what we emit. Our emissions are much smaller and not temperature dependent, but they are cumulative and over several years they constitute double of the net fluxes resulting in the increase in atmospheric levels.
Overall I think that attempts at carbon accountancy are a road to nowhere. We have little clue how much is where and where it is going. To find what is happening to CO2 and carbon one must instead make intelligent use of observational data, involving as few inductive assumptions as possible. I’m OK with CO2 increase being either anthropogenic, or not, or not much. One must simply follow where the data leads (models are not data).
For instance the CO2 observing satellites showed that often forests in Africa and South America emit more CO2 than the biggest conurbations in USA and China. Waterlogged land or forest emits more CO2 than cities. What happened to that observation. Too hot to handle? Climate scientists don’t seem to be talking much about the OCO satellites anymore.
And zero change to atmospheric CO2 after the biggest reduction in CO2 emissions in history, from the pandemic, is awkward to say the least. Models can be massaged to accommodate that, by positing an ever longer CO2 residence time. But that’s pure fiction as we all know.
The earth is greening. In a rational world this fact would be celebrated. But of course it’s not being. In the next few decades the Sahara desert will start greening over to an extent that will be hard to hide or ignore (it’s starting already). Land and ocean primary productivity are increasing at a rate that is truly unprecedented. This – almost uniquely in climate science – is a justified use of the word “unprecedented”. The media and academia focus on projected doom which remains by and large confined to computer models while in the real world ecosystems increase in vitality.
Climate science is “catas-trophic” in the sense that it feeds exclusively on the perceived approach of catastrophe. For them news can only be bad. Looking at life they see only death, since it is in reality a death cult.
Any discussion about models purporting to explain the CO2 balance must also address the 13CO2/12CO2 (δ13C) balance, since that provides a critical constraint on the models. The most recent attempt to establish a model of the CO2 and δ13C balance that I have seen was Keeling et al (2017): https://www.pnas.org/content/114/39/10361 (this site also provides a link to supporting information for the paper). The authors have used a very comprehensive (complex) model which, when they updated it with more recent observations, led to the comment:
“Here, we update the longest direct time series for δ13C of CO2, starting in 1978, from the flask program at the Scripps Institution of Oceanography. Rather than resolving carbon sinks, we use data/model comparison to show that there must exist an additional process, previously neglected, that reduces the atmospheric 13C-Suess effect.” (emphasis added)
So, once more we see the settled science (and this was only three years ago). It may not seem too surprising that more data leads to a need for a more complicated model, but the problem is that the actual observed trend in δ13C decline (which is linear when plotted against 1/CO2) did not change as a consequence of the new data!
My model (ha ha) is that the additional atmospheric CO2 since 1765 (where their model runs were initiated) has had, on average, a constant net value of -13 per mil. The average needs to be derived over periods of several years in order to balance fluctuations due to ENSO variations and major volcanic eruptions such as Pinatubo. This value of -13 per mil is derived from a lot more data than I am using here, but the following should illustrate the point.
Mathematically, this relationship is very simple to show by using the mass balance equation for 13C. Keeling et al adopt 278 ppm and -6.4 per mil in 1765 for atmospheric CO2 and δ13C respectively. Referring to their Table S3 (supporting information) they show that observed δ13C in January 1980 was -7.51 per mil and had declined to -8.37 per mil by December 2013 (they average the Mauna Loa and South Pole data). On the other hand, their model had predicted values of around -7.75 per mil and -8.75 per mil respectively (based on Figure 1A in the paper). Atmospheric CO2 levels at these two times were, based on Scripps CO2 program (https://scrippsco2.ucsd.edu/), 337 ppm and 396 ppm.
The calculation is based on CO2 level multiplied by 13C/12C ratio to give (approximately) the 13C amount. The use of δ13C as a proxy for 13C/12C has no impact at all since all values are referenced to a single standard and the use of 13C/12C instead of 13C/(13C+12C) leads to a negligible error due to 12C being 99% of 13C+12C. These two points are easily confirmed, plus Keeling et al use the latter approximation themselves.
My predicted δ13C value in January 1980 (based on constant δ13C since 1765):
((-6.4*278) + (-13*(337-278)))/337 = -7.56 per mil. This compares with observed -7.51 per mil and the unadjusted Keeling et al prediction of -7.75 per mil.
My predicted δ13C value in December 2013 (based on constant δ13C since 1765):
((-6.4*278) + (-13*(396-278)))/396 = -8.37 per mil. This compares with observed -8.37 per mil and the unadjusted Keeling et al prediction of -8.75 per mil.
Just to check how well my “model” is still behaving, the most recent δ13C values at Scripps are for October 2019 and are -8.52 with CO2 at 410 ppm.
My prediction: ((-6.4*278) + (-13*(410-278)))/410 = -8.52 per mil.
Of course, knowing that all of the CO2 that has been added to the atmosphere since 1765 has had the same 13C/12C ratio (on average and obviously a net effect) does not tell us exactly which sink/source model is correct, but it certainly provides a key constraint. For those who are not familiar with δ13C values, the flux from fossil fuels is generally estimated to be around -28 per mil. To see how Keeling et al get that to match observations, see their Table S5 (supporting information).
Jim,
Your “constant” δ13C level of -13 per mil is based on a relative continuous increasing addition of fossil fuel CO2. I wonder if you will find the same ratio now that the increase is less than normal…
Hi Ferdinand,
My constant δ13C level of -13 per mil is not based on anything other than the observations. I make no assumptions as to the possible sources or sinks. It is a simple demonstrable fact, based solely on the available data.
As I did mention, the most recent δ13C data is for October 2019 so no, it is not possible as yet to see or infer any change that might reflect the reduced estimate of emissions. Something to watch for but, like CO2 levels, I doubt anything will be discernible.
What concerns me most is the climate science approach of generating a model that appears to explain what we see (and can measure), finding that it doesn’t actually fit the observations, then modifying it with a new hitherto unknown (or unproven) variation that fixes the failure to match the data, then considering that as evidence they now understand what is going on. They don’t.
Jim,
Agreed that they don’t understand everything that happens in nature, but still disagree with you that the “source” of extra CO2 has a constant δ13C level of -13 per mil. In my opinion still just coincidence because human emissions are constantly increasing. The current dip in emissions still may be too small to be detectable in the δ13C level…
Ferdinand,
OK, in that case you need to accept three coincidences. First, the Keeling plot of the observations (I prefer to use the South Pole data because the adjustment by Scripps to remove the annual cycle is minimal):
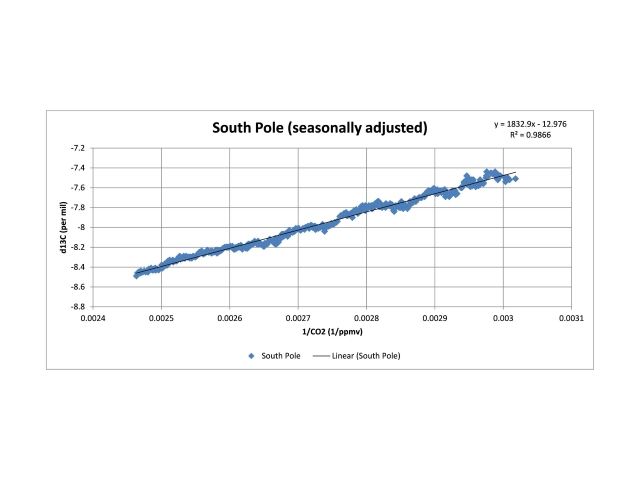
Average δ13C content of -13.0 per mil, R2 0.99.
Second, the Law Dome data as shown in Figure 1 here:
http://www.biogeosciences.net/3/539/2006/bg-3-539-2006.pdf
Average δ13C content of -13.1 per mil, R2 0.96.
Third, as per a plot that you frequently show yourself:

You can only match the CO2 with the δ13C observed trends by assuming a δ13C of the incremental CO2 of -13 per mil (relationship between far left and right hand graph scales, noting the use of 1/CO2, reflecting (again) the validity of the relationship that underpins the Keeling plot).
To be clear, I am referring to the -13 per mil as (i) average and (ii) net, the latter point being that it includes all sources and sinks of CO2, plus interchanges between them (disequilibrium effects). The fact that the average net value is -13 per mil is actually marginally less important than the fact that it has not changed since 1765, the reason being that it is a lot harder to develop a model that matches that consistency over time (as Keeling et al discovered).
For a long time, I used to ask people who were convinced that IPCC and other climate alarmists are right, what could make them sceptical or even realize that they’d been bamboozled. Most people would just stare at me with a kind of goldfish look on their faces. The others would ask me what would make me change my mind. One of my criteria was that someone should make a really big experiment, verifying the theory in Earth-like conditions. This would be the mother of all experiment rigs, but I figure it could be done.
Now, we’ve had that experiment. A transient in the release of human CO2. If those climate scientists are worth their salt, some kind of conclusion must come out of it. Just saying that it is too little to be noticed is just ridiculous and only tells me that they are not honest. If it is too little, why would we want to further reduce CO2 emissions and strangle the economy if it achieves nothing?
Sven Olof Andersson Hederoth,
You can’t show or prove anything that is smaller than the detection limit of your measurement method and way smaller than the natural noise in the real world.
If we could – without destroying the economy – halve the emissions, then there would be a clear response within a year or so: at that point human emisisons and net sink rate are equal and the CO2 increase in average would be zero. That would be detectable on short notice, even within the huge natural variability.
Better for the ecomomy would be the experiment the other way out: substantially increase the CO2 output (1.5-2 times current) and look what happens…
Pure IPCC dreaming here; human emissions increase threefold in 2002 and fell as much in 2009; neither of which changes were recorded in the atmospheric CO2 record