Guest post by David Archibald
News has come from the Duluth office of the National Weather Service that both International Falls & Hibbing broke their records for low temperatures on the morning of September 17. The Falls got to 23°, breaking the old record of 24° set in 1959, and Hibbing to 24°. We shouldn’t be surprised because the Canadian prairies have been cooling for decades now. Also, President Trump, while in California on September 14, had predicted cooling, saying “It’ll start getting cooler. You just watch.” Three days later a new cold record is set at the iconic International Falls weather station. Either President Trump actually has some control of the weather or he is getting very good advice.
The paper on the Canadian prairies by Garnett, Khandekar and Kauer notes that “During the grain growing months of May-July, the mean temperature on the Canadian prairies has cooled down by 2ºC in the last 30 years. The cooling appears to be most certainly linked to diminishing solar activity” and “This cooling has led to a reduction in Growing Degree Days (GDDs) and has also impacted the precipitation pattern.” The paper includes this figure showing the multi-decadal decline in GDDs:

The Canadian prairies grow about 75 million tonnes per year of grains and pulses so the temperature downtrend evident is concerning with respect to the ability of the world to feed itself. The fact that the reduction of solar activity over that period is likely to have been the cause of the cooling is supported by the following figure, produced from data in Table 4 of the paper:
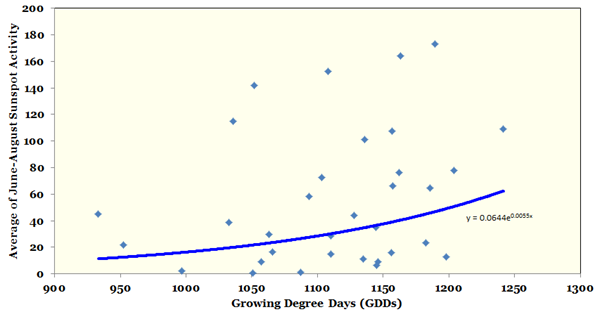
Over the period 1985 to 2019, the figure above shows the correlation between sunspot activity and GDDs on the Canadian prairies. The blue line is the line of best fit.
While the Canadian prairies have been cooling for decades, the Modern Warm Period only ended 14 years ago as shown by the following graph of the cumulative aa Index against the long term average:
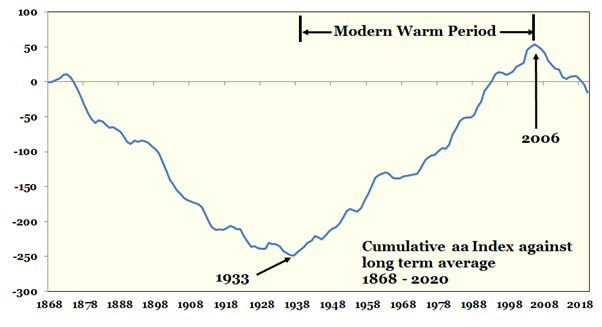
While sunspots are visual manifestations of solar activity, it has been suggested that the Sun’s magnetic activity is the biggest factor in controlling climate on Earth. The figure above suggests that trends in solar activity are about 70 years long. If so, the Earth has just started into a long term cooling trend.
David Archibald is the author of The Anticancer Garden in Australia
My comment on figure 2: “The blue line is the line of best fit”: Looks rather like a sawed-off shotgun blast with a curve drawn through it. Calling such a graph a “best fit” is quite a feat in itself…
Eric, my initial reaction also. Following your comment I enlarged the figure 2 and looked at the distribution more closely and agree with author David Archibald that there is a general tendency to lower sunspot numbers to be associated with less growing days on the Canadian prairie. For sure the general observation that there has been a significant temperature drop there is well known as many farmer/families follow these trends carefully. New record low at International Falls? Algore must has just crossed over?
Agree. When drawing a line of “best fit” it would be good to take note of how good the fit actually is. In this case it looks pretty loose. There is a trend but not a strong one. Doesn’t invalidate the hypothesis that sunspot activity has an association with growing season but not strong evidence in favour either.
Any particular reason you chose to fit an exponential model?
What is the correlation coefficient of those two datasets?
How much of the variability is explained by the model.
“The blue line is the line of best fit”
LOL. If that is the best best fit you can fit you need another hypothesis.
Guest suggestion: stick to geology.
Do you have similarly powerful evidence of the effects of eating plants on curing cancer, that would be most interesting.
Are you confusing David Archibald with David Middleton?
So sad.
Ruined a perfectly decent comment with a cheap shot at the wrong person, giving away the malicious intent.
Yes, I did confuse the names. There is no “malicious intent”, the message is stick to a subject you understand and techniques in which you have some expertise.
Actually, as oil exploration geologists, I would expect that David Middleton would know how to fit a line and when to fit one.
What mislead me is that David Middleton has adopted the habit of calling ALL of his posts for the last couple of years a “guest… something or other”. That’s so much his trade mark that that and forename David fooled me.
I suppose I should apologise to David Archibald for confusing him with someone who knew anything about numbers.
You do not understand science. “Best fit” is what the scientist draws on graph to confirm their conclusions.
13 month running average has always been my preference.
It’s deceptive. Now, with lower sunspot numbers we should expect GDDs on the left side of the chart.
You have to identify the nature of the graph. The problem is that the graph only shows the average from only two months of every year. Sunspot activity has a long cycle and there is no guarantee that the high or low of sunspot activity will be during this two monts period. Thus, this is like a stroboscopic glimpse into sunspot activity. The graph suffers from this effect, which also suggests that the blue line is somewhat reasonable as snapshots of a larger phenomenon
If the data sets had the slightest correlation the cherry pick of 2 months would reduce the significance of that correlation. Luckily they are not in the slightest bit correlated so this is not a problem.
This while post is the most monument pile horse manure that would certainly merit peer view publication in a “highly respected” journal like Nature Climate Change, if it’s conclusions concerned CO2.
Fig 3 and the North American high temps of the 30’s make no sense if solar “magnetic activity” controls climate. And where is the 1970’s Ice Age cometh?
Joel, you’ve been around these threads long enough to know that it’s 20 year cycles on top of 60 year cycles, on top of 110 year cycles, on and on up to the big kahuna, the 2,400 year cycle. Sometimes they line up, sometimes they don’t. And then you’ve got Milankovich cycles.
Hence the shotgun blast and we’re all doomed. Like picking your best fit blue suede shoes only to go outside and it’s freezing and pouring rain and you should have worn the sloppy galoshes. None of it matters except we’re all doomed and send more grants to study the dooming.
We are all doomed. Nobody gets out alive. We all leave with a toe tag.
“On a long enough time line, the survival rate for everyone drops to zero.” – Narrator (aka Tyler Durden)
I don’t like to say “I told you so…”
But…
I told you so…
https://agree-to-disagree.com/most-of-canada-is-currently-cooling
Please note that “I told you so…”, more than once…
Just saying…
https://agree-to-disagree.com/global-warming-by-country-and-region
This is why I made the move from New Hampshire to central Florida four years ago. I had been studying this climate change business for ten years.
Me too – Started looking for a job as far south as I could in 2014, in Fort Myers which is as far south as I could find for high tech work.
There are many high tech work places further south.
Haven’t your heard of the Southern Hemisphere?
This article shows to how to find the best location to reverse global warming:
https://agree-to-disagree.com/how-far-to-reverse-global-warming
I’m not surprised by these temperatures. Worried though…
https://www.themoscowtimes.com/2020/05/25/siberia-in-midst-of-freak-heat-wave-a70369
https://www.cnbc.com/2020/07/24/climate-change-arctic-heatwave-driving-record-temperatures-wildfires.html
and there have been similar record temps in September.
Griff, how long is your record?
Griffs record is about 3 minutes long, then it just lifts the needle and goes back the the starting groove again
Is Griff one of those “true believers”? It is so seldom I get to see one in the wild, so to speak.
Yep, Griff is like a broken record reporting broken records.
The “griff” gets “science” only from “approved” sources, links above and The Guardian are the usual fare. The “griff” 97% of the time does not even bother reading what it links to.
To your knowledge, in July, even in August and some days in September we had groundfrost in several regions in Germany, in western and in eastern part.
And, earliest snowfall in Boulder since accurate records have been kept…
Griff, you’d better stock your pantry and make sure you have a way to cook food without electricity. If you don’t, you’ll find yourself hip deep in wishing you’d done so. Things are changing rapidly, kiddo, and those fires will add something to the precipitation load.
I had to turn the furnace on this year on September 9. That is the earliest I have ever done so, in the nearly 20 years I’ve been in this house. This morning, the temp at sunrise was low 40s and the furnace is running nicely. April 30 was the last day of snow this year. I expect to see first snow earlier than it was in 2019, on Hallowe’en.
PS
Proof
CTV Ottawa
Published Friday, February 27, 2015 4:06PM EST
Last Updated Friday, February 27, 2015 4:21PM EST
It’s official. Environment Canada says data now confirms February 2015 was the coldest in 115 years.
A report summing up the February weather patterns shows the Arctic air mass stuck over eastern Ontario and southwestern Quebec resulted in temperatures 5 to 9 degrees colder than normal.
The monthly report from Environment Canada states:
“As of February 25, the February 2015 temperature anomaly over eastern Ontario and south-western Québec was never observed before since 1900 making it a 115-year return period event (1 case out of 115 years). The second coldest was 1979. Previous to 1900, there is 1889 which had a colder February than 2015, but data are more or less reliable in those years.
The bone chilling unrelenting cold led to hundreds of collisions, hundreds of frozen pipes, and lost business at local restaurants and businesses.
CTV Ottawa weather forecaster J.J. Clarke says relief is on its way.
A milder weekend with sunny skies is promised for Saturday with a high of minus 9.
https://www.thestar.com/news/starweather/2015/03/it-s-official-february-was-toronto-s-coldest-month-ever.html
https://youtu.be/wkDvqQKGgDA
And a few days later it hit record lows. One day does not a warming trend make…
Low solar years have “wavy” jet streams. This drives arctic air farther south and warmer air farther north. The areas in Siberia that experienced hot temperatures this summer had snow just a few weeks later. Unfortunately you only seem to see the warm and never the offsetting cold.
Although the TSI only drops slightly during solar minimums, its frequency distribution changes which effects O3 generation in the atmosphere. There are also a lot fewer solar flares and CME’s hitting the Earth during a minimum. Both of these strike the Earth with tremendous energy and when you have fewer, you have less heating of the upper atmosphere. Additionally there are many more cosmic rays hitting the Earth during solar min.
There is a reason the Dalton/Maunder cold spells happened during a quiet Sun. If in fact we are going into a minimum, it’s going to get cold. We also haven’t had a big volcano go off in quite some time. If a Pinatubo event happens it will only exacerbate what we are facing.
Poor griffool
STILL getting WEATHER and climate mixed up.
The Siberian heat wave in May was a very localised WEATHER event…
… and it was NO WARMER than several previous WEATHER events.
I’m worried that it has been cooling in my hometown of Lewiston, ID since 1961, when the all time high temperature of 115f was recorded there. And that fully half the 50 US states’ high temperature records were set prior to 1941.
griff
I hate to “rain on your parade”, but Russia has suffered from extreme heat waves (and cold waves) for many centuries.
You can see heatwaves (and cold waves) in the GISTEMP temperature anomaly data, which goes from 1880 to the present day.
Have a look at this video that I made from the GISTEMP gridded temperature data.
The colours used have the following meanings:
dark pink – warmer by more than 5 standard deviations
medium pink – warmer by between 4 and 5 standard deviations
light pink – warmer by between 3 and 4 standard deviations
dark orange – warmer by between 2 and 3 standard deviations
medium orange – warmer by between 1 and 2 standard deviations
light orange – warmer by between 0 and 1 standard deviations
light green – cooler by between 0 and 1 standard deviations
medium green – cooler by between 1 and 2 standard deviations
dark green – cooler by between 2 and 3 standard deviations
light blue – cooler by between 3 and 4 standard deviations
medium blue – cooler by between 4 and 5 standard deviations
dark blue – cooler by more than 5 standard deviations
Basically, green and orange are normal temperature anomalies, pink are extreme warming, and blue is extreme cooling.
You can make the video “full screen” if you want to. And you can use the left and right arrow keys to go back or forwards in time, to any month.
I suggest that you look at these months
– January 1880 – large heat wave over Canada and America (pink)
– February 1882 – large heat wave over Russia (pink)
– December 1882 – large cold wave over Russia (blue)
– February 1884 – large cold wave over Canada and America (blue)
– March 1884 – large cold wave over Russia (blue)
– December 1886 – very large heat wave over Russia (pink)
– February 1894 – extreme heat wave in Russia (pink)
– I haven’t even reached the 20th century yet
– etc, etc
If you want to see a large modern heat wave in Russia, look at March 2017.
You might like to check out January 1963, the last time that the river Thames in England froze. See the blue colour over England and Western Europe. Notice that at the same time, there was a heat wave over Eastern Russia.
People notice heat waves that happen now, but they don’t remember the heat waves that have happened throughout history (when people didn’t have air conditioning). It is easy to be alarmist when you don’t know what happened before 1970.
https://agree-to-disagree.com/nta-map-video-30-minutes
Another interesting thing about my video of GISTEMP gridded temperature anomaly data.
The video shows El Ninos very clearly. The Pacific ocean turns pink to the left of South America.
You can see the 1998 super El Nino develop and disappear, from June 1997 to May 1998.
Please bring your own popcorn.
Whatever you do, DON’T look at the heat wave in my video that happened in Russia in February 1903.
It is too scary !!!
And there was a continuous extreme heat wave in Russia from December 1913 to February 1914 (3 months of continuous extreme heat wave).
Do you remember the good old days?
International Falls was even colder on 18 Sept 2020 with 20 F. Record cold was observed the morning of 18 Sept 2020 in northern Minnesota. Here are the 5 lowest temperatures ever recorded in the month of Sept at International Falls MN over the past 114 years:
19 F 15 Sept 2011
20 F 18 Sept 2020
20 F 18 Sept 2012
20 F 26 Sept 1965
20 F 20 Sept 1956
The greens will do a 180 degree turn and start blaming CO2 for global cooling. The climate fear and loathing must continue, Trump or no Trump!
Higher CO2 levels in upper troposphere DO emit more IR to outer space….technically causing more heat loss, a.k.a. cooling, at that altitude.
First frost here in eastern ontario tuesday sept 15. A one hour frost delay at our golf course. Today 1 c on our deck. That is cold for this time of year. It is the earliest frost I personally can remember. I don’t have a graph.
Similar news here in 50 miles west of Chicago. I got frost this morning. The pepper plants are endangered. We will see, but kind of early !
Thank you Griffles -m for letting us know that you are ‘worried’ about folks taking themselves and their kids to the beach.
I’d be tempted to say that “Prozac may help” but it won’t.
Chronic depression and the resulting Puritanism *and* magical thinking come on after a lifetime of consuming refined sugar *or* cooked starch *or* alcohol *and/or* cannabis. Any one or more of those will suffice.
Add in the lack of Vitamin B from eating Rabbit Food, lack of Vitamin D from sitting inside, lack of Zinc through the alcohol use we are Big Trouble
Add further the lack of Iron & Magnesium (combined with the lack of Vit B bring on the whole myriad of mental health disorders – Asperger’s, Down’s, Autism & full blown dementia.
Plenty folks will now claim they can see/measure Alzheimer’s in folks who are, but don’t even know, they are pre-diabetic.
All very fine and dandy, even in the 1920’s doctors could reverse/cure full blown Type 2 diabetes – caused from eating too much Rabbit Food.
The REAL Big Problem and the Triple Whammy is that….
1) there are now too many people to be able to eat anything other than sugar
2) the production of same (tillage) is causing not only the observed ‘Climate Change’ but also the rise in atmospheric CO2
3) worst of all, the resulting Bent Minds and warped thinking now believe, via their Magical Thinking, that consuming ever more Rabbit Food will fix their imaginary/magical problem.
It’s impossible to more More Wrong – simply too surreal even for Monty Python
The trade winds at 140 degrees longitude have once again flipped westardly and more cool pool is forming in the western Pacific undercurrent. That La Nina is almost guaranteed to form now and the cooling is going to kick off, bigly.
We’re also 10 months into SC 25 and continuing a 30 day stretch of zero sunspot activity.
The ongoing solar quiet since August has also piqued my my interest. I mentioned in a comment somewhere about 5 days ago if this continues thru 2 more Carrington rotations (53 days ~7 1/2 weeks) then it’s something to be more concerned about.
It’s not just May – July. Maximum temperatures during the warm part of the year May-October have been cooling the eastern USA48 for over 80 years:
Quite a few of those states the cooling is dramatic and goes back to the 19th century
Source: NOAA’s Climate At A Glance
“Source: NOAA’s Climate At A Glance”
Despite the fact the link only pertains to a small fraction of the global surface – the US – the source shows what appears to be uniform warming.
And yet humans are not causing it nor can we stop it. Climate changes, constantly, always has and always will. Right now US is cooling, this will continue till it starts to warm in the spring, then it will cool again. Always has and always will. The fact that college educated people are too stupid to understand this is just comical, until you idiots screw up economies, agriculture, energy production and manufacturing and you are all very close to receiving the rewards you all so richly deserve for your asinine meddling in things you are too stupid to understand.
Best fit ‘best’ is a continuum from great, through best, to useless, and expressed by the correlation coefficient, standard deviation or variations. Without those additional data it is merely ad copy for the Gullahbull.
Remember the “great Dust Bowl” of the 30’s that affected the US snd Canada….Seems to conflict with the chart above….explain pls
The Dust Bowl was the result of the loss of the monsoonal flow of air out of the Gulf of Mexico. And it was not hot weather. You don’t have to have heat to have a drought. It went on for eight years, and it was not a hot weather event.
The cold wave in 1936 was the coldest on record then, with no precipitation included in the Dust Bowl area. https://en.wikipedia.org/wiki/1936_North_American_cold_wave
That went on for several years. Summers were hot and dry, winters were cold and dry.
Selective much….seems like you picked one year out of many. Since your only contribution is to cut and paste wiki…..looks like you missed this little tidbit
According to Wiki, the paragraph before your info…..
“The 1936 North American heat wave was one of the most severe heat waves in the modern history of North America. It took place in the middle of the Great Depression and Dust Bowl of the 1930s and caused catastrophic human suffering and an enormous economic toll. The death toll exceeded 5,000, and huge numbers of crops were destroyed by the heat and lack of moisture. “
Try watching the history of “the great dust Bowl” to educate yourself regarding the severity if the heat.
Still today, the vast majority of all time state high temp records come from the 1930’s
No, Steve, I did NOT miss it. I was trying to make a point that you missed entirely: LACK OF WATER POURING OUT OF THE SKY.
Read it again: I said COLD WAVE 19936 — NO PRECIPITATION.
You must have missed that part.
Maybe you missed the whole point of the article….low solar, cooler temperatures. The chart shows lowest solar 1933, yet the thirties, with the exception of one cold year, were some of the warmest years on record in the US.
The question was, how dies one reconcile the higher temps of the 30’s with the predicted “cooler” temps Shown in the chart.
Again Sarah, remember the point of the OP, low solar, low temps. Although drought played a part in the dust bowl, The subject raised was Temp vs solar.
Perhaps you meant to start a new post, Solar output vs precipitation. That would be nice, but again not the subject of the post.
The question remains….if low solar causes cooling, how at the low end of a solar downturn do you wind up with a decade of the highest Temperatures. Simple question that doesn’t require dragging in precipitation.
For your own info you can easily look up and see the 30’s were the hottest decade before the current debacle of adjusted thermometers.
Again, we’re talking solar activity vs temperature, try to stay on point.
“we’re talking solar activity vs temperature”
Yes, we are
With water vapor being the prominent greenhouse gas in the earth atmosphere, one should not be surprised to find both the greatest summer heat and the greatest winter cold during the very dry 1936 dust bowl. There are a small number of examples of stations receiving both their monthly record maximum and monthly record minimum during the same day during certain very dry summer months.
For all that mention the “Dust Bowl”, I suggest going to
this site, https://www.timothyeganbooks.com/
then BOOKS
See: The Worst Hard Time
– – – then: The Big Burn is the story of “The Great Fire of 1910”
“Remember the “great Dust Bowl” of the 30’s that affected the US snd Canada….Seems to conflict with the chart above….explain pls”
Here’s the Hansen 1999 U.S. surface temperature chart. It doesn’t look anything like the chart in figure 3.
You can see the high temperatures of the 1930’s, the low temperatures of the 1970’s, and the warming that started in the 1980’s.
And yes you can have record cold in the same year you have record warm temperatures. It just all depends on how the high pressure system that is causing the warm temperatures is situated. The high can be situated over the central US during the summer, bringing high temperatures to most of the nation, and then the high can drift off to the west allowing cold Canadian air to come down into the United States on the east side of the high.
I think nearly all States have their record highs taking place during the decade of the 1930’s.
According to Hansen, in the US, 1934 was 0.5C warmer than 1998, which would make 1934, 0.4C warmer than 2016, the warmest year in the 21st century.
Btw, all other unmodified surface temperature charts have essentially the same temperature profile as the US Hansen chart, i.e., they all show it was just as warm in the Early Twentieth Century as it is today.
There was less CO2 in the atmosphere in the 1930’s, than there is today, yet today is no warmer than in the 1930’s. More CO2, and cooler temperatures. Just the opposite of the claims made by alarmists.
What is a “Cumulative aa Index against long term average 1868 – 2020” graph?
As à set out Climate Scientist you don’t know what the aa index is ?
Loydo:
This may help:
https://www.swsc-journal.org/articles/swsc/full_html/2018/01/swsc180020/swsc180020.html
aa index
https://www.ngdc.noaa.gov/stp/geomag/indices.html
and
http://appinsys.com/GlobalWarming/AAIndex.htm
growing degree days, cooling rend since 1940
https://www.ncbi.nlm.nih.gov/pmc/articles/PMC5934404/pdf/41598_2018_Article_25212.pdf
Much obliged.
For the first time in my (long) memory my heating came on, on the 30th and 31st August (60 miles North of London). The gauge to automatically turn the heating on is permanently set to 13 degrees. When I checked my Weather Station at 6.30 a.m. it was showing 50F. This is far from normal for the South of the UK, so is POTUS going to be proved ‘spot-on’ with his prediction and are we entering a period of cooling?
Hardly. The last 3 days of August were indeed unusually cool – well-timed for the long weekend. But September has been about 1.5 degrees above the long term average (according to the Central England Temperature), and most enjoyable too.
Frost here in central NH, about 2 weeks early. We are also dealing with a fairly serious drought here, with no end in sight either. If only one of those bazillion tropical storms would make it up this way. Mother Nature must be “angry” with us for some reason. Maybe we used too much Chiffon margarine?
Don’t let Nerem close to these figures. Fitting a quadratic results in an acceleration of 0.54 growing degree days/year2. Also extrapolating, like all good climate scientists do, results in there being 2759 growing degree days by 2100. The dramatic effect this will have on crop levels and pest development is unknown but has been blamed on man made climate change!!
And then down south we have more fun:
Synopsis for the Gulf of Mexico
454 AM EDT Sat Sep 19 2020
.SYNOPSIS…Tropical Storm Beta near 26.0N 92.5W 996 mb at 5 AM
EDT moving N at 7 kt. Maximum sustained winds 50 kt gusts 60 kt.
Beta will move to 26.6N 92.6W this afternoon, 26.9N 93.4W Sun
morning, then strengthen to a hurricane near 27.1N 94.3W Sun
afternoon, Hurricane Beta will be near 27.4N 95.2W Mon morning,
27.7N 95.9W Mon afternoon, and 28.1N 96.3W Tue morning. Beta will
weaken to a tropical storm offshore the Texas coast early Wed A
cold front will move through the northeast Gulf through the
weekend, bringing fresh to strong NE winds into early next week.
Another 24 hour hurricane that diminishes to a TS before hitting land. It’s amazing the number of storms this year that make it to TS or hurricane strength only for a few hours. Either NOAA’s models are ‘optimistic’ about their strengths (most storm declarations are based on inference rather than direct measurements), or conditions are not right for sustainable storms like the past.
I guess the bigger question is “Has this resulted in a significant drop in bushels/acre on these plains?” Climate extremists to to focus on the cost to agriculture, ignoring it is positive for warmer, and (usually) negative for cooler.
Ignored is the fact that CO2 will continue to rise until significant ocean surface cooling is noted, and possibly for many years thereafter. Some agronomists credit today’s increased crop yield more to CO2 level (800-900 is ideal for most agriculture) than to hybridization and Roundup.
As a “fertilizer plant” engineer, I tend to think that timed-release MAP and other features of modern (ammonia is ammonia) non-synthetic fertilizer will help us thru at least the first 15 years of Solar-minimum induced cooling.
« Canadian prairies have been cooling for decades now ! « What a lie !
Total contradiction with réal data !
Just fake News
Been cooling here in calgary, and wetter
Not for “decades” but steady trend for 15 years
The data is given as Figure 1…..
NOT fake news.
Get over it!
http://coolwx.com/record/usamovie.day.php
not limited to northern MN
Posted comments before but
I garden in calgary, it has been cooler and wetter as the years proceed. My rain barrels used to go dry end of June through use and no replenishment
Still full sept 18
Used to start picking tomatoes mid August
Beginning sept now
Went to -5c at the lake in southern sask on Labor Day, killer freeze
But has been decent August and most of September, makes up for earlier
Also noted my observation of cooling and warming
Was cool and wet right thru end of July, highs max 20c regularly, lake temp increased to 73F
Very hot dry August, consistent 30’s C, lake still cooled to 62F.
Sun heats water
Hot air after end of July, but lower and less sun, lake cools
My observation of alarmist claim that CO2 heats atmosphere that in turns heats ocean
I call BS based on my little experiment
Posted comments before but
I garden in calgary, it has been cooler and wetter as the years proceed. My rain barrels used to go dry end of June through use and no replenishment
Still full sept 18
Used to start picking tomatoes mid August
Beginning sept now
Went to -5c at the lake in southern sask on Labor Day, ki!!er freeze
But has been decent August and most of September, makes up for earlier
Also noted my observation of cooling and warming
Was cool and wet right thru end of July, highs max 20c regularly, lake temp increased to 73F
Very hot dry August, consistent 30’s C, lake still cooled to 62F.
Sun heats water
Hot air after end of July, but lower and less sun, lake cools
My observation of alarmist claim that CO2 heats atmosphere that in turns heats ocean
I call BS based on my little experiment
31 here in Butler county PA this morning, during the last two weeks we have had lows of 38 and 40. During September.
Here’s an interesting take from Adapt 2030:
The cold will remain after the smoke clears. The exceptional cold is from long duration TSI catching up to us while the seasonal insolation falls.
David Dubyne thinks cosmic rays control the climate. Cosmic rays peaked months ago and the temperature was still high and there were in fact fewer clouds during the solar minimum, so the big Svensmark cosmic ray theory failed miserably. The joke’s on everyone.
Fuunny isn’t it.
All that CO2 emitted into the atmosphere…….. and it gets colder. 😉
I think it’s too soon to cast this theory aside. Svensmark’s first go at this was shot down because the nuclei were smaller than needed to grow cloud-sized particles. The clouds (albedo) are likely the trigger for cooling or warming and, as we all say, climate science is not “settled” yet.
Particulates will cool.
Mods
I had several comments on here that just disappeared
Which gods did I offend?
And then reappeared
Mysteries of the internet