From Dr. Susan Crockford’s Polar Bear Science
Posted on February 14, 2020 | Comments Off on Polar bear habitat at mid-winter as extensive as 2013 & better than 2006
Arctic sea ice at the middle of winter (January-March) is a measure of what’s to come because winter ice is the set-up for early spring, the time when polar bears do most of their feeding on young seals.
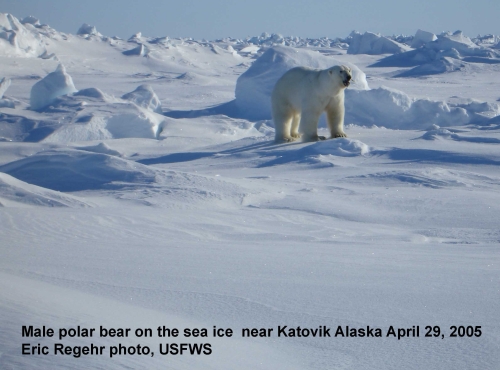
[Mid-winter photos of polar bears are hard to come by, partly because the Arctic is still dark for most hours of the day, it’s still bitterly cold, and scientists don’t venture out to do work on polar bears until the end of March at the earliest]
At 12 February this year, the ice was similar in overall extent to 2013 but higher than 2006.

Remember, as far as polar bears are concerned, we can discount what’s happening in the Sea of Okhotsk, the Baltic Sea and the Gulf of St. Lawrence because these are outside the bears’ range (12 Feb 2020 below).

So for ice extent relevant to polar bears, this year is very like 2009 (below, 12 Feb 2009 at 14.9 mkm2) – especially with respect to the Barents Sea.
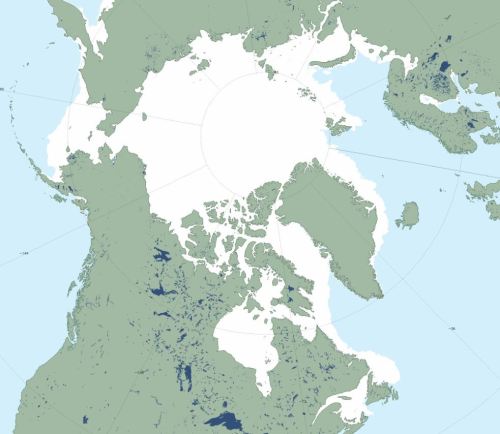
This extent of ice around Svalbard and Novaya Zemlya (below) has been rare since the late 1990s. Ice is within swimming distance of Bear Island and if the island becomes surrounded, as happened in March 2019, visits by polar bears are a near-certainty. However, this pack-ice tends to advance and retract at the edges over the season, so it’s possible that Bear Island will not see the ice this year.
Polar bear researcher Andrew Derocher posted a map of the locations of his collared and ear-tagged bears last week (8 Feb 2020):
![]()
Ice thickness charts from the Canadian Ice Service for last week on Hudson Bay (week of Feb 10), below, shows a broad swath of medium first year ice (70-120 cm) across the centre and that will continue to thicken over the next few months:

Nooo; how jolly inconvenient . . .
Using the Charctic Sea Ice Graph generator, we find that as of Feb. 15, the ice extent is almost exactly what it was on that date in 2012. The sea ice extent was quite good for most of that winter but eventually it set the record for the minimum ice extent.
Annoyingly the DMI arctic temperature archive seems to be busted. The 2012 data is missing. This year’s data is interesting because, although the temperature since Jan. 1 is a bit above average, it lacks the wild swings seen in most years.
Here’s part of a comment by rbabcock earlier today:
“The stratospheric polar vortex tightened up and has stayed over the Arctic since Christmas resulting in a very cold polar region. The winter sea ice has responded by adding back 1 million sq km. Both Alaska and Greenland have been brutally cold this winter.”
Alaska and Greenland yes – but nowhere else was anomalously cold – look at much of Canada/US and all of Russia/ Europe ……
And no, despite the tight stratospheric and tropospheric vortices, the Arctic region has been ~ 5C above the long-term average ……
http://ocean.dmi.dk/arctic/meant80n.uk.php
The tight stratospheric and tropospheric vortices may be correlated with the fact that the temperature, north of 90, since Jan. 1, has lacked its usual wild fluctuations.
It is but still it has been ~ 5C warmer than the long term average.
It is in these winters when it ‘ should’ be running at or below it.
That is a pretty specific location to measure temperature. Not a lot of area there but it does get the polar temperature just right.
Anthony Banton – you do know temperatures above 80N are modeled, not directly measured? Especially during the winter. Read the explanation of where the data comes from on the graph. And the Euro is having issues with temperatures.
And the janmap.png is using the base of 1951-1980. First, we were in a colder phase of short term climate during that period; second just how good was our historical temperature record globally from that time period? and third, why don’t you use a warmer base period when everything will be blue on the chart? As a representation of global temperatures, that graphic is laughable.
Anthony B
The Arctic warmed about 6 C since 1850 by 1970 (Canadian borehole data). I am wondering what “long term average” means in the context of this winter v.s. the past. Being 5 C above the long term average would mean it is 1 C below the recent average. I won’t challenge the numbers per se if it is satellite-based. Is it?
Environment Canada, that bastion of climate alarmism and catastrophism, dropped many northern surface stations with the result that current temperatures appear significantly warmer than reality because the numbers over much of the territory are estimated.
The large spread of sea ice this year doesn’t support the notion that “things are warming”. Waterloo has a long standing temperature series and it hasn’t warmed in 100 years though the growing season extended 2 days per decade from 1960-2000.
We have a neighbourhood outdoor skating rink this year like every other year, and if it was on average 5 C warmer, that would not be possible.
All in all, the Russians seem to be doing a much better job of this analysis that the rest, especially the Americans and Canadians: it is going to get colder from about last year, a clear trend being evident within 4 more years. Perhaps historians will identify changes from about 2012-14. I don’t know, I’m just observing, as I have since the 60’s when I got my first weather observation kit.
Whatever the trend and temperatures in the Arctic, it is clear that very few human beings are willing to try to live there. It is awful.
“ Anthony Banton – you do know temperatures above 80N are modeled, not directly measured? Especially during the winter. Read the explanation of where the data comes from on the graph. And the Euro is having issues with temperatures.”
Correct … by the 2 most resent runs from the Worlds best NWP model (ECMWF).
Is your local Wx forecast of surface temperature that day out by 5C?
Also UAH LT gives Dec +0.66 and Jan +0.12
But colder than the past few years.
Then wait another year or two or three.
The interesting thing about those DMI chart is how consistent the “above freezing” weather is. From 1958 to 2020 the day 150-225 is very stable and unchanging. The big swings in temperature always occur in the early and late (near the lows) and never get anywhere near the melting point.
The 2019 data for
Daily Mean Temperatures in the Arctic 1958 – 2020
Has gone AWOL too. Unfortunately my Danish isn’t up to the task of letting them know.
They do understand English! Don’t give up so easily!!!
Ben Vorlich February 17, 2020 at 12:54 am
The 2019 data for Daily Mean Temperatures in the Arctic 1958 – 2020 Has gone AWOL too.
Unfortunately my Danish isn’t up to the task of letting them know.
____________________________________
Njema problema:
The 2019 data for Daily Mean Temperatures in the Arctic 1958 – 2020 Has gone AWOL too –> Data fra 2019 for daglige gennemsnits temperaturer i Arktis 1958 – 2020 har også været fraværende uden officiel orlov.
Here is the temp data hourly from the MOSAIC expedition. Plus wind and barometric data.
https://www.awi.de/fileadmin/user_upload/MET/PolarsternCoursePlot/psobsedat.html
Perhaps cooling is cloud-based, and persistent.
https://electroverse.net/cosmic-rays-reach-record-highs-as-solar-activity-nears-space-age-low/
Note the strong inverse correlation between sunspots and cosmic rays.
And the rise in stratospheric radiation
If Svensmark is half right, it is going to get colder and colder for the rest of my life.
A comparison of data from Parkinson and Cavaliers, JGR 1989, to today’s shows there’s a greater extent than 1974’s maximum.
Cavalieri
Who was it who joked, “they’re breeding like Catholic rabbits.”
Or more seriously, “When Al Gore was born there were some 7000 polar bears and of these only 33,000 remain.”
If you were to say something along the lines of “they’re doing X like Jewish (*****)” or they’re doing Y like Moslem (*****)” or “they’re doing Z like gay (*****)” I’m sure there there would be huge complaints about your statements. But Catholics? We all know that is perfectly acceptable to say anything about Catholics It’s the last acceptable prejudice.
Is it prejudice to make a correct observation? When I was a child it was true that Catholics had a higher birth rate. link
The trouble with political correctness is that it prevents us from telling the truth. In so doing, it is very destructive.
I’m right there with you Bob. My Catholic aunty had ten children and one of her daughter’s, my cousin had eleven. It’s what Catholics did.
I am #10 of 11 children …… and was often asked if my parents were Catholic, to which I answered, ….. “NOPE, just passionate Hillbillies”. 😊
Commie B
The accusation is that there has been a pre-judgement made (Latin praejudicata). An observation is the antithesis of a pre-judgement. Thus an accusation of prejudice is inapt. One could accuse the contributor of “bias” or “hostility” is quite a different thing.
If one observes, Catholics were for many years forbidden the use of contraceptives in repeated rulings. The inevitable result (apparently, based on observations) is a high fertility rate for Catholic women. Is there doubt about this? It would be quite easy to recheck.
I disagree that saying “things” about Catholics means they bear the last acceptable prejudice(s). Catholics have quite a bit to say about “sinners”.
From the clatter of pots and kettles I don’t see much shining forth. Perhaps we are better off objecting to the truth that the statement comparing Catholics and rabbits is “othering” which means to pretend the Catholic adherents are not fully human – more like animals which their behaviour is said to imitate. This false accusation is an execrable act deserving of immediate condemnation.
The observation that you can use the word “Catholic” in circumstances that you would never dare to use the words “Jew” or “Muslim” is entirely fair.
The joke “breed like Catholic rabbits” is entirely funny.
God bless you all.
The pope is an old white man.
Scissor:
Define “white”.
Thanks
And therefore what?
Frank Zappa is dead. And I’m growing weary too.
https://www.google.com/search?gs_ssp=eJzj4tFP1zcsNM1KyrNMKzRg9OJLTizJyM_JTFZIzyzKKQYAknoKDg&q=catholic+girls&oq=Catholic+gi&aqs=chrome.
Perhaps we should be concerned about the Seals instead, as the Bears seem to be doing quite well!
Ah, but fewer seals means more fish! Go the fish!
“Perhaps we should be concerned about the Seals instead, as the Bears seem to be doing quite well!”
Well, the fewer seals the more fish remaining for homo sapiens. Not a bad deal.
“The stratospheric polar vortex tightened up and has stayed over the Arctic since Christmas resulting in a very cold polar region.”
I wonder if the collision of this cold polar vortex with warmth from the tropics has generated the energy that created storms Ciara and Dennis coming in over Great Britain.
Would not the Polar bear to seal population curves wax and wane similar to the lynx to snowshoe hare curves? Unless the polar bear had access to other prey.
I thought it was all gone by now….
Where are the models? Gotta have models, not actual studies andsarc off observations, otherwise the paper is junk. /sarc off
That’ll teach me for typing on a bus!
A bus? you’re just virtue signalling 🙂
tonyb
Huh! A bus, that’s not virtue signalling that’s bragging, most of us can only afford pick ups and cars, it takes real dedication to the combustion engine to own a bus. 🙂
I own the bus only for the duration of the trip A to B. Just like all the other “self-loading, paying cattle”.
I was genuflecting to those peasants riding bikes as I past bouncing in my seat trying to hang on. Some of these bus drivers are a bit manic. At least I got home about 20 minutes earlier tonight.
Climate annoyingly continues to go in the wrong direction, despite all the ‘encouragement’ provided by the climate adjusters and homogenizers, the firing of dissenting scientists, blacklisting of sceptics, embargo of journals that publish stuff questioning the synod of the consensus climate industrial complex, etc. Why can’t we all do the collegial thing and get along! Let’s pony up, scrap our ICE cars and the fossil and nuclear power thingameez, mow down the polar bears, blast the rock barrier holding back the Thwaites Glacier, pour acid on the GBR in the night, send thousands of icebreakersto do research in the polar regions, and recruit more arsonists in Australia and California (these unsung heroes can’t do it all alone) and get this Neo Dark Ages plan done!
You forgot the cowardly collaboration of the media and the silence of ethical scientists.
Due to an embarrassing increase in numbers, Polar Bears have largely lost their Mojo these days.
I would suggest an excess of mojo if their numbers are increasing.
I though Polar Bears all died from heat stroke brought by Global Warming.
1.2 billion for weather forecasting supper computer
https://www.bbc.com/news/science-environment-51504002
“supper computer’? Can it make me a tasty stew? LOL.
What, it’s a cannibal computer as well?
Q: How do you eat a whole supper computer?
A: One byte at a time…..
I was a subscriber to BYTE.
Still nothing from the green mob regarding Russia’s huge drilling investment in the Arctic.
Greenpeace had their @sses booted by the Russians when they tried boarding an Arctic oil rig a couple of years back, that’s why.
Right time for a brief summary of where we all are on the global warming progress.
1. From the godfather of global warming Al, we were told no Arctic sea ice by 2014, or 2015 , or 2016…still here.
2. Polar bears will be extinct due to lack of sea ice by 2020 the BBC and others. still here and too many of em.
3. Our children simply won’t know what snow is. Try telling that to the kids in the Middle East and North Africa, those Canadians are also consistent disbelievers of that one.
4. Hurricanes will be devastating, in number and force. Still waiting for that one, as we have endured the most benign period of hurricane activity in the past 100 years!
5. Sea level rise will inundate “low lying” areas. I guess they were were referring to Al Gore resting on his sun bed in the tidal zone of his sea side mansion beach, with that scare.
6. Glacier nation park will lose its glaciers by 2020. Someone needs to go tell the park. They need new alarmist signs, to replace the ones they took down last year that told visitors the glaciers will be gone come 2020, the glaciers are still there.
7. The oceans will become acidic. No, they are still alkaline.
8. A Greta prophet from the East will come and admonish us for being AGW disbelievers. How dare you!
9. Wild fires will become catastrophic and unprecedented in scale. Wildfires are trending well below the average of the past 100 years. and have been consistently down, until the fuel load was allowed to build up to dangerous levels by the COGS.
10. We will run out of fossil fuel by 2010, or more correctly it will have peaked by 2010. Someone needs to let the major users of fossil fuel know, they didn’t quite get the message.
Perhaps a new target year will now be adopted. How about 2050?
I am a bit worried, by 2050 if trends continue like this, the polar bear population will be so large, there won’t be enough mints to support them… 🙂
Where is Griff when you need some light comedy?
Waiting for his new script to be delivered so he can start answering peoples questions with more obfuscation and diversion.
No sign of Loydo yet, either.
I think Griff has moved to the Arctic to make observations and report back to Wattsupwiththat.
Griff has been reincarnated as simple simon.
The WWF has an ad out for “adopting” a polar bear to raise funds to combat climate change. I think they are going to use it to buy an ice machine.
Spaceweather.com has a story alerting it’s readers to polar stratospheric clouds forming in the arctic. They require extremely low stratospheric temperatures to form. Does a very cold stratosphere mean very cold surface temperatures?
Arctic warming by models have been “over-projected” — likely due to strong bias in climate science to show excessive warming.
Open access paper: Huang, J., Ou, T., Chen, D., Luo, Y. and Zhao, Z., 2019. The amplified Arctic warming in the recent decades may have been overestimated by CMIP5 models. Geophysical Research Letters, 46(22), pp.13338-13345.
Abstract
Realistically representing the Arctic amplification in global climate models (GCMs) represents a key to accurately predict the climate system’s response to increasing anthropogenic forcings. We examined the amplified Arctic warming over the past century simulated by 36 state‐of‐the‐art GCMs against observation. We found a clear difference between the simulations and the observation in terms of the evolution of the secular warming rates. The observed rates of the secular Arctic warming increase from 0.14 °C/10a in the early 1890s to 0.21 °C/10a in the mid‐2010s, while the GCMs show a negligible trend to 0.35 °C/10a at the corresponding times. The overestimation of the secular warming rate in the GCMs starts from the mid‐twentieth century and aggravates with time. Further analysis indicates that the overestimation mainly comes from the exaggerated heating contribution from the Arctic sea ice melting. This result implies that the future secular Arctic warming may have been over‐projected.
Anthony,
“And no, despite the tight stratospheric and tropospheric vortices, the Arctic region has been ~ 5C above the long-term average ……” I guess that depends on what you describe as the Arctic. I’ve noted this year that to the far northeast of me ( parts of the Yukon and Alaska) have often been warmer than land farther west.
I can’t find long term graphs. But I check the temperatures for Tuktoyuktu, Inuvik, Aklavik and other communities in the Yukon, Northwest Territories, and Nunavut regularly. There are places that haven’t risen above -35 C since mid-November. and have been near, or have broken records during this winter.
I found this for Inuvik NT: https://www.worldweatheronline.com/lang/en-ca/inuvik-weather-averages/northwest-territories/ca.aspx. It is almost always warmer further north because of the sea. The graph definitely shows a cold 2020 winter. (As well as below average temperatures for the last ten years.) We’ve had a ” normal” winter this year, a bit farther south. A few weeks of really cold (-40 C) but quite a bit of near or above zero weather as well. I live in Northeastern BC. -27 C this morning. The cold spot in Canada today is -42.8 °C-45.0 °F in Thomsen River, NT, but it’s a balmy – 11 in Whitehorse YUK, and only -32 C in Iqaluit on Baffin Island. From where I sit, no ~ 5 C increase in temperature is apparent.
Frank Zappa is dead. And I’m growing weary too.
https://www.google.com/search?gs_ssp=eJzj4tFP1zcsNM1KyrNMKzRg9OJLTizJyM_JTFZIzyzKKQYAknoKDg&q=catholic+girls&oq=Catholic+gi&aqs=chrome.
https://www.google.com/search?gs_ssp=eJzj4tLP1TdISjMtz842YPRSTitKzMtWqEosKEhUKM4oLVEoLVBIzEtRKMhJrFRIL80sSSwCAJVkEQQ&q=frank+zappa+shut+up+and+play+guitar&oq=Frank+zappa+shut+up&aqs=chrome.