By Allan MacRae and Joseph D’Aleo, October 2019
Introduction – Catastrophic Anthropogenic Global Warming – A Failed Hypothesis
The Catastrophic Anthropogenic Global Warming (“CAGW”, aka “Global Warming”, “Climate Change”, “Climate Crisis”, “Climate Emergency”) scare is a failed hypothesis and the greatest scientific fraud in history. Global warming alarmism has been promoted by political extremists and believed in by their gullible acolytes for decades, even though there is no credible evidence that catastrophic global warming exists in reality, and ample evidence that the CAGW hypothesis has been falsified.
The failed CAGW hypothesis assumes that increasing atmospheric CO2 from fossil fuel combustion drives dangerous runaway global warming. The alleged evidence for this fraud is climate computer models that greatly over-predict current observed warming, typically by 300 to 500%. These climate models deliberately employ excessively high assumed values of climate sensitivity to CO2, and are designed to create false alarm.
Global warming has slowed since the mid-1990’s, so the climate alarmists alleged that increased atmospheric CO2 from combustion of fossil fuels will cause wilder, more chaotic weather. There is ample evidence that this allegation is also false. Weather has actually become less chaotic.
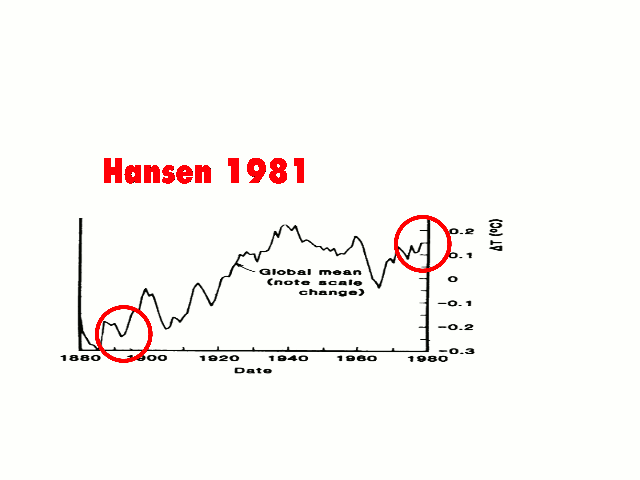
The Mann hockey stick (MBH98 etc.), the Climategate emails, historical temperature data revisions and the thuggish tactics of the climate extremists provide ample evidence of fraud.
Credible Evidence That CO2-Driven Global Warming/Climate Change Alarmism Is A False Crisis
Atmospheric CO2 concentrations have been much higher in geologic time, and runaway global warming has never occurred in the billions of years of Earth history. Global temperatures have been much warmer and also much colder over geologic time. Earth is now in a glacial period, when mile-thick ice sheets cover much of the planet for about 100,000 years, interrupted by interglacials that last about 10,000 years. Earth is now in a warm interglacial, but the last glaciation ended only about 10,000 years ago, so Earth is due for another glaciation.
Temperatures were much higher during the Medieval Warm Period circa 900-1300 AD, and then humanity experienced the Little Ice Age circa 1300-1850 which caused enormous suffering and the deaths of millions.
The USA has some of the best surface temperature data in the world. The hottest USA surface temperature records occurred in the 1930’s, before fossil fuel combustion accelerated circa 1940.

Fossil fuel combustion accelerated strongly at the start of World War II, and global temperatures COOLED significantly from 1940 to 1977. That one observation is sufficient to disprove the CAGW hypothesis – global temperatures do NOT rise catastrophically due to increasing atmospheric CO2.
Even if it is assumed that ALL the observed global warming is ascribed to increasing atmospheric CO2, the following two studies calculated that the MAXIMUM climate sensitivity to a hypothetical doubling of atmospheric CO2 is only about 1 degree C, which is too low to cause dangerous global warming.
Christy and McNider (2017) analysed UAH Lower Troposphere data since 1979.
Lewis and Curry (2018) analysed HadCRUT4v5 Surface Temperature data since 1850.
That 1C/doubling is not an average, it is a MAXIMUM climate sensitivity, since some or most of the observed warming could be due to natural causes. Repeating, climate computer models used by the IPCC and other global warming alarmists employ climate sensitivity values 3-to-5-times higher than 1C/doubling, in order to create false fears of dangerous global warming.
It is highly probable, based on the evidence, that solar activity, not atmospheric CO2, is the primary driver of Earth’s temperature. In astrophysicist Willie Soon’s recent video, he shows the Sun-Climate relationship and provides his conclusions. There is strong correlation between the Daily High Temperatures and the Solar Total Irradiance (54:51 of the video):
… in the USA (55:02),

Canada (55:16),

and Mexico (55:20).

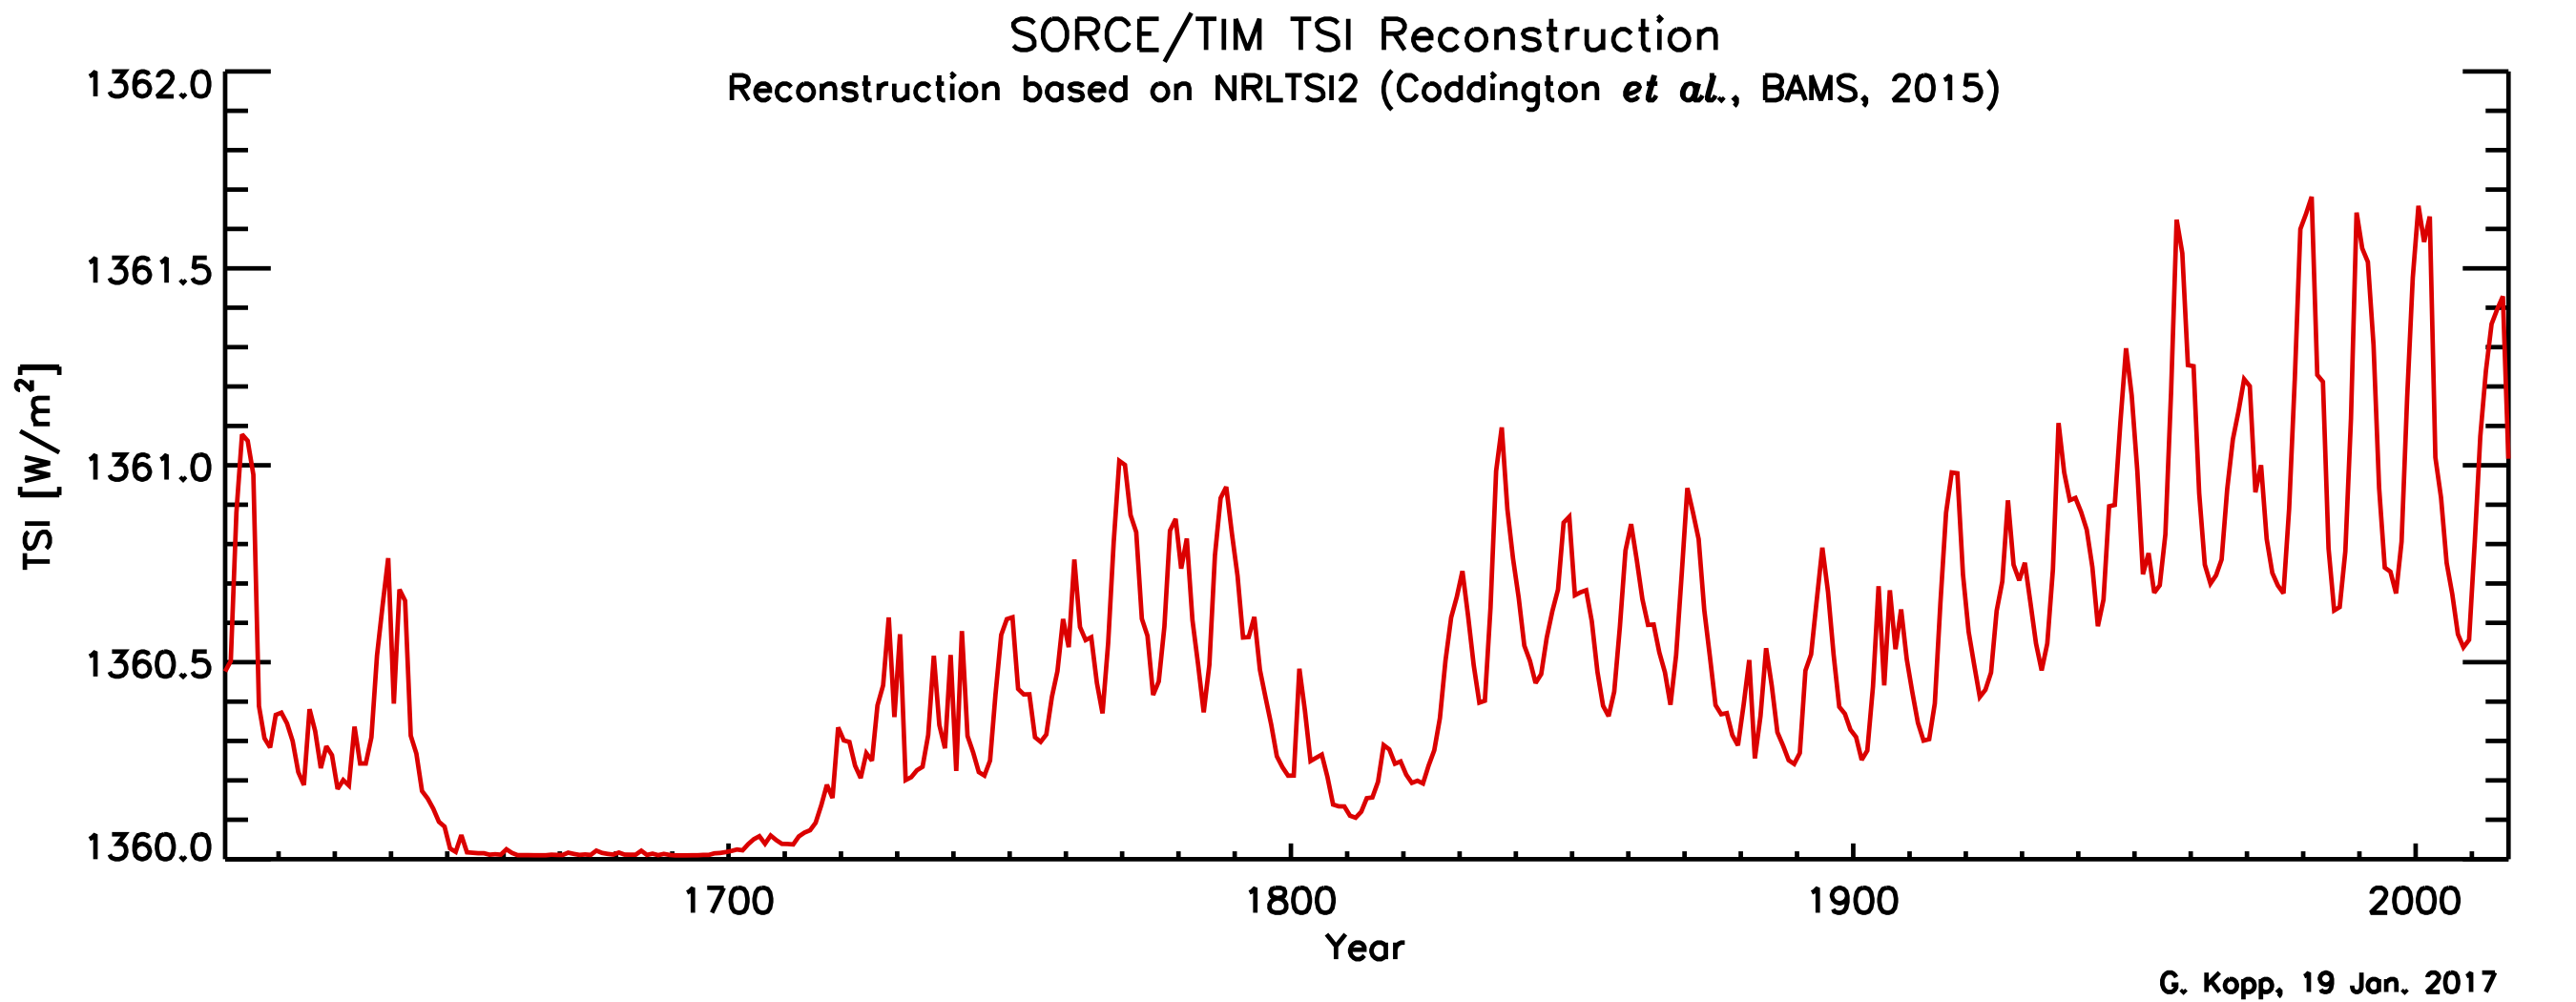
Solar Total Irradiance is now close to 1360 W/m2, similar to the lows of very cold periods circa 1700 and 1800. Atmospheric temperatures should be cooling in the near future – maybe they already are.

http://woodfortrees.org/plot/pmod/offset:-1360/scale:1 Note: Offset = -1360 means 0 = 1360.
We do know that the Sun is at the end Solar Cycle 24 (SC24), the weakest since the Dalton Minimum (circa 1800+), and SC25 is also expected to be weak. We also know that both the Dalton Minimum and the Maunder Minimum (~1650 to ~1700) were very cold periods that caused great human suffering.

http://lasp.colorado.edu/home/sorce/files/2011/09/TIM_TSI_Reconstruction-1.png
Global temperature is certainly NOT primarily driven by increasing atmospheric CO2, because CO2 changes LAG global temperature changes in time, both in the ice core proxy record and also in the modern data record. The Vostok ice core record shows a lag of CO2 after temperature of ~~800 years.

In January 2008, Allan MacRae made the following major observations in this paper.
Reference: “Carbon Dioxide Is Not The Primary Cause Of Global Warming”, January 2008
http://icecap.us/images/uploads/CO2vsTMacRae.pdf
a. The velocity of changes of atmospheric CO2 [dCO2/dt] varies ~contemporaneously with changes in global temperature.
b. Therefore the integral of dCO2/dt, changes in atmospheric CO2, lag changes in global atmospheric temperature by ~9 months.
The very close relationship of dCO2/dt (red) vs global temperature (blue) is clearly apparent. Major volcanoes (some VEI5 and most VEI6 events) disrupt the relationship.

Integrating the dCO2/dt data gives changes in CO2, which lag changes in temperature by ~9 months.
The above figures employ Mauna Loa (mlo) CO2 data. Similar results were observed using global CO2 data, as in MacRae 2008. The impact of major volcanoes is apparent.
The 12-month delta in CO2 is used to allow for the “seasonal sawtooth” in the Keeling Curve.
The ~9-month lag of atmospheric CO2 changes (red) after temperature changes (blue) is apparent.

In January 2013, a similar observation was made by Humlum, Stordahl and Solheim – that atmospheric CO2 changes lag global sea surface and air temperature changes by 9-12 months.
Reference: “The phase relation between atmospheric carbon dioxide and global temperature”
https://www.sciencedirect.com/science/article/pii/S0921818112001658
a. Changes in global atmospheric CO2 are lagging 11–12 months behind changes in global sea surface temperature.
b. Changes in global atmospheric CO2 are lagging 9.5–10 months behind changes in global air surface temperature.
c. Changes in global atmospheric CO2 are lagging about 9 months behind changes in global lower troposphere temperature.
“The phase relation between atmospheric carbon dioxide and global temperature”, January 2013

Our Predictive Track Record Is Excellent; The IPCC and Acolytes Have Been Consistently Wrong.
The ability to predict is probably the best objective measure of scientific competence. The IPCC and its global warming alarmists have consistently failed – every one of their scary global warming/climate change predictions has failed to happen.
“Climate science does not support the theory of catastrophic human-made global warming – the alleged warming crisis does not exist.”
“The ultimate agenda of pro-Kyoto advocates is to eliminate fossil fuels, but this would result in a catastrophic shortfall in global energy supply – the wasteful, inefficient energy solutions proposed by Kyoto advocates simply cannot replace fossil fuels.”
Both these above statements are demonstrably correct to date. Despite accelerating combustion of fossil fuels, especially since 1940, and increases in in atmospheric CO2 measured since 1958, the world has experienced only hugely beneficial increases in crop yields and mild, beneficial global warming.
Despite the decades-long campaign to eliminate them, fossil fuels have retained their 85% share of global primary energy, and the rest is mostly nuclear and hydro. Despite tens of trillions of dollars in squandered subsidies, green energy still comprises only 4% of global primary energy. Due to intermittency, grid-connected green energy schemes do not even significantly reduce CO2 emissions, since they require almost 100% spinning-reserve, typically fossil fueled, to fill-in when the wind does not blow or the sun does not shine.
CO2 Concentration is Far Too Low; Earth Is Colder-Than-Optimum for Humanity and the Environment
The radical greens could not be more wrong. Contrary to green propaganda, atmospheric CO2 is far too low, and Earth is colder-than-optimum for humanity and the environment.
Atmospheric CO2 concentration is not too high – it is far too low for optimal plant and crop growth, and far too low for the continued survival of terrestrial life on Earth. CO2 reduction and sequestration schemes are not just wrong; they are costly, destructive and imbecilic.
Cold weather kills about 20 times as many people as warm and hot weather. Excess Winter Deaths in the USA average about 100,000 per year – equivalent to two 9-11’s per week for 17 weeks EVERY YEAR.
Excess Winter Deaths are calculated as the difference between deaths in the four winter months (December to March in the Northern Hemisphere) less half the deaths in the eight non-winter months.
Excess Winter Deaths occur worldwide, even in warm countries like Thailand and Brazil. An approximate-low estimate of Excess Winter Deaths is 2 million souls per year worldwide.
More than 50,000 Excess Winter Deaths occurred in England and Wales during the winter of 2017-18 – an Excess Winter Death rate about THREE TIMES the per-capita average in the USA and Canada. Proportionally, that is about 35,000 more deaths in the UK than the average rates of the USA and Canada. Excessively high energy costs in the UK due to false global warming/anti-fracking hysteria are a major part of the cause of these Excess Winter Deaths – driven by global warming alarmists and their corrupted minions in governments and institutions.
Predictions of Imminent Global Cooling, Starting Anytime Soon
“Over the past one thousand years, global temperatures exhibited strong correlation with variations in the sun’s activity. This warming and cooling was certainly not caused by manmade variations in atmospheric CO2, because fossil fuel use was insignificant until the 20th century.
Temperatures in the 20th century also correlate poorly with atmospheric CO2 levels, which increased throughout the century. However, much of the observed warming in the 20th century occurred before 1940, there was cooling from 1940 to 1977 and more warming after 1977. Since 80 per cent of manmade CO2 was produced after 1940, why did much of the warming occur before that time? Also, why did the cooling occur between 1940 and 1977 while CO2 levels were increasing? Again, these warming and cooling trends correlate well with variations in solar activity.
Only since 1977 does warming correlate with increased CO2, but solar activity also increased during this period. This warming has only been measured at the earth’s surface, and satellites have measured little or no warming at altitudes of 1.5 to eight kilometres. This pattern is inconsistent with CO2 being the primary driver for warming. If solar activity is the main driver of surface temperature rather than CO2, we should begin the next cooling period by 2020 to 2030.”
For the past ~five years, MacRae has written that global cooling would start closer to 2020. This global cooling will start sporadically, at different locations in the world. Similar predictions of global cooling are included in the Appendix.
It is notable that planting of crops has occurred one month later-than-usual in North-central growing areas of North America in both 2018 and 2019. In 2019, there were many more record U.S. all-time daily low temperatures than record highs for the last 30 days, 365 days and year-to-date. These events may just be weather, not climate, or they could be the early indicators of global cooling.
The U.S. Department of Agriculture publishes a weekly crop report:
Crop Progress NASS Weekly, Mondays
https://usda.library.cornell.edu/concern/publications/8336h188j
The October 21, 2019 report is here: https://downloads.usda.library.cornell.edu/usda-esmis/files/8336h188j/qr46rf238/fx71b191j/prog4319.pdf


The North-central 2019 harvest was hit hard by wet, cold weather. Meteorologist Joe D’Aleo explains:
The growing season in North America has been especially challenging.
| Crop Challenges 2019
· Greatly delayed or aborted planting ° 19 million acres did not get planted. ° Late cold, snow, rain and flooded fields. · Shallow roots caused by excess rain · Soil Compaction · Mid to late summer dryness and heat to the South and East. · North-central growing areas saw excessive rainfall AND not enough sun or Growing Degree Days · Early snows in Northwest growing areas · Half the corn and soybean crop was not mature enough to harvest until mid-October · The soybeans and corn still in the field are delaying the planting of winter wheat |

The cold weather that developed early in the year persisted through the summer into the fall in the North-central region, which helped move warmth into the Southeast. Heavy rains fell along the contrast zone between the extremes.

With the cold, the Growing Degree Days were well below normal in North-central growing areas, and above in the Southeast.

See the heavy rains in the central Corn Belt early in the growing season, shifting Northwest late.

Corn and soybeans progress on average trailed well behind the normal.

Corn maturity as of October 20th 2019 was most behind in the Dakotas Southeast to the Great Lakes and Ohio Valley. Note the much better conditions in the South.

Newman’s analysis of 1980 showed the ideal growing areas of the Corn Belt would shift North with warming and South with cooling by approximately 144 kilometers per 1°C. The current corn growing area is shaded.

Newman, J. E. (1980). Climate change impacts on the growing season of the
North American Corn Belt. Biometeorology, 7 (2), 128-142.
The 2019 soybean harvest also trailed the 5-year average by 18% though the leaf drop was just 3% behind average.

Even where the first freezing temperatures came on time, the delays meant losses of corn not reaching black layer maturity and soybeans that had not dropped their leaves.

Very early snows arrived with the early cold in the North-central region affecting corn, soybeans, spring wheat and small grains, there and in parts of the Canadian Prairies.

The yield estimate on October 10th marks the first season in 6 years below the trend line.

Production estimates are down slightly but are expected to decline further after the effects of the early cold and snows are considered.

The soybean yield also is below trend line for the first year in 6 years. Projected soybean production is down more than corn production.


More areas will see below freezing temperatures and even snow before November.


Summary and Conclusions
It is notable that crop planting has occurred one month later-than-usual in the North-central growing areas of North America in both 2018 and 2019. While warm summer weather saved the 2018 crop, in 2019 the Northern corn and soybean harvests were devastated by a cold summer and early cold weather. In 2019, there were many more record U.S. all-time daily low temperatures than record highs. These events may just be weather, not climate, or they could be the early indicators of global cooling.
Appendix – Other Predictions of Global Cooling, In Chronological Order Since 2003:
In 2003, Dr. Theodor Landscheidt wrote a paper predicting serious global cooling:
“Analysis of the sun’s varying activity in the last two millennia indicates that contrary to the IPCC’s speculation about man-made global warming as high as 5.8° C within the next hundred years, a long period of cool climate with its coldest phase around 2030 is to be expected.”
In 2005, Piers Corbyn predicted cooling by 2040.
On the 2nd February 2005, he gave this presentation to the Institute of Physics Energy Management Group. It contained the following statement:
“In the next 5 or 10 years warming is likely to be maintained as a transpolar shift occurs. This will be followed by the magnetic pole moving away from the geographic pole, a decrease in solar activity, a Southward shift in the Gulf Stream and considerable world cooling by 2040 AD.”
In 2006, NASA predicted that
“Solar Cycle 25, peaking around the year 2022, could be one of the weakest in centuries”.
Khabibullo Abdusamatov and colleagues at the Russian Academy of Science stated in 2006:
“Global cooling could develop on Earth in 50 years and have serious consequences before it is replaced by a period of warming in the early 22nd century…
On the basis of our [solar emission] research, we developed a scenario of a global cooling of the Earth’s climate by the middle of this century and the beginning of a regular 200-year-long cycle of the climate’s global warming at the start of the 22nd century.”
Khabibullo Abdusamatov said he and his colleagues concluded that a period of global cooling similar to one seen in the late 17th century – when canals froze in the Netherlands and people had to leave their dwellings in Greenland – could start in 2012-2015 and reach its peak in 2055-2060.
He said he believed the future climate change would have very serious consequences and that authorities should start preparing for them today because “climate cooling is connected with changing temperatures, especially for Northern countries.
Nigel Weiss, University of Cambridge, stated in 2006:
“If you look back into the sun’s past, you find that we live in a period of abnormally high solar activity. Periods of high solar activity do not last long, perhaps 50 to 100 years, then you get a crash. It’s a boom-bust system, and I would expect a crash soon.”
Leif Svalgaard, Stanford University, stated in 2006:
“Sunspot numbers are well on the way down in the next decade. Sunspot numbers will be extremely small, and when the sun crashes, it crashes hard. The upcoming sunspot crash could cause the Earth to cool.”
In 2007, Lin Zhen-Shan and Sun Xian wrote in “Multi-scale analysis of global temperature changes and trend of a drop in temperature in the next 20 years”:
“… Signs also show a drop in temperature in China on century scale in the next 20 years. (4) The dominant contribution of CO2 concentration to global temperature variation is the trend. However, its influence weight on global temperature variation accounts for no more than 40.19%, smaller than those of the natural climate changes on the rest four timescales. Despite the increasing trend in atmospheric CO2 concentration, the patterns of 20-year and 60-year oscillation of global temperature are all in falling. Therefore, if CO2 concentration remains constant at present, the CO2 greenhouse effect will be deficient in counterchecking the natural cooling of global climate in the following 20 years. Even though the CO2 greenhouse effect on global climate change is unsuspicious, it could have been excessively exaggerated. It is high time to re-consider the trend of global climate changes.”
Polish up the Gold Medals for D’Aleo and MacRae!!!
Olympians of the highest order!
After reading Ernst Becks reconstruction of the CO2 record from 1812 to 1961 from chemical measurement, the impression I get is that we could have CO2 spike to 550 ppm while the earth is cooling down, and then right after spiking it could fall back to 360 ppm. All that regardless of human intervention, what’s Greta going to say 12 years from now?
What hurts even more, Canada could break up shortly over this CO2 madness, it could result in a civil war, thousands of people could die as a result. The 4 left wing federal parties all ran on anti Alberta oil platforms. They talk about taking the tar sands offline while unemployed oil workers are already killing themselves. Alberta secession has been talked about before, but now it’s not out of anger but fear of what comes if the province fails to leave Canada. What I believe is really driving the madness in Canada, the financial centers in eastern Canada are looking at a windfall in carbon credits for taking the oil sands out of production. They want to use them to buy Saudi oil for consumption in eastern Canada instead of relying on transfer payments from oil rich Alberta. They’ve always seen western Canadian growth as a threat to their power,now they literally want to destroy it. This is madness fed by a nonsense theory, it will not end well.
The leftist leaders are sociopaths – here is some of the evidence.
THE LIBERALS’ COVERT GREEN PLAN FOR CANADA – POVERTY AND DICTATORSHIP
by Allan M.R. MacRae, B.A.Sc., M.Eng., October 1, 2019
https://wattsupwiththat.com/2019/10/01/the-liberals-covert-green-plan-for-canada-poverty-and-dictatorship/
Here is more evidence:
http://green-agenda.com/
Again, there is a difference between “climate science” and “political science.”
Is Al Gore a climate scientist?
There are lots of quotes along the lines that “It doesn’t matter if CAGW is true or not. We need to ride it to change the economies of the world.” (I’m not going to bother looking up for you. You’ve probably already seen them.)
Does that sound like climate “science” or political “science”?
Here is more evidence:
Your own opinion and
http://green-agenda.com/
LMFAO. That is not evidence, its a nutso blog with a prominent link to some even weirder Christian end-times blog.
This is all a big joke right?
Mr. Macrae, since you wrote your “paper” in 2008, you have been predicting that global cooling will start. Since then (11 years) It hasn’t. Your predictions are worthless.
Karl – stop writing and learn to read.
None of your “global cooling” predictions have come to pass.
Karl, can you show us examples where you hounded alarmists over all of their many, many failed predictions?
What’s curious to me is how nobody seems to have remarked how anomalous the 2016 El Nino was.
Prior to 2016, global mean temperature anomaly was following a steady pattern: a long term trend + a 60-65 year cyclic component. Here, it is easy to pick out the cyclic pattern after the long term trend is removed:
http://woodfortrees.org/plot/hadcrut4gl/from:1900/detrend:0.75
As the pattern was established well before the mid-century acceleration in CO2 emissions, it is not due to that (even if concentration were tracking emissions, which it isn’t – as Allan and others have shown, the tracking of the rate of change of CO2 concentration with temperature anomaly is a much better fit).
The cycle had peaked for the 2nd time within the record in about 2005, and was heading down, right on schedule. By now, a cooling trend should have been readily apparent.
But, the pattern was upset by the 2016 El Nino, where you can see the sudden jump from the established pattern. It remains to be seen if this heralds a long term regime change, or if temperatures will regress back to the underlying pattern, as they did after previous El Ninos.
Hi Bartemis,
Nice to hear from you; thank you for your insightful comments – hope you and yours are all well.
I’ve been blogging about the 90-degree (pi/2) lag of the integral (delta CO2) after its derivative (dCO2/dt) for some time, and finally formalized it in this paper:
“CO2, Global Warming, Climate And Energy”, June 15, 2019
https://wattsupwiththat.com/2019/06/15/co2-global-warming-climate-and-energy-2/
Excel: https://wattsupwiththat.com/wp-content/uploads/2019/07/Rev_CO2-Global-Warming-Climate-and-Energy-June2019-FINAL.xlsx
After the major El Nino’s of 1998 and 2016, there were minor disruptions in the following close relationship of dCO2/dt vs global temperature:
http://www.woodfortrees.org/plot/esrl-co2/from:1979/mean:12/derivative/plot/uah6/from:1979/scale:0.22/offset:0.14
As I wrote recently to my friend Madhav:
“I think Earth is shedding heat now in this step-up/step-down pattern – I think we are in a transition zone now – we’ll see.”
https://wattsupwiththat.com/2019/10/27/the-real-climate-crisis-is-not-global-warming-it-is-cooling-and-it-may-have-already-started/#comment-2832918
NASA called the shift into a PDO cool phase in 2008. It was cold for a few years and then the PDO turned positive again circa 2014. The PDO looks like it’s going negative again.
http://ds.data.jma.go.jp/tcc/tcc/products/elnino/decadal/pdo.html
Both the cool PDO phase starting circa 2007 and the current imminent one (?) occurred at the ends of Solar Cycles 23 and 24. I think this winter will bring some cold temperature records around the world – hope to be wrong.
I spoke with Joe D’Aleo yesterday, Joe’s winter forecast will be issued in November – Joe and his team at WeatherBell are usually correct.
Best personal regards, Allan
And to you, Allan. Keep fighting. You are right.
I wrote yesterday:
“Both the cool PDO phase starting circa 2007 and the current imminent one (?) occurred at the ends of Solar Cycles 23 and 24. I THINK THIS WINTER WILL BRING SOME COLD TEMPERATURE RECORDS around the world – hope to be wrong.”
Looks like I’m not wrong… …damn!
RECORD LOW TEMPS, UP TO 50 DEGREES BELOW NORMAL, THREATEN TO WRECK REST OF HARVEST SEASON
http://endoftheamericandream.com/archives/record-low-temps-of-up-to-45-below-zero-threaten-to-absolutely-wreck-the-rest-of-the-harvest-season
by Tyler Durden
Thu, 10/31/2019 – 12:00
It isn’t supposed to be this cold in October. The official start of winter is still almost two months away, and yet the weather in much of the western half of the country right now resembles what we might expect in mid-January. All-time record lows for the month of October are being set in city after city, and this extremely cold air is going to push into the Midwest by the end of the week.
Temperatures in the heartland will be up to 50 degrees below normal, and unfortunately about half of all corn still has not been harvested. Due to unprecedented rainfall and extreme flooding early in the year, many farmers faced extraordinary delays in getting their crops planted, and so they were hoping that good weather at the end of the season would provide time for the crops to fully mature and be harvested. Unfortunately, a nightmare scenario has materialized instead. A couple of monster snow storms have already roared through the Midwest, and now record low temperatures threaten to absolutely wreck the rest of the harvest season.
When temperatures get significantly below zero for more than a few hours, scientists tell us that it will kill standing corn…
A significant freeze (28°F or colder for a few hours) will kill the whole plant, and any frost will act to defoliate plants, resulting in diminished grain filling for the seeds, especially on the upper half of the plants.
And right now we are facing a crisis because less than half of all U.S. corn has been harvested.
In fact, according to the latest USDA Crop Progress Report just 41 percent of all U.S. corn has been harvested so far…
In its weekly Crop Progress Report, the USDA pegged the U.S. corn harvest at 41% complete, below the trade’s expectation of 48% and below a five-year average 61%.
Minnesota is behind the most regarding picking corn: 22% vs. a 56% five-year average.
So when I used the term “nightmare scenario” earlier, I was not exaggerating.
The low temperatures that we have seen this week are hard to believe. According to USA Today, the temperature in one community in Utah actually hit 45 degrees below zero on Wednesday…
Subzero cold was recorded as far south as the Grand Canyon on Wednesday morning, the Weather Channel said. Big Piney, Wyoming, plunged to minus 24 degrees before sunrise Wednesday.
Notorious cold spot Peter Sinks, Utah, dipped to an incredible minus 45 degrees early Wednesday. This appeared to be the coldest October temperature on record anywhere in the Lower 48 states, according to Utah-based meteorologist Timothy Wright.
That is seriously cold.
And we have also seen many other all-time October lows in cities all across the western half of the country…
-Bozeman, Montana: minus 14 degrees (Oct. 29 and 30)
-Casper, Wyoming: minus 8 degrees (Oct. 29 and 30)
-Grand Junction, Colorado: 12 degrees (Oct. 30)
-Livingston, Montana: minus 12 degrees (Oct. 29)
-Rawlins, Wyoming: minus 20 degrees (Oct. 30)
-Rock Springs, Wyoming: minus 6 degrees (Oct. 30)
-Salt Lake City: 14 degrees (Oct. 30)
We have never seen anything like this during the month of October ever before.
In Denver, they have actually set record lows for three days in a row…
The temperature in Denver officially dropped to 3 degrees above zero early Wednesday morning. It was cold enough to shatter the previous record low for October 30 by 4 degrees. It was our third record temperature in 3 days and one more record is expected Thursday morning.
It is strange that so much of the nation is experiencing such bitterly cold weather while much of California is being burned to a crisp by horrific wildfires.
But this continues a theme that we have been tracking all year. Everywhere we look there have been bizarre weather extremes, and many expect that to continue into the winter season.
This week, even “warm weather cities” are experiencing extremely cold temperatures. For example, the forecast called for a record low of just 19 degrees in Albuquerque, New Mexico on Thursday morning…
Thursday morning in Albuquerque is expected to have a record low temperature of 19 degrees. It will feel like 11 degrees with the wind chill. The current record low for Oct. 31 in the city is 21.
According to the National Weather Service, locations from Albuquerque southward, including east central and southeast New Mexico, “have not seen temperatures this cold since February.”
But the real damage will be done as this extraordinarily cold air moves into the Midwest. According to USA Today, we could see temperatures “30 to 50 degrees below normal” in the central plains…
High temperatures Wednesday were forecast to be 30 to 50 degrees below normal across Colorado, Texas and the central Plains, according to meteorologist Ryan Maue of BAM Weather.
Right now, much of the Midwest is currently covered by snow. This has prevented a lot of farmers from being able to harvest their crops, and now devastatingly cold air is moving in.
It is likely that the crop losses in many areas will be severe. And considering what is going on elsewhere in the world right now, this is something that we cannot afford.
Despite all of our advanced technology, farmers are still deeply dependent on good weather, and if farmers do not grow our food we do not eat.
This was already going to be an absolutely abysmal year for U.S. agriculture, and now this snap of record cold weather is going to be the nail in the coffin for many U.S. farmers.
Without a doubt, this is an incredibly important story, and I will continue to keep you updated as I learn more.
I wrote yesterday:
“Both the cool PDO phase starting circa 2007 and the current imminent one (?) occurred at the ends of Solar Cycles 23 and 24. I THINK THIS WINTER WILL BRING SOME COLD TEMPERATURE RECORDS around the world – hope to be wrong.”
Well that prediction did not take long to materialize – RECORD COLD TEMPERATURES ACROSS THE USA!
Love the imbecilic headline below from USA Today – it’s cold because of global warming. 🙂
Regards, Allan
CLIMATE CHANGE IS MAKING WINTERS COLDER DESPITE RISING TEMPERATURES AND HOTTER SUMMERS..
USA TODAY
https://www.usatoday.com/story/news/nation/2019/10/30/arctic-cold-blast-breaks-temperatures-october-utah-wyoming-colorado/4098089002/
• It was only 18 degrees in Denver, which tied for the coldest October day on record in the city.
• Some cities are seeing temperatures 30 to 50 degrees below normal.
• Notorious cold spot Peter Sinks, Utah, dipped to an incredible minus 45 degrees early Wednesday.
The calendar may say October but the weather is more typical of January in portions of the western and central U.S.
“A wave of Arctic air has infiltrated the northern tier of the United States this week, shattering record lows, and threatening as many as 70 (other record lows) through Halloween,” AccuWeather said.
Subzero cold was recorded as far south as the Grand Canyon on Wednesday morning, the Weather Channel said. Big Piney, Wyoming, plunged to minus 24 degrees before sunrise Wednesday.
Notorious cold spot Peter Sinks, Utah, dipped to an incredible minus 45 degrees early Wednesday. This appeared to be the coldest October temperature on record anywhere in the Lower 48 states, according to Utah-based meteorologist Timothy Wright.
High temperatures Wednesday were forecast to be 30 to 50 degrees below normal across Colorado, Texas and the central Plains, according to meteorologist Ryan Maue of BAM Weather.
On Tuesday, the high temperature in Denver only hit 18 degrees, which tied for the coldest October day on record in the city, the National Weather Service reported. About a half-foot of snow added to the wintry feel across the metro area.
Denver’s low temperature Thursday morning could come within a few degrees of the city’s all-time coldest October temperature of minus 2 degrees, the Weather Channel said.
The biting cold air for this time of year is being funneled southward from Canada into the western and central United States by a southward plunge of the jet stream, the Weather Channel reported. That dip in the jet stream will slowly migrate eastward late in the week, taking the colder air with it.
By Friday, while the intensity of the cold will ease, even the Gulf Coast and Eastern Seaboard will see a switch to chilly weather, the Capital Weather Gang said. Highs will hover only in the 50s from Friday through the weekend in cities such as Washington, Philadelphia and New York.
While much of the nation freezes, Florida is seeing record highs on Wednesday, Maue said, with temperatures soaring to near 90 degrees in Orlando, Tampa and Miami.
Epilogue
Allan MacRae wrote on December 4, 2013 at 5:41 am
https://wattsupwiththat.com/2013/12/02/study-predicts-the-sun-is-headed-for-a-dalton-like-solar-minimum-around-2050/#comment-1147149
[excerpt]
I suggest global cooling starts by 2020 or sooner. Bundle up.
What’s curious to me is how nobody seems to have remarked that if you do not remove the trend, the 60-65 year cyclic component is overwhelmed by said trend: http://woodfortrees.org/plot/hadcrut4gl/from:1900/plot/hadcrut4gl/from:1900/trend
Bartemis:
The 2016 El Nino was caused by a massive reduction in SO2 aerosol emissions by China, a reported drop of 29 Megatons, due to a 2014 pollution-reduction mandate.
When the air is cleaner, sunshine strikes the earth’s surface with greater intensity, causing increased warming.
This warming ended due to three 2015 VEI4 volcanic eruptions (Chikurachki, Feb 16, Calbuco, Apr 22, and Wolf, May 25. The maximum cooling from an eruption typically occurs about a year or more after the date of the eruption.
This was also the cause of the 1997-98 El Nino, where SO2 aerosol emissions were reduced by a reported 7.7 Megatons, due to Clean Air Efforts.
There are no temperature cycles, only random changes in atmospheric SO2 aerosol levels, primarily from volcanic eruptions.
Huuuuuh! Look at this! -20 °C in Denver, CO!
https://www.wetteronline.de/wetterticker/usa-rekord-wintereinbruch-fuer-oktober-201910296613618
No wonder that all these CONUSians believe that the Globe is coooooooooling!
We enjoy right now +20 °C in Al Andalus… Ha.
I think it would be wiser to analyze the actual consequences of these sudden temperature drops in North America, instead of spreading scary nonsense.
@Bindidon,
certainely you didn’t realise where else record snowfall and cold in october happend ? And certainely you aren’t even interested in. It’s not your agenda 😀
below 0°C in Europe
Krishna Gans
1. Instead of trying to use HTML anchors (that requests some little experience), simply publish a link instead.
2. “And certainely you aren’t even interested in. It’s not your agenda”
Don’t guess about that, you know nothing about me.
below 0°C in Europe at unusual times
I know, what you comment. Shows a lot about your agenda.
Krishna Gans
Sorry, no agenda (a typical ‘skeptic’ idiom), I’m luckily free of such nonsense.
I use ‘wetteronline.de’ everyday since it exists, and have seen that picture probably even before you did.
A few comments
1. At the beginning of October 1999, we got near Berlin a harsh temperature drop down to -3 °C, and we got snow, yes, in October.
2. But persisting degrees below 0 °C and snow we now miss since around 2014, due to successive extremely mild winters in parts of Western Europe.
3. While we had, for the whole Germany average, over 4 °C above the 1981-2010 mean during June 2019, Spain experienced at the same time more than 2 °C BELOW average, and usually very warm corners around Sevilla had even 6 °C below. Ten thousands of tourists were disappointed.
Ya, K. Gans: wo bleibt sie denn, die globale Erwärmung? Vielleicht hier?
https://drive.google.com/file/d/1ESDd0LROc53jvSm1rZFhjkaQqif7tZ5R/view
Your link, Tmax vs. Tmin shows very nice, the increasing UHI, thanks for confirmation.
What we realy have are alterning weather conditions, for western Europe it’s normal we enjoy the Atlantic driven weather, and in times of low sun activity that may change to continental driven weather, cool air from E / NE as at the moment.
You have no idea, when I saw the picture for the first time, and it’s completely irrelevant.
When I read this here
“Cold weather kills about 20 times as many people as warm and hot weather. Excess Winter Deaths in the USA average about 100,000 per year – equivalent to two 9-11’s per week for 17 weeks EVERY YEAR.
Excess Winter Deaths are calculated as the difference between deaths in the four winter months (December to March in the Northern Hemisphere) less half the deaths in the eight non-winter months.
Excess Winter Deaths occur worldwide, even in warm countries like Thailand and Brazil. An approximate-low estimate of Excess Winter Deaths is 2 million souls per year worldwide.
More than 50,000 Excess Winter Deaths occurred in England and Wales during the winter of 2017-18 – an Excess Winter Death rate about THREE TIMES the per-capita average in the USA and Canada. Proportionally, that is about 35,000 more deaths in the UK than the average rates of the USA and Canada. Excessively high energy costs in the UK due to false global warming/anti-fracking hysteria are a major part of the cause of these Excess Winter Deaths – driven by global warming alarmists and their corrupted minions in governments and institutions.
I get a big, big laugh.
Of course I don’t laugh about all the persons who died mostly due to lack of the necessary social proptection against cold!
I laugh about the deliberately frightening interpretation of these deaths.
Why do I?
Simply because you just need to move from the UK down to France, and you experience exactly the contrary:
La chaleur tue plus que le froid — Heat kills more than cold (dated 12.12.2017)
https://www.franceinter.fr/sciences/la-chaleur-tue-plus-que-le-froid
It starts unequivocally with
That means
“Does temperature have an effect on mortality? While the climate summit is taking place in Paris this Tuesday, Public Health France publishes a study conducted between 2000 and 2010 in metropolitan France on the impacts of cold and heat. It’s very clear: the heat makes more victims.”
The 2003 heat wave was responsible for far over 50,000 deaths in Western Europe.
Did anybody notice that little detail?
Excellent cherry pick Bindidon! LOL
You guys are the best cherry pickers tax dollars can buy. And you wonder why we are skeptics? Because you lefties commit lies of omission. constantly.
Now the truth.
Cold weather kills 20 times as many people as hot weather, according to an international study analyzing over 74 million deaths in 384 locations across 13 countries. The findings, published in The Lancet, also reveal that deaths due to moderately hot or cold weather substantially exceed those resulting from extreme heat waves or cold spells.
https://www.sciencedaily.com/releases/2015/05/150520193831.htm
Have you no shame?
I get a big, big laugh.
Perhaps you didn’t realize you’re coming across like a callous sociopath. What is so g-d funny?
The 2003 heat wave was responsible for far over 50,000 deaths in Western Europe.
Did anybody notice that little detail?
Yes.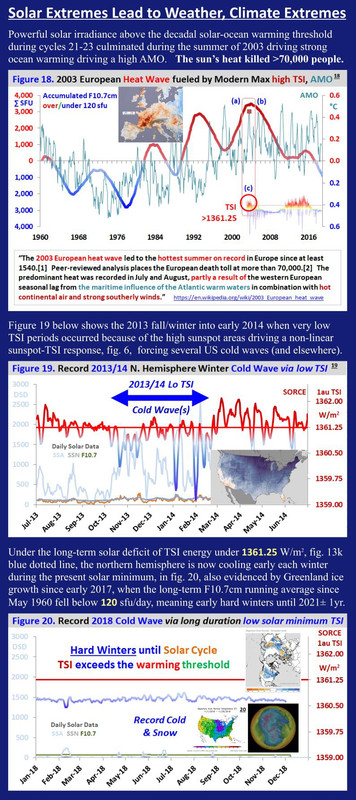
Thank you Bob,
Your post notes that Total Solar Intensity was at a record or near-record high at the time of the 2003 heat wave.
I have not studied the 2003 event so have no comment, but here is an observation from a 2015 event:
https://wattsupwiththat.com/2019/09/01/the-next-great-extinction-event-will-not-be-global-warming-it-will-be-global-cooling/#comment-2785162
[excerpt]
Cool and cold weather kills about 20 times as many people as warm and hot weather worldwide. Excess winter deaths total over 2 million souls per year. That is relevant.
Extreme-heat deaths are few, and are easily avoided by air conditioning, fan cooling, or drenching with water. Heat deaths often involve elderly people who are neglected, dehydrated and alone – they could easily have been saved with minimal care – but nobody cared.
In Muslim countries, hot deaths are associated with religions celebrations. In 2015, the media made a great fuss about 700 heat-related deaths in Pakistan. They failed to report that it happened during Ramadan, when no water is consumed from sunup to sundown. These people died of dehydration and heat stroke and their deaths were entirely avoidable. Temperatures in Pakistan reportedly reached 45C, certainly not a local record.
I have experienced 50C in Luxor Egypt and we were fine.
Bob Weber
1. Thanks for insisting on
“I get a big, big laugh.”
while interestingly (deliberately?) ignoring
“Of course I don’t laugh about all the persons who died mostly due to lack of the necessary social protection against cold!”
2. I deliberately laugh about your nice picture with this ‘heat wave fueled by TSI.
If that was the case, France would have obtained far higher absolute temperatures in 2003 compared with the historical values.
The contrary is the case, as is shown by the top 30 of the descending sort of the monthly absolute temperatures in France since 1880:
1900 7 25.50
1911 8 23.86
1944 8 23.33
1911 7 23.23
1904 7 23.17
1900 8 22.95
1900 6 22.45
1905 7 22.37
1921 7 22.00
1947 8 21.85
1900 9 21.81
1901 7 21.54
1906 8 21.52
1919 8 21.41
1943 8 21.18
1904 8 21.10
1943 7 21.06
1932 8 20.95
1952 7 20.88
1950 7 20.88
1933 8 20.88
1906 7 20.86
1947 7 20.84
1902 7 20.84
1923 7 20.79
1917 7 20.78
1928 7 20.77
1916 8 20.73
2003 8 20.72
1934 7 20.70
The (in vast majority verry aged, totally isolated) persons who died in July/August 2003 didn’t die because of the absolute day temperatures, which were not so heavily above average.
They died because the heat excess was not evacuated during the night.
When I have time to do the job, I will present you a raw daily TMIN anomaly stat of the French GHCN daily stations for that year wrt the mean of 1981-2010.
They died because the heat excess was not evacuated during the night.
(Cough)… UHI… (Cough)
Yeah.
Some love to stay on simple answers to complex questions.
It’s more comfortable I guess.
Try to process data instead of endlessly repeating your polemics!
Well, since you ran away last time I asked, let’s try again!
What is the UHI adjustment you alarmists use to “process” data? Since you know everything…
Gator
1. No, I don’t know everything.
I read papers (instead of quickly scanning them for matches with what I intuitively agree or disagree to, and process data as accurately as I can, V&V included. C’est tout.
2. I use raw data (that of GHCN daily – and not for example NOAA’s, GISS, HadCRUT’s land data), and I don’t use any station data adjustment during data processing.
3. A few screens above, you wrote:
“It found that roughly 80% of the stations studied had a warm bias of 1-5+ centigrade. So if data sets match, they are simply reflecting the same issue.”
This is nonsense, as I mentioned – and used – those stations in the remaining 20% you perfectly ignored (all USCRN and a hard selection of 71 of the 1100+ USHCN stations).
Even NOAA acknowledged the work done till 2011by volunteers at ‘surfacestations.org’, by publishing later in 2012 a list of all these 71 pristine, UHI-arm USHCN stations. The list is here:
ftp://ftp.ncdc.noaa.gov/pub/data/ushcn/v2/monthly/ushcn-surfacestations-ratings-1-2.txt
A raw-to-raw comparison of the original GHCN daily data for 46 of of these 71 selected USHCN stations with all GHCN daily data available for CONUS gave this:
3.1: 1880-2019
https://drive.google.com/file/d/1B4TzVe7rFLidKIb-dUOLwdittauW2oVY/view
3.2: 1979-2019
https://drive.google.com/file/d/12Khxeii6he3PhW-xKJL-nhlJkA1frWmS/view
Draw you own conclusions!
So what is the UHI adjustment? Or are you fine with simply incorporating it into the record? You seem to think UHI belongs in the record, and even conflate UHI with global warming. So much confusion on your part…
Gator
I’m afraid you will never [be, for obvious political reasons, willing to] understand that there is no UHI adjustment I would consider necessary.
Simply because the comparison of a few pristine, UHI-arm weather stations with thousands of possibly UHI-infected stations gives no perceptible difference.
A last example, that one I like the most. A few months ago, Anthony got raging about absolute temperatures measured in Anchorage being, in his mind, a lot above expectation.
If I well remember, he compared the temperature in Anchorage (‘AK ANCHORAGE INTL AP’) with that measured by of one of these super-pristine USCRN stations not far from the town, ‘AK KENAI 29 ENE’:
https://www.google.de/maps/place/60%C2%B043'25.0%22N+150%C2%B026'53.9%22W/@60.7236,-151.5689054,174442m/data=!3m1!1e3!4m5!3m4!1s0x0:0x0!8m2!3d60.7236!4d-150.4483?hl=en
As you can see, it’s in the middle of nowhere compared with the station at Anchorage Intl AP.
But sorry… that’s how the comparison looks between the two stations:
https://drive.google.com/file/d/14aS2UEkD0_Uw2rC05ywbQNdIURBVW-GW/view
What kind of UHI adjustment would YOU introduce here, Gator?? Why don’t you think of some RCC, i.e. ‘rural cold corner’ ?
What do you think are we measuring these days? The Globe as it is today, or that as it was 100,000 years ago ?
*
Nevertheless, GISS has a completely different view about that, you are kindly invited to read in the page
https://data.giss.nasa.gov/gistemp/
the following text:
Let me guess: you will never be able to believe the stuff above,k as your ‘skeptic’ism doesn’t allow you to. That’s your problem, not mine.
*
Oh I forgot to thank you a lot for the link you provided somewhere above:
https://www.sciencedaily.com/releases/2015/05/150520193831.htm
Much appreciated, despite the superfluous polemic around it!
Bindidon, it’s cute that you believe in “pristine” stations. Stay uninformed, it suits you.
I am a Libertarian who studied Climatology at a major university right after the global cooling scare, and right before the great global warming swindle. I have closely followed the science behind the failed hypothesis of CAGW for four decades now.
Anomalies have no business in climatology, there is no such thing as “normal” in climate or weather. Comparing anomalies is not comparing temps. But nice attempt at fraud!
a·nom·a·ly əˈnäməlē/ noun
1. something that deviates from what is standard, normal, or expected.
I guess for those that don’t get the big climate picture, anomalies make sense. But I started as a geology student, and ended up as a climatology student. So my perspective is a bit larger than most “climate experts”, who seem to think that the tail end of this interglacial is somehow the standard by which all climates should be compared. Again, what I learned through my education is that there is no “normal” in climate or weather, and IMHO, claims that there is a “normal” climate is simply ignorance.
Your entire argument is moot, because you do not understand how to measure and compare temps. Anomalies are used to confuse the ignorant.
So what is the UHI adjustment? Or are you guys simply employing it?
Gator:
“there is no such thing as “normal” in climate or weather.”
Mr. Layman here.
I think among the general public “normal” and “average” is confused. The general public is never told that the “average” is only a 30 year average rather than a 60 year or “as far back as the records go”.
In today’s hyped reporting (TWC has made itself a classic example) anything above or below that semi-arbitrary “average” is presented as “abnormal”.
(As I understand it, 30 years was chosen as a standard for “average” back in the 20’s when we only HAD about 30 year’s worth of data. Why not use 60 years or the locals’ entire instrument record now?)
Mr Layman gets it.
Climate is a moving target. It is a nonlinear chaotic system that we currently do not understand. Whoever creates anomalies subsequently defines “normal”, which climates never are. Pick a timeline and you create whatever narrative you like. As someone who came at this after many years of studying geology and ice ages, I tend to have a longer view on things, and a mild warming out of a very cold period is not alarming, but reassuring,
Gator
“Your entire argument is moot, because you do not understand how to measure and compare temps. Anomalies are used to confuse the ignorant.”
That you should officially tell to Roy Spencer right here in a WUWT guest post, if you have enough balls to do!
You may pretend to have a climate science education as long as you want.
But people discrediting the idea of generating departures from a mean in order to remove the annual cycle out of temperature series are themselves the absolute ignorants.
Thanks.
There are a few things about which Roy and I disagree. Sorry that you do not understand that climates do not have means. Not everyone has the benefit of my education.
“Some love to stay on simple answers to complex questions.
It’s more comfortable I guess.”
Some try to drive the discussion into complexity and ignore Occam’s razor, only to be detected as a sciolist by individuals who actually comprehend, sir.
Gunga Din
“Why not use 60 years or the locals’ entire instrument record now?”
Another layman’s answer: in theory you might be right in requesting longer reference periods for departure building. Until recently, NOAA’s reference period was… 1901-2000.
But transforming absolute data into departures helps you also to compare data from very different origins – e.g. surface and lower troposphere:
https://drive.google.com/file/d/1p1Cjw4L7WqCZCGKUnNth1lVwergBk-tt/view
As you certainly know, they are distant by 24 K. How would you compare them that way if the departures are based on periods like 1901-2000 resp. 1981-2010?
And even if having the same reference period: the same applies when you compare UAH’s different atmospheric layers, e.g. LT vs. LS.
What do you prefer? This?
https://drive.google.com/file/d/12ntQPUMotlrIUXTYn8721WpD3S0sihjc/view
or this?
https://drive.google.com/file/d/1OO6HpUOvk_N_tC2fUt8wzDDvMzhYM8C_/view
*
Btw: anomalies – in the sense of the departure from a mean – are one of the most stupid words I ever discovered. But you will never get rid of it.
The 2003 European heatwave was the confluence of the accumulated solar-driven AMO peaking together with high TSI that generated much heat over the Sahara, driving warm air into Europe, as I noted on my graphic.
Nowhere did I claim it was the hottest month. So what you have done is gaslight me over something I didn’t say, which is what you did earlier.
If you think it matters so much that the highest monthly temperature is more important than the high AMO and TSI factors I mentioned, back it up with mortality data with your rankings.
Bob Weber:
“The 2003 European heatwave was the confluence of the accumulated solar-driven AMO peaking together with high TSI that generated much heat over the Sahara, driving warm air into Europe”
This is nonsense! According to the GISS temperature map for Aug of that period, the Sahara was actually COOLER than the affected area (mostly France) in Europe.
The 2003 (and the similar 2019 heatwave) occurred for a different reason than you have stated. Both were caused by a stalled high-pressure system over those areas. which allowed existing anthropogenic SO2 aerosol emissions within those areas to settle out without being replaced, and, because of the resultant cleaner air, temperatures “soared”.
A stalled high pressure system was also associated with the high temperatures seen in Australia last year, indicating that higher temperatures associated with a stalled high may be a common event.
As at this time I was in South of France Aug. / Sept, I followed the news there.
The biggest problem had older persons, ill persons, and, it was precisely named, they didn’t drink enough. The services hasn’t been prepared to such situations, there wasn’t enough personal to protect these elder and/ or ill persons.
And these problems you had mostly in cities, bcause of UHI. Have a look at Paris, Lyon, high buildings, narrow streets, no wind and air exchange. The area I has been in Montpellier has been much different, not far from Mediterranean Sea, the streets wide, less taller buildings and sometimes some wind.
@ur momisugly Bindidon
What you demonstrate there seems to be a trend in cooling 😀
Krishna Gans
Thanks for your interesting reply.
1. “And these problems you had mostly in cities, bcause of UHI. Have a look at Paris, Lyon, high buildings, narrow streets, no wind and air exchange.”
That doesn’t explain the big amount of death in that portion of France which suffered the most of the heat wave in 2003: the Loire valley.
There have been there, if I well remember infos from Météo France, more deaths per km² than in Paris etc.
This religious UHI claim is really very strange.
PS I was in Southern France in June / July at that time. There was no bit of ‘fresh’ in Toulon and surroundings either.
2. “What you demonstrate there seems to be a trend in cooling”
Like so many people influenced by the idea of some global cooling (nowhere visible, even not in the UAH6.0 LT record), you think that a stable or declining series of absolute values means cooling.
But… if you build, like does UAH, the mean of all these absolute values for 1981-2010, and compute the departures from that mean for 1880-2018 and sort them, you obtain this:
1990 2 3.29
2003 8 3.27
1966 2 3.03
2015 12 2.98
2003 6 2.96
1949 9 2.89
1934 12 2.73
2018 1 2.68
2006 7 2.66
2018 4 2.62
2017 6 2.58
2007 4 2.56
2011 4 2.49
1911 8 2.41
1921 10 2.40
1937 2 2.35
1929 9 2.35
2002 2 2.33
1945 4 2.31
1961 2 2.30
1945 2 2.27
1953 12 2.22
2001 10 2.18
2007 1 2.16
2007 2 2.15
1997 2 2.14
2017 2 2.13
1936 1 2.12
1957 2 2.11
Here you see how exceptionally 2003 behaved: not in absolute data, but in anomalies. And not because 2003 is at the top of the list, but more because most anomaly sorts show only winter months at the top, indicating btw that the Globe doesn’t warm so much, but rather no longer cools enough.
The major problem in France’s 2003 was not UHI, but an extremely stable, wind-free weather pattern, which kept Sahara heat (as explained by Bob Weber), and persisted from June till August in many parts of the country.
Rgds
J.-P. D.
Yep, that’s what happens when you incorporate UHI into the record. Ever increasing infrastructure means ever increasing temperatures. Even a child can understand this.
Gator
Yep, that’s what happens when some move from ignorance down to dishonesty.
You don’t understand UHI let alone anomaly construction either.
Feel free to continue that way, I’ll stop here. Too dumb for me…
So… you are saying that UHI has been removed? LOL
Keep BS’ing Bindidon, its what you are good at.
Loire Valley isn’t right, it’s “Région Centre” and you didn’t mention Ile-de-France (Paris and surrounding).
If I have a look at the Région Centre, the cities there are old, well known for their châtaus.
Krishna Gans
When I write “the Loire valley”, I mean the geographic corner “Loire valley”, Krishna Gans, and not the recent country’s political subdivision this valley actually is encompassed in.
Please don’t loose your time in trying to teach me about such things. C’est parfaitement inutile.
Moreover, I intentionally didn’t mention the region ‘Ile de France’, as is it full of big towns.
The Loire valley is the opposite of that.
Please allow me finally to correct you a bit: ‘châteaux’ looks definitely better than ‘châtaus’.
Nichts für ungut!
Rgds
J.-P. D.
What is the weather in Ile-de-France:
https://www.google.com/search?client=ms-android-huawei&sxsrf=ACYBGNTKmSiJRygmYrRL2BrKQ1pXFMtxCw:1572944882550&q=Does+it+get+cold+in+France%3F&sa=X&ved=2ahUKEwjmyeWn3NLlAhUms4sKHS7LCNsQzmd6BAgBEBY&biw=360&bih=574&dpr=3
https://www.google.com/search?q=what+is+the+weather+in+Ile-de-France&oq=what+is+the+weather+in+Ile-de-France+&aqs=chrome.
Parisienne never let loose their Eiffel Tower; the only elevated view point in that permanent inversion weather basin.
Why was Paris called Lutetia?
The Latin word Lutetia is believed to signify “marsh” or “swamp”, as the name used to indicate the little island in the middle of the Seine (today’s Ile de la Cité), whence modern Paris originated. Aug 30, 2012″
https://www.google.com/search?q=why+are+ancient+parisii+called+constructeur+bateau&oq=why+are+ancient+parisii+called+constructeur+bateau&aqs=chrome.
1900 7 25.50 ??
1911 8 23.86
1944 8 23.33
1911 7 23.23
1904 7 23.17
1900 8 22.95 ??????????????
1900 6 22.45 ???????????
3 months of summer 1900 in the top 8 of this list ??? June and even August 1900 with warmer TX than 2003 ???
Is it a joke or a “can -i-post-nonsense -things-test” ?
or maybe GHCN data comes another country called France too , a second “France” i ‘ve never heard about ?
(Besançon , August monthly absolute temperature 1900: 23° ; 2003 : 31,9 ° Paris 23,3° VS 29,9° etc….
Post the same list for Switzerland mean monthly temperatures , i can’t wait for more funny things.
Jski
I understand your claim – je dirais même plus: je comprends vos doutes.
The data is originated from NOAA’s GHCN daily:
ftp://ftp.ncdc.noaa.gov/pub/data/ghcn/daily/
(about 40,000 stations worldwide).
1. This is a monthly averaging, which by no means automatically reflects any daily situation.
2. The ranking is partly due to the paucity of station data in 1900 compared with 2003/2019.
3. Not all data collected by Météo France is transmitted to NOAA; and conversely, not all data transmitted by them is automatically accepted by NOAA.
There is for example no data for Besançon in NOAA’s record. This is subject to changes, as I could see during downloads that NOAA acquired about 5,000 stations during the last year.
4. Paris / Le Bourget was down in 2003; the GHCN daily record doesn’t contain data to compare with 1900. The same holds for Marseille / L’Observatoire which stopped activity in April 2003.
I’ll compare Paris for July 1900 vs. 2019 and post the result.
Jski
Mean of TMAX temperatures for
FR000007150 48.8231 2.3367 75.0 PARIS/LE BOURGET 07150
– 1900 07: 29.1 °C
– 2019 07: 29.4 °C
An that despite 2019 being clearly at top of the daily ranking… 1900 doesn’t even appear here. But a monthly average is a monthly average.
FR000007150 PARIS/LE BOURGET 2019 7 25 42.6
FR000007150 PARIS/LE BOURGET 1947 7 28 40.4
FR000007150 PARIS/LE BOURGET 2015 7 1 39.7
FR000007150 PARIS/LE BOURGET 2019 7 24 39.5
*
I would have preferred a comparison for at least 10 stations located ‘in the middle of nowhere’ instead of this single one in Le Bourget. It is a pity to have so few data for the historical record!
Bonne soirée
J.-P. D.
More “Bull**** By Bindi” (aka B*3).
In fact, Excess Winter Deaths in France greatly outnumber deaths during non-winter months. This credible report depicts the “Coefficient of Seasonal Variation in Mortality” or “CSVM” for the Europe-14 Countries.
CSVM is defined in the paper and CSVM is positive for all 14 countries, which means more deaths in Winter than non-Winter months.
CSVM in France is slightly below the average of 0.16, but is still large at 0.13.
Portugal gets the prize at 0.28, followed by Spain and Ireland at 0.21 and the UK and Greece at 0.18.
The paper comments on the factors that drive increased Winter Deaths – one contributing factor is high energy costs and fuel poverty – thanks to the greens for that.
Regards, Allan
____________________________________
Excess winter mortality in Europe: a cross country analysis identifying key risk factors
By J D Healy
https://jech.bmj.com/content/57/10/784.full
Table 1
Coefficient of seasonal variation in mortality (CSVM) in EU-14 (mean, 1988–97)
CSVM (95% CI)
Austria 0.14 (0.12 to 0.16)
Belgium 0.13 (0.09 to 0.17)
Denmark 0.12 (0.10 to 0.14)
Finland 0.10 (0.07 to 0.13)
France 0.13 (0.11 to 0.15)
Germany 0.11 (0.09 to 0.13)
Greece 0.18 (0.15 to 0.21)
Ireland 0.21 (0.18 to 0.24)
Italy 0.16 (0.14 to 0.18)
Luxembourg 0.12 (0.08 to 0.16)
Netherlands 0.11 (0.09 to 0.13)
Portugal 0.28 (0.25 to 0.31)
Spain 0.21 (0.19 to 0.23)
UK 0.18 (0.16 to 0.20)
Mean 0.16 (0.14 to 0.18)
Well, there is the perfect Trifecta – my work here is done:
In 2002 co-authors Dr Sallie Baliunas, Astrophysicist, Harvard-Smithsonian, Dr Tim Patterson, Paleoclimatologist, Carleton, Ottawa and Allan MacRae wrote:
http://www.friendsofscience.org/assets/documents/KyotoAPEGA2002REV1.pdf
1. “Climate science does not support the theory of catastrophic human-made global warming – the alleged warming crisis does not exist.”
2. “The ultimate agenda of pro-Kyoto advocates is to eliminate fossil fuels, but this would result in a catastrophic shortfall in global energy supply – the wasteful, inefficient energy solutions proposed by Kyoto advocates simply cannot replace fossil fuels.”
Allan MacRae published on September 1, 2002, based on a conversation with Dr. Tim Patterson:
https://wattsupwiththat.com/2009/01/10/polar-sea-ice-changes-are-having-a-net-cooling-effect-on-the-climate/#comment-63579
3. “If [as we believe] solar activity is the main driver of surface temperature rather than CO2, we should begin the next cooling period by 2020 to 2030.”
https://wattsupwiththat.com/2013/12/02/study-predicts-the-sun-is-headed-for-a-dalton-like-solar-minimum-around-2050/#comment-1147149
[excerpt]
3a. “I suggest global cooling starts by 2020 or sooner. Bundle up.”
Alan Macrae:
I agree with you that we will be experiencing a period of cooling, but I would suggest that your work is not done.
The cooling that has begun is being caused by the SO2 emissions from the VEI4 (or VEI4?) eruptions of Ambae (2018, Jul 27), Raikoke (2019, Jun 22), and Ulawun (2019, Jun 26).
The climate record since 1850 shows that some cooling has occurred after essentially every VEI4 or larger volcanic eruption, and there is no reason to expect anything different from these eruptions.
The cooling should continue to increase until mid to late 2020, then warming should resume, unless there are other large eruptions in the interim.
This should be a good test of our differing views as to the cause of climate change.
Burl – based on my research, you are incorrect. Major volcanoes (some VEI5 eruptions like El Chichon 1982 and most VEI6 events like Pinatubo 1991+) cause significant (~0.5C) global cooling – but industrial emission and smaller volcanoes don’t have much impact. Even Mt. St. Helens (VEI5, 1980) did not have much cooling impact because it blew mostly sideways, not up into the stratosphere.
Supporting evidence is in Section 5 of this paper.
CO2, GLOBAL WARMING, CLIMATE AND ENERGY
by Allan M.R. MacRae, B.A.Sc., M.Eng., June 15, 2019
https://wattsupwiththat.com/2019/06/15/co2-global-warming-climate-and-energy-2/
Excel: https://wattsupwiththat.com/wp-content/uploads/2019/07/Rev_CO2-Global-Warming-Climate-and-Energy-June2019-FINAL.xlsx
Alan:
You stated that based upon your research, I am incorrect.
I have also done some research, and I believe that it proves that I am correct.
Between 1850 and 2019 there were 31 La Ninas. As far as I can determine, all were preceded by a volcanic eruption, with the longer El Nino events being caused by another closely-following eruption(s).
Within that group of volcanoes, counting only the first eruption, there were 3 VEI6 eruptions, 3 VEI5 eruptions, 23 VEI4 eruptions, and 2 VEI3 eruptions (which were augmented by increased anthropogenic SO2 aerosol emissions, as were some of the others).
Thus, the smaller eruptions were responsible for the majority of our La Ninas, which are NOT insignificant events!
Eruptions occurring during an El Nino do not cause a La Nina because of the higher ENSO temperatures at the time of eruption (Pinatubo/Cerro Hudson, for example).
(As I had suggested earlier, we should be able to determine who is actually correct within the next 2 years).
VEI2 volcanoes occur on average every two weeks, VEI3 volcanoes occur on average every three months and VEI4 on average every 18 months – volcanoes happen all the time.
https://en.wikipedia.org/wiki/Volcanic_Explosivity_Index
In the modern data record I can see no evidence of volcano-caused significant global cooling (~0.5C) except from El Chichon and Pinatubo.
Alan:
By definition, all La Ninas require an ENSO temperature decrease of (-) 0.5 deg.
They do not, in themselves, appear randomly, but are always preceded by a VEI4 or larger volcanic eruption that spews dimming SO2 aerosols into the stratosphere.
The maximum cooling from a VEI4 eruption generally occurs 12 to 15 months after the date of the eruption, as its aerosols circulate around the globe. Variables include ENSO temperatures at the time of eruption, plume altitudes, geographical location, and amount of SO2 release.
So far, I have found no instances of increases or decreases in average global temperatures not related to changing levels of SO2 aerosols, of either volcanic or anthropogenic origin, in the atmosphere, which excludes any solar or greenhouse gas effects.
But we shall see what the future brings.
RECORD COLD AND SNOW IN USA
A wave of Arctic air shattered record lows in the northern portion of the U.S. this week as bone-chilling cold gripped the northern Rockies and High Plains. In Salt Lake City around 3:37 a.m. Wednesday, a temperature of 14 degrees Fahrenheit set a new daily and monthly record.
Those living in remote northern Utah really had to bundle up early Wednesday, as lows reached minus 46 F in Peter Sinks.
Several cities, including Chicago, Milwaukee and Madison, set new record daily snowfall amounts for the holiday, and October 2019 now ranks among the top five snowiest ever in several locations.
Millions of (actually hundreds of) climate extremists exclaimed “I blame global warming!!!” 🙂
____________________________________
OLD MAN WINTER PLAYS A TRICK ON NORTHERN US
By AccuWeather Staff, Nov. 1, 2019
https://www.accuweather.com/en/weather-news/icymi-unrelenting-winds-fan-devastating-california-fires-old-man-winter-plays-a-trick-on-northern-us-and-tropics-activate-around-the-world/612335
BLAST OF COLD GRIPS NORTHERN ROCKIES AND HIGH PLAINS
We’re in the final stretch of 2019 as we enter November, but it’s still not quite wintertime. That did not stop a wave of Arctic air from shattering record lows in the northern portion of the U.S. this week as bone-chilling cold gripped the northern Rockies and High Plains. In Salt Lake City around 3:37 a.m. Wednesday, a temperature of 14 degrees Fahrenheit set a new daily and monthly record.
Those living in remote northern Utah really had to bundle up early Wednesday, as lows reached minus 46 F in Peter Sinks. That extraordinarily low temperature made it the coldest location in the contiguous U.S. while setting a new record October low for Utah. Records were also smashed on Monday in Wyoming, where subzero temperatures were reported.
Traffic struggles along the snow-packed southbound lanes of Interstate 25 near the Steele Street overpass as an autumn storm sweeps over the intermountain West Tuesday, Oct. 29, 2019, in Denver. Forecasters predict that this second storm in two days will bring up to a foot of snow in some places in the region as well as pack an intense cold that may drop temperatures to possibly record-setting lows. (AP Photo/David Zalubowski)
In addition to the crazy cold that invaded some spots, a snowstorm impacted locations from Idaho to Nebraska. At Denver International Airport, at least 12.2 inches of snow fell, which made it the snowiest October since a decade ago, when 17.2 inches fell. Hundreds of flights were canceled Tuesday, forcing hundreds of travelers to sleep at the airport. Denver’s high of 18 F Thursday tied for the coldest October high temperature on record.
HALLOWEEEN SNOWSTORM HITS MIDWEST, SHATTERS RECORDS
In the Midwest, a winterlike storm dumped snow across the region, breaking a 96-year-old snowfall record in Chicago. This is from the same storm that impacted the Rockies earlier this week after it tracked across the central U.S. Areas like northeastern Kansas, eastern Iowa, Illinois and southern Wisconsin got battered with heavy snow, strong winds and an unrelenting cold.
Up to 6 to 9 inches of snow buried the Upper Midwest as the storm intensified on Halloween. Several cities, including Chicago, Milwaukee and Madison, set new record daily snowfall amounts for the holiday, and October 2019 now ranks among the top five snowiest ever in several locations.
****************************************
RECORD-SETTING HALLOWEEN STORM LEAVES MIDWESTERNERS TIRED OF CLEARING SNOW ALREADY
By Maura Kelly, AccuWeather meteorologist
& Meghan Mussoline, AccuWeather meteorologist
Updated Nov. 1, 2019 11:37 AM
https://www.accuweather.com/en/weather-news/halloween-snowstorm-wallops-the-midwest/611593
In Mukwonago, a suburb of Milwaukee, Halloween looked more like mid-winter on Thursday, and many residents struggled to get through the day.
An intensifying winterlike storm dumped disruptive snowfall across parts of the Midwest on Halloween — and many cities smashed record snowfall amounts for the holiday. The late-month storm pushed October totals to rank among the top five snowiest on record in many locations.
The heaviest snow, up to 6 to 9 inches, buried communities from southern Wisconsin to northern parts of the Lower Peninsula of Michigan. Hundreds of flights were delayed and canceled across the region on Thursday, and roadway conditions deteriorated as the afternoon hours wore on and snowfall rates increased.
In Mukwonago, Wisconsin, the early snowfall caused issues for drivers on the roads. (Image/ABC News One)
It was the snowiest Halloween on record with 5.4 inches falling in Milwaukee, Wisconsin, according to the National Weather Service (NWS). That amount smashed the old record of 0.4 of an inch set back in 1926. Also, the storm total of 5.8 inches which fell from Wednesday into Thursday ranks as the second highest in a single October snowstorm. The old record of 6.3 inches occurred back on Oct. 19 to Oct. 20, 1989.
Nearby Wisconsin’s state capital of Madison also shattered its snowiest Halloween on record. Four inches of snow broke the previous record of 3.2 inches set in 1926, the NWS reported. The storm’s total of 5.1 inches now ranks as the city’s single biggest October snowstorm, breaking the old record of 3.8 inches set from Oct. 26 to Oct. 27 in 1997.
Thursday was the fourth consecutive day on which 1 inch or more of snow has fallen in the city, something that has happened only three other times. The previous streaks had been four days during December 1950, four days during February 2007 and five days during December 1974.
Madison also set a new monthly record of 8.1 inches. That amount surpassed the 5.2 inches of snow recorded in October 1917.
As temperatures slipped a few degrees, roads in the western suburbs became slippery. Flight delays and cancellations were increasing at O’Hare. The airport picked up 3.4 inches of snow on Oct. 31, shattering the record for Halloween snowfall set in 1993 when just a trace was recorded.
Wednesday was also a record snow day, with 1.2 inches falling in the Windy City. That was the earliest snow day in the season on which an inch or more fell since Oct. 20, 1989. In total, 4.6 inches of snow fell in Chicago during October 2019, making it the second snowiest October on record coming in only behind the 6.3 inches set in 1989.
After breaking a snowfall record on Wednesday, Oct. 30, in Chicago, the snow continued to blanket the city on Thursday, Oct. 31, Halloween. (Image/Blake Dava)
Earlier Thursday morning, the Des Moines airport recorded 1 inch of snow, marking the first time Des Moines has recorded two separate snowfall accumulations of more than 1 inch in the month of October, according to the NWS.
Anywhere from 4 to 7 inches of snowfall had buried parts of Iowa by Thursday afternoon, leaving roads in central and eastern parts of the state snow-covered and slick, according to the Iowa Department of Transportation (Iowa DOT). By 1:30 p.m. CDT, a NWS cooperative observer had reported 7 inches of snow in Lowden, Iowa, northwest of Davenport.
More than 240 plows were out in force across eastern and southeastern Iowa on Thursday morning as snow thumped across the area, Iowa DOT tweeted. However, officials cautioned drivers to “buckle up, slow down and allow extra space between vehicles.”
Kids had to trudge through snow in Halloween parades across the area.
Meanwhile, Midwesterners lamented the early-season snowfall that forced them to break out the snow gear.
“I have to clean off my car, and it’s Halloween… not okay,” one Mukwonago, Wisconsin, woman told WISN.
“It sucks, it does,” Don Sanderson of Mukwonago, Wisconsin, said. “But this is my weekly cut-grass insurance, so I’m pretty sure I’m out of that.”
But it wasn’t just the snow that was notable. Cold air plunged into the region as strong winds whipped through the region and the storm strengthened on Thursday.
Thursday’s high of 35 F in Chicago will go down in the history books as the third coldest Halloween since records began in 1871, and it was the coldest since 1917. The average high for Chicago on Oct. 31 is 57 degrees, but on Thursday afternoon, the AccuWeather RealFeel® Temperature hovered in the mid-20s.
Rockford, Illinois, endured its second coldest Halloween on record as the high temperature topped out at 33. It was the coldest holiday since 1905. In 1917, the high climbed to only 32.
Temperatures bottomed out in the teens and 20s in the Chicago area early Friday morning, which is 15-20 degrees below normal.
The same storm system dished out snow and record cold in the Rockies earlier this week.
****************************************
BIG WEATHER CHANGES TO ACCOMPANY CALENDAR FLIP TO NOVEMBER IN EASTERN US
By Jake Sojda, AccuWeather meteorologist
Updated Nov. 1, 2019 12:47 PM
https://www.accuweather.com/en/weather-news/big-weather-changes-to-accompany-calendar-flip-to-november-in-eastern-us/611662
[excerpt]
While September featured average temperature departures around 5 degrees above normal across most of the Midwest and Plains, colder waves in October, including one that froze residents in the Rockies this week, have helped to make October below normal, temperature-wise, for the month as a whole.
This cold air has expanded eastward and is forecast to linger for much of the first half of November. A train of weak storm systems moving across Canada and the northern tier of the U.S. will keep delivering cold shots east of the Rockies, stretching from the Plains all the way to the East Coast.
Heavy jackets, hats, gloves and other apparel people use to stay warm will get plenty of use across the East during the first couple of weeks of November, according to AccuWeather Meteorologist Bill Deger, adding that areas farther west will feel the brunt of the cold.
“The core of the cold will be across the northern Plains,” Paul Pastelok, AccuWeather’s top long-range meteorologist, said. “The cold will also spread south and east but will get modified a bit as it does so.”
****************************************
My closing remark to this endless polemic
https://ourworldindata.org/grapher/annual-number-of-deaths-by-cause
Of course death due to heat or cold does not become irrelevant just because it makes about 50,000 deaths per year compared with 50,000,000 deaths due to other causes. That would be a perverse argumentation.
But we should keep this in consideration, instead of alimenting unnecessary polemic.
More “Bull**** by Bindi”, who wrote this falsehood:
“Of course death due to heat or cold does not become irrelevant just because it makes about 50,000 deaths per year compared with 50,000,000 deaths due to other causes.”
In fact, Excess Winter Deaths in just the USA average about 100,000 per year, and global Excess Winter Deaths exceed 2 MILLION souls per year – not 50,000.
In just England and Wales (excluding Scotland and Northern Ireland), Excess Winter deaths totaled 50,100 in Winter 2017-2018.
https://www.ons.gov.uk/peoplepopulationandcommunity/birthsdeathsandmarriages/deaths/bulletins/excesswintermortalityinenglandandwales/2017to2018provisionaland2016to2017final
I’m offended by the false propaganda spewed by anonymous global warming minions on this thread. If you charlatans are so opposed to fossil fuels, stop using any – now.
Allan McRae
1. Please stop your bullshit claims about what I write, Sir, contact the web site I published a link to, and request for corrections. That would be plain correct.
2. Here is again a stat, this time concerning death causes in the USA:
https://www.healthline.com/health/leading-causes-of-death#diabetes
Where are your 100,000 USA winter deaths?
You can name me a charlatan as long as you want: you discredit yourself by insulting people.
Btw: our house is warmed by… natural gas (NOT: shale gas).
Bindi – your above-referenced article demonstrates that you have no understanding of Excess Winter Mortality.
COLD WEATHER KILLS 20 TIMES AS MANY PEOPLE AS HOT WEATHER
by Joseph d’Aleo and Allan MacRae, September 4, 2015
https://friendsofsciencecalgary.files.wordpress.com/2015/09/cold-weather-kills-macrae-daleo-4sept2015-final.pdf
For all aficionados of this ‘Great Global Cooling Coming Soon’
I don’t believe that this will happen soon! But when I look at the graph below:
https://drive.google.com/file/d/1RL6dA_EtMkZPcMHk-fIwdTgt33JKZPip/view
I think that Northern CONUS very well might experience it during the next years.
This graph shows the yearly absolute TMIN °C average, for the winter months Dec / Jan / Feb, of all available GHCN daily stations located in the following states in Northern CONUS: IA, ID, IL, MI, MN, MT, ND, OR, SD, WA, WI, WY since 1899/1900.
These 12 states were selected because they encompass those stations having shown the lowest daily TMIN temperatures since Dec 1899.
Top 25 of this winter ranking:
1936: -11.47
1917: -10.90
1918: -10.86
2014: -10.83
1929: -10.79
1904: -10.73
1905: -10.62
1910: -10.47
1912: -9.69
1920: -9.57
1937: -9.29
1903: -9.19
2009: -9.19
1916: -9.18
1913: -8.98
1902: -8.97
1922: -8.94
2011: -8.82
2010: -8.71
2008: -8.58
2018: -8.51
1915: -8.47
1928: -8.37
1923: -8.33
1933: -8.31
Despite harsh temperaturues, again due to a polar vortex weakening like in 2018 and especially in 2014, 2019 appears at position 33.
6 of 25 winters belong to the 2000’s… Hmmmh. Cela ne me dit rien de bon!
https://electroverse.net/central-england-experiences-historically-chilly-october/?fbclid=IwAR0qFgXOr1mBJzYbuy2KJtvb62kBOgctsgAW8XjOM9dHnwqIKLHQ5oiFutM
WINTER HAS ARRIVED MONTHS EARLY
NOVEMBER 1, 2019 CAP ALLON
Ian Campbell writes, “The media have to report the record snowfall in the Canadian Prairies, but they tiptoe around the subject, and certainly don’t discuss the ramifications for agriculture. We are in the midst of a federal election campaign here in Canada. Media and politicians are shrieking about “climate crisis”, while the Prairies are buried in winter at the beginning of autumn.” This week high temperatures will be 10 to 40 degrees below average. For those totally hypnotized by the media read that last line again, it does not say above average, it below average meaning to anyone with some rationality left-its getting cooler not warmer.
The elephant in the room, that the press is still trying to hide from us, is the total devastation of crops from the rain and snow and the early arrival of winter in Canada and the United States. Instead of winter coming later, as one would expect if one believed in man-made global warming, the cold is coming earlier.
Colorado ski resort – Earliest opening in more than two decades.
THE CONTINENTAL U.S. JUST SET IT’S COLDEST-EVER OCTOBER TEMPERATURE, BREAKING THE PREVIOUS RECORD FROM 1917
Peter Sinks, Utah –east of Logan– broke the Lower-48’s cold temperature record for the month of October on Monday morning with a staggering reading of minus 35 degrees. What you are going to read in this essay is cold. Historic cold as winter crashes down into the northern hemisphere months early. Its a long story as the cold news events come in hot and heavy. No pun intended but the global warming religion is facing a deep freeze. When there is not supposed to be any snow in winter we were having winter storms in September and devastating winter storms in October burying the unharvested crops. The media, which is really not an honest public serving press any longer, does not see fit to tell the rest of us about new record-low yields, like it does not matter and the rest of the crap they report on does.
“Cold Air Invasion Today,” warns the National Weather Service. A strong cold front will move into the Southern states last Thursday and Friday. High temperatures will be 10 to 30 degrees below average.
Planting delayed in the spring, then harvesting hampered in the fall is an important untold story. The early wave of low temperatures in early October threatened not only onion and potato crops in Idaho, but also sweet corn and dry bean production.
We’re still in October, the U.S. has ALREADY suffered 3 historic harvest-wrecking snowstorms, broken 3,575 all-time low temperature records by the 18th, according to NOAA, and Halloween has a great chance of registering below-freezing temperatures in all 50 U.S. states.
RARE OCTOBER SNOWSTORM BURIES THE TEXAS PANHANDLE THUNDERSNOW CAPTURED ON VIDEO
Typically, such cold isn’t seen until late December through February. The previous premature big-freeze was on November 18, 2014, and even that was incredibly early, prompting meteorologist Tim Buckley to write: “This typically happens a few times during winter, but is very rare this early in the season.” And this year’s first 50-state-freeze is set to beat that by almost THREE WEEKS. Sounds like really warm news!
Why is this all happening? THE SUN HAS BEEN SPOTLESS FOR A TOTAL OF 224 DAYS IN 2019, AND COUNTING… LOOMING GRAND SOLAR MINIMUM. Just so happens that the sun has a bigger influence on climate than all the CO2 global warming alarmists can dream of.
There are no words to describe the theft of truth. Here we are, on the cliff of entering a mini-ice age, with stupendous consequences for life, civilization and our bellies, and we have criminal psychopaths screaming about the world ending, real soon, from man-made global warming. Who do they think they are kidding? They do have millions confused. We have been constantly bombarded with global warming news which tells us not to believe with our own eyes, hear with our own ears, feel with our own skin. There are people whose basic lust in life is to control citizens’ thoughts, speech and access to information.
RUSSIA BREAKS MULTIPLE 116 YEAR-OLD COLD RECORDS
If you think I making this all up we have a global network of 500 scientists and professionals testifying that there is no climate emergency, not an out of control hot one at least. That did not stop the BBC, which recently went into full climate hysteria warning us that we have only 18 months to get it together to avoid climate catastrophe.
RARE OCTOBER SNOWSTORM BURIES THE TEXAS PANHANDLE
A RECORD-BREAKING 31.6 INCHES OF SNOW HAS ALREADY ACCUMULATED IN GREAT FALLS, MT
BBC Warns Snow to Hit England Last Week of October Issues Danger to Life Warning
Arctic storm to unleash deep freeze across Europe at End of October
Democratic Rep. Alexandria Ocasio-Cortez of New York warned in January that “the world is going to end in 12 years if we don’t address climate change.” Then in May Ocasio-Cortez said “you’d have to have the social intelligence of a sea sponge” to take her literally when she invoked a 12-year deadline to stop “world ending” global warming.
A low of -5.5C (22F) was observed in Scotland October 22 — which came within just a few degrees of the UK’s all-time coldest temperature for the date set back in 1880.
Back in 2014 The Wall Street Journal reported, “The assertion that 97% of scientists believe that climate change is a man-made, urgent problem is a fiction.” Most scientists are not into fantasy like politicians tend to be. In fact more than 31,000 scientists believe “there is no convincing scientific evidence that human release of carbon dioxide, methane, or other greenhouse gases is causing or will, in the foreseeable future, cause catastrophic heating of the Earth’s atmosphere and disruption of the Earth’s climate.”
Physicist Vladimir Paar has already been predicting a time when most of central Europe will be covered in ice again. It is inevitable—a coming Ice Age—it’s Nature, it’s a cycle, it’s the sun doing what it always does and it probably also has something to do with orbital cycles.
The head of the Space Research section of the Russian Academy of Science, Professor Khabibullo Abdussamatov, in 2006, issued a press release, warning that the world should prepare for imminent global cooling. He predicted that the next ice age would start in 2012 – 2015, and would likely peak around 2055. He was looking to the most obvious reason global cooling is happening—the sun.
Violent Climate Change is Cold and Wet
In early October, Denver experienced bright, sunny, almost summer-like weather with 83 degree temperatures. But on Thursday, just before midnight, the temperature in the city plunged to a wintry 13 degrees — a record low for this time of year. That is a 70 degree drop! What did the mainstream press say about whats going on in the mid west, Another storm to keep chilly air in place across northern Plains through midweek
A few weeks ago the death toll rose to 5 as flooding paralyzes Houston area. The remnants of Imelda dumped up to 43 inches of rain within three days in the areas between Winnie and Beaumont, east of Houston. Most of that rain fell in just 24 hours.
Michael Snyder writes, “An unprecedented October blizzard that hit just before harvest time has absolutely devastated farms all across the U.S. heartland. As you will see below, one state lawmaker in North Dakota is saying that the crop losses will be “as devastating as we’ve ever seen”. This is the exact scenario that I have been warning about for months, and now it has materialized. Due to endless rain and horrific flooding early in the year, many farmers in the middle of the country faced very serious delays in getting their crops planted. So we really needed good weather at the end of the season so that the crops could mature and be harvested in time, and that did not happen. Instead, the historic blizzard that we just witnessed dumped up to 2 feet of snow from Colorado to Minnesota. In fact, one city in North Dakota actually got 30 inches of snow. In the end, this is going to go down as one of the worst crop disasters that the Midwest has ever seen, and ultimately this crisis is going to affect all of us.”
Spain had its worst storm in over a century in September but the American media did not report it. An extreme ‘Gota Fria’ –meaning ‘Cold Drop’–battered practically ALL of Spain in September. A succession of frigid polar fronts drove temps some 16C below-average across vast swathes of the country, brought torrential rain and floods to many, and even spawned a tornado in Alicante.
THE TOP CLIMATE SCIENTIST WHO EXPOSED NOAA AS FRAUDS: “YOU NEVER CHANGE GOOD DATA TO AGREE WITH THE BAD, BUT THAT’S WHAT THEY DID”
Nothing Unusual About Winter Coming in October?
NORTH AMERICA SUFFERS “UNBELIEVABLE” SNOWFALL TOTALS — STATE OF EMERGENCY DECLARED IN CANADA
Parts of the nation that were mowing lawns two weeks ago broke out snow shovels as a sprawling storm sweeping across the West threatened to develop into an “all-out blizzard” over the Dakotas, where a blizzard warning has been issued. AccuWeather meteorologist Geoff Cornish said some parts of Montana have seen a foot or two of snow.
In 2000, Dr. David Viner, a senior research scientist at University of East Anglia’s climate research unit, predicted that in a few years winter snowfall would become “a very rare and exciting event. Children just aren’t going to know what snow is.”
U.S. crops have deteriorating conditions, while harvest pace drops below half of the country’s average. As of a 15 days ago many farmers continued to wait on the sidelines to get into the fields. With freezing temperatures, heavy snowfall, and high winds set to hit the northern Plains last week, the corn in North Dakota was only 22% mature vs. a 75% five-year average, according to last Monday’s USDA Crop Progress Report.
Also, South Dakota corn was rated 36% mature vs. an 80% five-year average. Minnesota farmers have a corn crop that is just 39% mature vs. an 83% five-year average. In last weeks Crop Progress Report, the USDA pegged the U.S. corn harvest at 15% complete vs. an 27% five-year average. USDA rated the crop in the mature stage at 58% vs. 85% five-year average, the slowest on record.
A literal plague of new all-time cold records was already spreading across Western & Central U.S. last Friday, October 11.
IMG_256
NEVER MIND A WHITE CHRISTMAS, THE UK COULD BE ON COURSE FOR A WHITE HALLOWEEN!
JAMESTOWN, NORTH DAKOTA DIGS OUT FROM RECORD BREAKING SNOWFALL: “[WE’VE] NEVER SEEN ANYTHING LIKE THIS BEFORE”
CENTRAL ENGLAND EXPERIENCES HISTORICALLY CHILLY OCTOBER
NOVEMBER 1, 2019
https://electroverse.net/central-england-experiences-historically-chilly-october/?fbclid=IwAR0qFgXOr1mBJzYbuy2KJtvb62kBOgctsgAW8XjOM9dHnwqIKLHQ5oiFutM
The UK’s October 2019 sure felt like a chilly one, but now official Met Office temperature data has confirmed it — Central England just experienced a month on par with those of the mid-to-late 1600s.
The Central England Temperature (CET) record measures the monthly mean surface air temperatures for the Midlands region of England, and is the longest series of monthly temperature observations in existence, anywhere in the world.
Its mean reading for October 2019 came in at a nice round 10C — that’s 0.7C below the already cool 1961-1990 average (the current standard period of reference for climatological data used by the WMO).
In the 360 years of CET data there have only-ever been 9 other years with an October average temperature of 10C — these are 1659, 1660, 1663, 1668, 1669, 1670, 1672, 1679, and 1722.
Note how ALL of these years fall within the Maunder Minimum:
Greetings, I have not had the opportunity to read all of the comments. The observations are very interesting. I would add another observation that I feel is significant. the great Lakes contain around 20% of all of the fresh water on earth. The temperature of the entire mass is a stable proxy for climate as changes can not fluctuate rapidly because of “weather”. It is interesting to note that the temperature of the deep water in the Great Lakes has a cooling trend. This trend is antithetical to the theory of CAGW.
”
Krishna Gans October 30, 2019 at 4:00 pm
As at this time I was in South of France Aug. / Sept, I followed the news there.
The biggest problem had older persons, ill persons, and, it was precisely named, they didn’t drink enough. The services hasn’t been prepared to such situations, there wasn’t enough personal to protect these elder and/ or ill persons.”
____________________________________
Right, everybody knows –
https://www.google.com/search?q=elder+persons+don%27t+eat+enough+don%27t+drink+enough&oq=elder+persons+don%27t+eat+enough+don%27t+drink+enough+&aqs=chrome.
https://www.google.com/search?client=ms-android-huawei&sxsrf=ACYBGNSpKaprhg2XfgOzv3owU5vMsH5zqg:1572943966857&q=older+persons+don%27t+eat+enough+don%27t+drink+enough&spell=1&sa=X&ved=2ahUKEwj8i5Xz2NLlAhV166YKHThKDN4QBSgAegQICxAC&biw=360&bih=518
Fazit: https://www.google.com/search?q=i+can%27t+help+about+the+shape+i%27m+in&oq=I+can%27t+help+about+&aqs=chrome.
NEXT WEEK’S ARCTIC BLAST WILL BE SO COLD, FORECASTERS EXPECT IT TO BREAK 170 RECORDS ACROSS US
USA TODAY, Nov.8, 2019
This week’s cold snap is only an appetizer compared with the main Arctic blast that’s coming next week, meteorologists said. That freeze could be one for the record books.”
“The National Weather Service is forecasting 170 potential daily record cold high temperatures Monday to Wednesday,” tweeted Weather Channel meteorologist Jonathan Erdman. “A little taste of January in November.”
The temperature nosedive will be a three-day process as a cold front charges across the central and eastern U.S. from Sunday into Tuesday.
The front will plunge quickly through the northern Plains and upper Midwest Sunday, into the southern Plains and Ohio Valley Monday, then through most of the East Coast and Deep South by Tuesday, the Weather Channel said.
_____________________________________
Some people will say this cooling is caused by CO2 and global warming. They will be wrong.