By Allan MacRae and Joseph D’Aleo, October 2019
Introduction – Catastrophic Anthropogenic Global Warming – A Failed Hypothesis
The Catastrophic Anthropogenic Global Warming (“CAGW”, aka “Global Warming”, “Climate Change”, “Climate Crisis”, “Climate Emergency”) scare is a failed hypothesis and the greatest scientific fraud in history. Global warming alarmism has been promoted by political extremists and believed in by their gullible acolytes for decades, even though there is no credible evidence that catastrophic global warming exists in reality, and ample evidence that the CAGW hypothesis has been falsified.
The failed CAGW hypothesis assumes that increasing atmospheric CO2 from fossil fuel combustion drives dangerous runaway global warming. The alleged evidence for this fraud is climate computer models that greatly over-predict current observed warming, typically by 300 to 500%. These climate models deliberately employ excessively high assumed values of climate sensitivity to CO2, and are designed to create false alarm.
Global warming has slowed since the mid-1990’s, so the climate alarmists alleged that increased atmospheric CO2 from combustion of fossil fuels will cause wilder, more chaotic weather. There is ample evidence that this allegation is also false. Weather has actually become less chaotic.
The Mann hockey stick (MBH98 etc.), the Climategate emails, historical temperature data revisions and the thuggish tactics of the climate extremists provide ample evidence of fraud.
Credible Evidence That CO2-Driven Global Warming/Climate Change Alarmism Is A False Crisis
Atmospheric CO2 concentrations have been much higher in geologic time, and runaway global warming has never occurred in the billions of years of Earth history. Global temperatures have been much warmer and also much colder over geologic time. Earth is now in a glacial period, when mile-thick ice sheets cover much of the planet for about 100,000 years, interrupted by interglacials that last about 10,000 years. Earth is now in a warm interglacial, but the last glaciation ended only about 10,000 years ago, so Earth is due for another glaciation.
Temperatures were much higher during the Medieval Warm Period circa 900-1300 AD, and then humanity experienced the Little Ice Age circa 1300-1850 which caused enormous suffering and the deaths of millions.
The USA has some of the best surface temperature data in the world. The hottest USA surface temperature records occurred in the 1930’s, before fossil fuel combustion accelerated circa 1940.

Fossil fuel combustion accelerated strongly at the start of World War II, and global temperatures COOLED significantly from 1940 to 1977. That one observation is sufficient to disprove the CAGW hypothesis – global temperatures do NOT rise catastrophically due to increasing atmospheric CO2.
Even if it is assumed that ALL the observed global warming is ascribed to increasing atmospheric CO2, the following two studies calculated that the MAXIMUM climate sensitivity to a hypothetical doubling of atmospheric CO2 is only about 1 degree C, which is too low to cause dangerous global warming.
Christy and McNider (2017) analysed UAH Lower Troposphere data since 1979.
Lewis and Curry (2018) analysed HadCRUT4v5 Surface Temperature data since 1850.
That 1C/doubling is not an average, it is a MAXIMUM climate sensitivity, since some or most of the observed warming could be due to natural causes. Repeating, climate computer models used by the IPCC and other global warming alarmists employ climate sensitivity values 3-to-5-times higher than 1C/doubling, in order to create false fears of dangerous global warming.
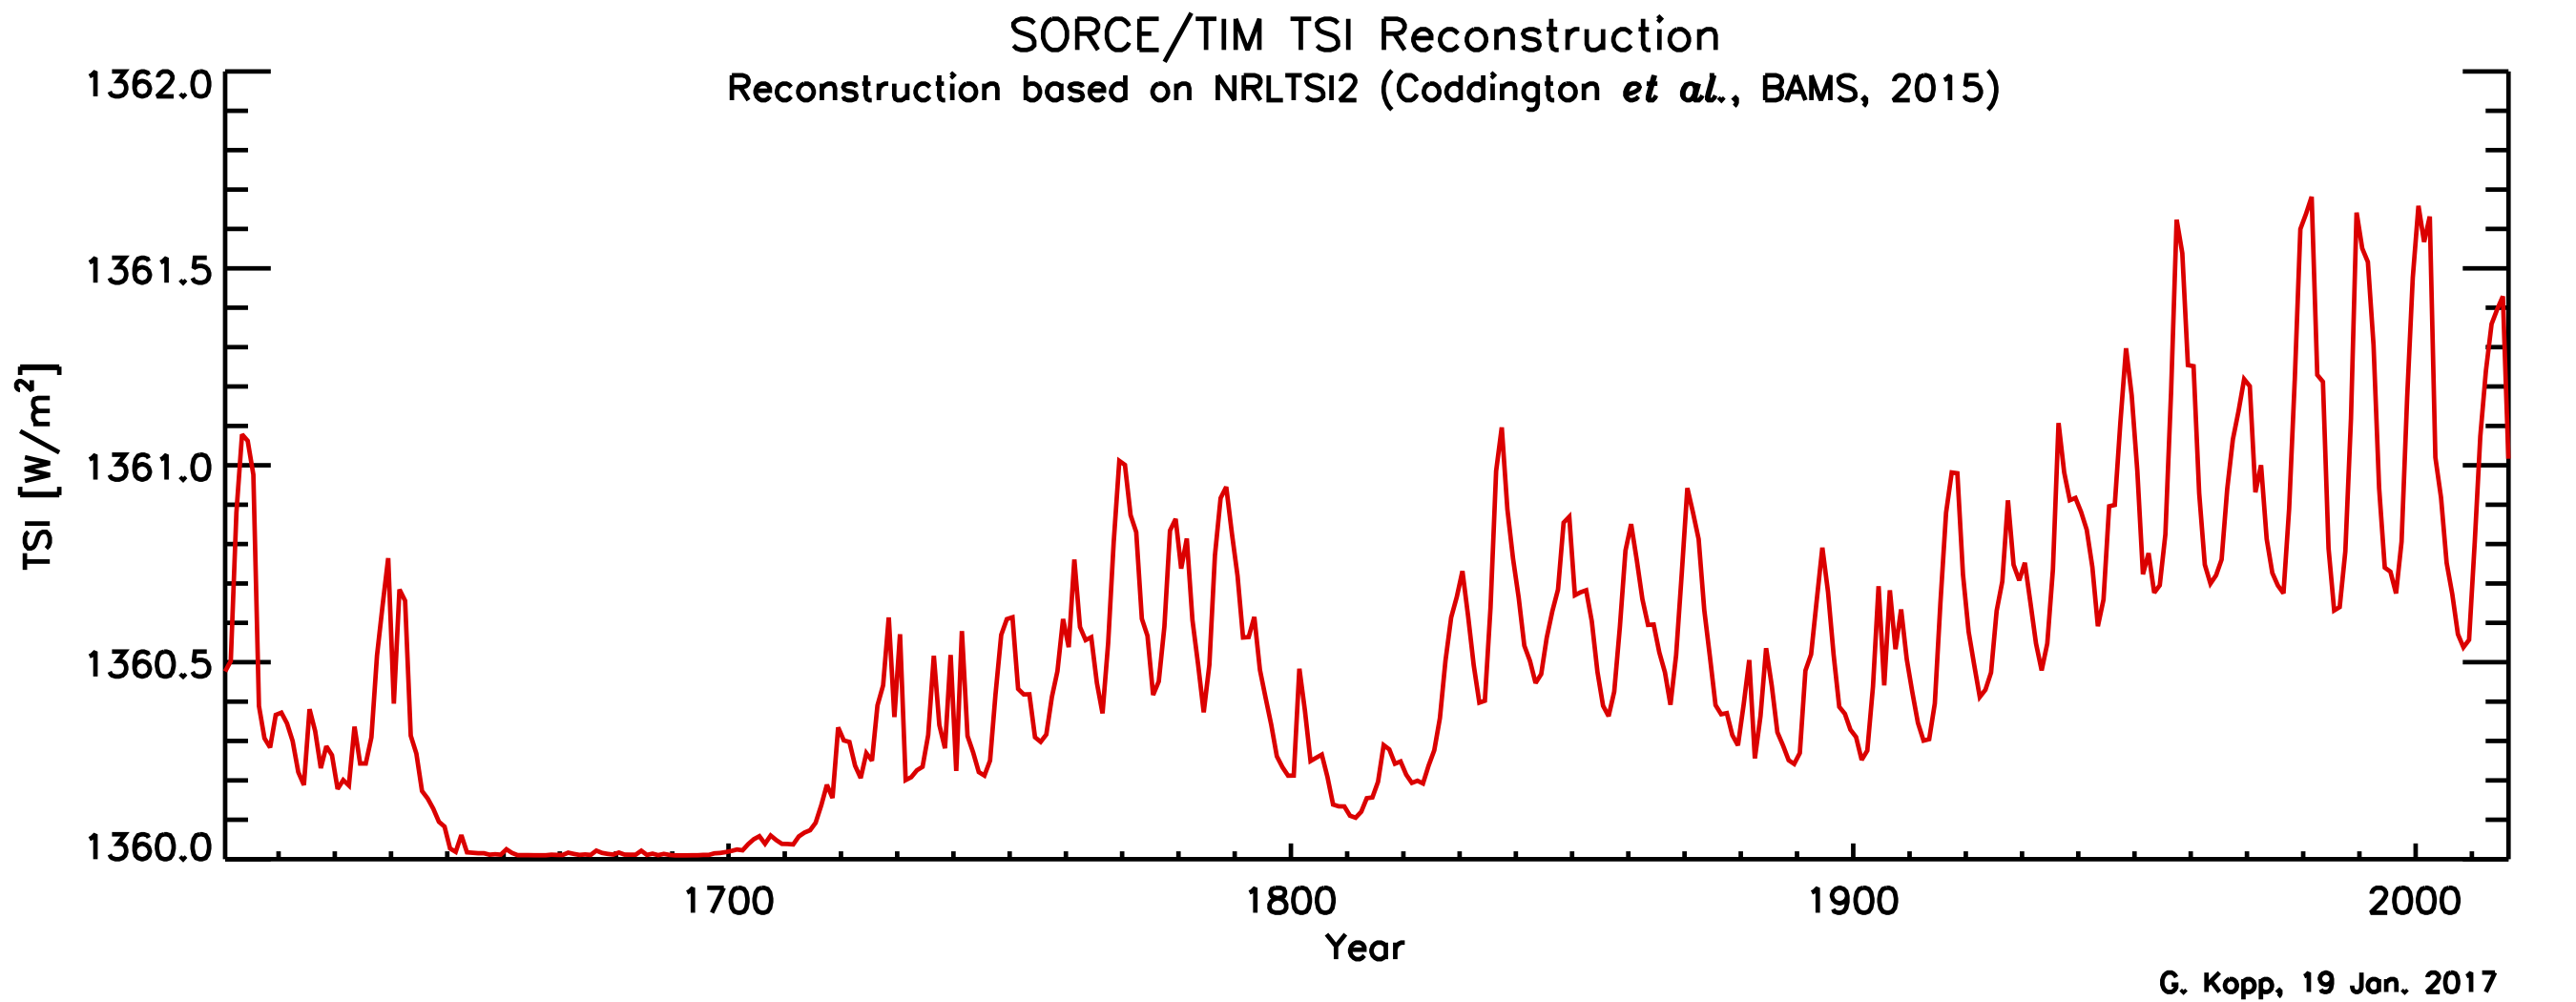
It is highly probable, based on the evidence, that solar activity, not atmospheric CO2, is the primary driver of Earth’s temperature. In astrophysicist Willie Soon’s recent video, he shows the Sun-Climate relationship and provides his conclusions. There is strong correlation between the Daily High Temperatures and the Solar Total Irradiance (54:51 of the video):
… in the USA (55:02),

Canada (55:16),

and Mexico (55:20).

Solar Total Irradiance is now close to 1360 W/m2, similar to the lows of very cold periods circa 1700 and 1800. Atmospheric temperatures should be cooling in the near future – maybe they already are.

http://woodfortrees.org/plot/pmod/offset:-1360/scale:1 Note: Offset = -1360 means 0 = 1360.
We do know that the Sun is at the end Solar Cycle 24 (SC24), the weakest since the Dalton Minimum (circa 1800+), and SC25 is also expected to be weak. We also know that both the Dalton Minimum and the Maunder Minimum (~1650 to ~1700) were very cold periods that caused great human suffering.

http://lasp.colorado.edu/home/sorce/files/2011/09/TIM_TSI_Reconstruction-1.png
Global temperature is certainly NOT primarily driven by increasing atmospheric CO2, because CO2 changes LAG global temperature changes in time, both in the ice core proxy record and also in the modern data record. The Vostok ice core record shows a lag of CO2 after temperature of ~~800 years.

In January 2008, Allan MacRae made the following major observations in this paper.
Reference: “Carbon Dioxide Is Not The Primary Cause Of Global Warming”, January 2008
http://icecap.us/images/uploads/CO2vsTMacRae.pdf
a. The velocity of changes of atmospheric CO2 [dCO2/dt] varies ~contemporaneously with changes in global temperature.
b. Therefore the integral of dCO2/dt, changes in atmospheric CO2, lag changes in global atmospheric temperature by ~9 months.
The very close relationship of dCO2/dt (red) vs global temperature (blue) is clearly apparent. Major volcanoes (some VEI5 and most VEI6 events) disrupt the relationship.

Integrating the dCO2/dt data gives changes in CO2, which lag changes in temperature by ~9 months.
The above figures employ Mauna Loa (mlo) CO2 data. Similar results were observed using global CO2 data, as in MacRae 2008. The impact of major volcanoes is apparent.
The 12-month delta in CO2 is used to allow for the “seasonal sawtooth” in the Keeling Curve.
The ~9-month lag of atmospheric CO2 changes (red) after temperature changes (blue) is apparent.

In January 2013, a similar observation was made by Humlum, Stordahl and Solheim – that atmospheric CO2 changes lag global sea surface and air temperature changes by 9-12 months.
Reference: “The phase relation between atmospheric carbon dioxide and global temperature”
https://www.sciencedirect.com/science/article/pii/S0921818112001658
a. Changes in global atmospheric CO2 are lagging 11–12 months behind changes in global sea surface temperature.
b. Changes in global atmospheric CO2 are lagging 9.5–10 months behind changes in global air surface temperature.
c. Changes in global atmospheric CO2 are lagging about 9 months behind changes in global lower troposphere temperature.
“The phase relation between atmospheric carbon dioxide and global temperature”, January 2013

Our Predictive Track Record Is Excellent; The IPCC and Acolytes Have Been Consistently Wrong.
The ability to predict is probably the best objective measure of scientific competence. The IPCC and its global warming alarmists have consistently failed – every one of their scary global warming/climate change predictions has failed to happen.
“Climate science does not support the theory of catastrophic human-made global warming – the alleged warming crisis does not exist.”
“The ultimate agenda of pro-Kyoto advocates is to eliminate fossil fuels, but this would result in a catastrophic shortfall in global energy supply – the wasteful, inefficient energy solutions proposed by Kyoto advocates simply cannot replace fossil fuels.”
Both these above statements are demonstrably correct to date. Despite accelerating combustion of fossil fuels, especially since 1940, and increases in in atmospheric CO2 measured since 1958, the world has experienced only hugely beneficial increases in crop yields and mild, beneficial global warming.
Despite the decades-long campaign to eliminate them, fossil fuels have retained their 85% share of global primary energy, and the rest is mostly nuclear and hydro. Despite tens of trillions of dollars in squandered subsidies, green energy still comprises only 4% of global primary energy. Due to intermittency, grid-connected green energy schemes do not even significantly reduce CO2 emissions, since they require almost 100% spinning-reserve, typically fossil fueled, to fill-in when the wind does not blow or the sun does not shine.
CO2 Concentration is Far Too Low; Earth Is Colder-Than-Optimum for Humanity and the Environment
The radical greens could not be more wrong. Contrary to green propaganda, atmospheric CO2 is far too low, and Earth is colder-than-optimum for humanity and the environment.
Atmospheric CO2 concentration is not too high – it is far too low for optimal plant and crop growth, and far too low for the continued survival of terrestrial life on Earth. CO2 reduction and sequestration schemes are not just wrong; they are costly, destructive and imbecilic.
Cold weather kills about 20 times as many people as warm and hot weather. Excess Winter Deaths in the USA average about 100,000 per year – equivalent to two 9-11’s per week for 17 weeks EVERY YEAR.
Excess Winter Deaths are calculated as the difference between deaths in the four winter months (December to March in the Northern Hemisphere) less half the deaths in the eight non-winter months.
Excess Winter Deaths occur worldwide, even in warm countries like Thailand and Brazil. An approximate-low estimate of Excess Winter Deaths is 2 million souls per year worldwide.
More than 50,000 Excess Winter Deaths occurred in England and Wales during the winter of 2017-18 – an Excess Winter Death rate about THREE TIMES the per-capita average in the USA and Canada. Proportionally, that is about 35,000 more deaths in the UK than the average rates of the USA and Canada. Excessively high energy costs in the UK due to false global warming/anti-fracking hysteria are a major part of the cause of these Excess Winter Deaths – driven by global warming alarmists and their corrupted minions in governments and institutions.
Predictions of Imminent Global Cooling, Starting Anytime Soon
“Over the past one thousand years, global temperatures exhibited strong correlation with variations in the sun’s activity. This warming and cooling was certainly not caused by manmade variations in atmospheric CO2, because fossil fuel use was insignificant until the 20th century.
Temperatures in the 20th century also correlate poorly with atmospheric CO2 levels, which increased throughout the century. However, much of the observed warming in the 20th century occurred before 1940, there was cooling from 1940 to 1977 and more warming after 1977. Since 80 per cent of manmade CO2 was produced after 1940, why did much of the warming occur before that time? Also, why did the cooling occur between 1940 and 1977 while CO2 levels were increasing? Again, these warming and cooling trends correlate well with variations in solar activity.
Only since 1977 does warming correlate with increased CO2, but solar activity also increased during this period. This warming has only been measured at the earth’s surface, and satellites have measured little or no warming at altitudes of 1.5 to eight kilometres. This pattern is inconsistent with CO2 being the primary driver for warming. If solar activity is the main driver of surface temperature rather than CO2, we should begin the next cooling period by 2020 to 2030.”
For the past ~five years, MacRae has written that global cooling would start closer to 2020. This global cooling will start sporadically, at different locations in the world. Similar predictions of global cooling are included in the Appendix.
It is notable that planting of crops has occurred one month later-than-usual in North-central growing areas of North America in both 2018 and 2019. In 2019, there were many more record U.S. all-time daily low temperatures than record highs for the last 30 days, 365 days and year-to-date. These events may just be weather, not climate, or they could be the early indicators of global cooling.
The U.S. Department of Agriculture publishes a weekly crop report:
Crop Progress NASS Weekly, Mondays
https://usda.library.cornell.edu/concern/publications/8336h188j
The October 21, 2019 report is here: https://downloads.usda.library.cornell.edu/usda-esmis/files/8336h188j/qr46rf238/fx71b191j/prog4319.pdf


The North-central 2019 harvest was hit hard by wet, cold weather. Meteorologist Joe D’Aleo explains:
The growing season in North America has been especially challenging.
| Crop Challenges 2019
· Greatly delayed or aborted planting ° 19 million acres did not get planted. ° Late cold, snow, rain and flooded fields. · Shallow roots caused by excess rain · Soil Compaction · Mid to late summer dryness and heat to the South and East. · North-central growing areas saw excessive rainfall AND not enough sun or Growing Degree Days · Early snows in Northwest growing areas · Half the corn and soybean crop was not mature enough to harvest until mid-October · The soybeans and corn still in the field are delaying the planting of winter wheat |

The cold weather that developed early in the year persisted through the summer into the fall in the North-central region, which helped move warmth into the Southeast. Heavy rains fell along the contrast zone between the extremes.

With the cold, the Growing Degree Days were well below normal in North-central growing areas, and above in the Southeast.

See the heavy rains in the central Corn Belt early in the growing season, shifting Northwest late.

Corn and soybeans progress on average trailed well behind the normal.

Corn maturity as of October 20th 2019 was most behind in the Dakotas Southeast to the Great Lakes and Ohio Valley. Note the much better conditions in the South.

Newman’s analysis of 1980 showed the ideal growing areas of the Corn Belt would shift North with warming and South with cooling by approximately 144 kilometers per 1°C. The current corn growing area is shaded.

Newman, J. E. (1980). Climate change impacts on the growing season of the
North American Corn Belt. Biometeorology, 7 (2), 128-142.
The 2019 soybean harvest also trailed the 5-year average by 18% though the leaf drop was just 3% behind average.

Even where the first freezing temperatures came on time, the delays meant losses of corn not reaching black layer maturity and soybeans that had not dropped their leaves.

Very early snows arrived with the early cold in the North-central region affecting corn, soybeans, spring wheat and small grains, there and in parts of the Canadian Prairies.

The yield estimate on October 10th marks the first season in 6 years below the trend line.

Production estimates are down slightly but are expected to decline further after the effects of the early cold and snows are considered.

The soybean yield also is below trend line for the first year in 6 years. Projected soybean production is down more than corn production.


More areas will see below freezing temperatures and even snow before November.


Summary and Conclusions
It is notable that crop planting has occurred one month later-than-usual in the North-central growing areas of North America in both 2018 and 2019. While warm summer weather saved the 2018 crop, in 2019 the Northern corn and soybean harvests were devastated by a cold summer and early cold weather. In 2019, there were many more record U.S. all-time daily low temperatures than record highs. These events may just be weather, not climate, or they could be the early indicators of global cooling.
Appendix – Other Predictions of Global Cooling, In Chronological Order Since 2003:
In 2003, Dr. Theodor Landscheidt wrote a paper predicting serious global cooling:
“Analysis of the sun’s varying activity in the last two millennia indicates that contrary to the IPCC’s speculation about man-made global warming as high as 5.8° C within the next hundred years, a long period of cool climate with its coldest phase around 2030 is to be expected.”
In 2005, Piers Corbyn predicted cooling by 2040.
On the 2nd February 2005, he gave this presentation to the Institute of Physics Energy Management Group. It contained the following statement:
“In the next 5 or 10 years warming is likely to be maintained as a transpolar shift occurs. This will be followed by the magnetic pole moving away from the geographic pole, a decrease in solar activity, a Southward shift in the Gulf Stream and considerable world cooling by 2040 AD.”
In 2006, NASA predicted that
“Solar Cycle 25, peaking around the year 2022, could be one of the weakest in centuries”.
Khabibullo Abdusamatov and colleagues at the Russian Academy of Science stated in 2006:
“Global cooling could develop on Earth in 50 years and have serious consequences before it is replaced by a period of warming in the early 22nd century…
On the basis of our [solar emission] research, we developed a scenario of a global cooling of the Earth’s climate by the middle of this century and the beginning of a regular 200-year-long cycle of the climate’s global warming at the start of the 22nd century.”
Khabibullo Abdusamatov said he and his colleagues concluded that a period of global cooling similar to one seen in the late 17th century – when canals froze in the Netherlands and people had to leave their dwellings in Greenland – could start in 2012-2015 and reach its peak in 2055-2060.
He said he believed the future climate change would have very serious consequences and that authorities should start preparing for them today because “climate cooling is connected with changing temperatures, especially for Northern countries.
Nigel Weiss, University of Cambridge, stated in 2006:
“If you look back into the sun’s past, you find that we live in a period of abnormally high solar activity. Periods of high solar activity do not last long, perhaps 50 to 100 years, then you get a crash. It’s a boom-bust system, and I would expect a crash soon.”
Leif Svalgaard, Stanford University, stated in 2006:
“Sunspot numbers are well on the way down in the next decade. Sunspot numbers will be extremely small, and when the sun crashes, it crashes hard. The upcoming sunspot crash could cause the Earth to cool.”
In 2007, Lin Zhen-Shan and Sun Xian wrote in “Multi-scale analysis of global temperature changes and trend of a drop in temperature in the next 20 years”:
“… Signs also show a drop in temperature in China on century scale in the next 20 years. (4) The dominant contribution of CO2 concentration to global temperature variation is the trend. However, its influence weight on global temperature variation accounts for no more than 40.19%, smaller than those of the natural climate changes on the rest four timescales. Despite the increasing trend in atmospheric CO2 concentration, the patterns of 20-year and 60-year oscillation of global temperature are all in falling. Therefore, if CO2 concentration remains constant at present, the CO2 greenhouse effect will be deficient in counterchecking the natural cooling of global climate in the following 20 years. Even though the CO2 greenhouse effect on global climate change is unsuspicious, it could have been excessively exaggerated. It is high time to re-consider the trend of global climate changes.”
“The very close relationship of dCO2/dt (red) vs global temperature (blue) is clearly apparent. “
Yup, still there is more CO2 going into the oceans than coming out of it.
Get your balance sheet right.
Get your balance sheet right.
Silly comment.
I am NOT saying that Temperature is the only driver of increasing CO2. Others say that – Not me.
From my June 2019 paper:
Atmospheric CO2 is increasing, and the conventional view is that this CO2 increase is human-made, caused by fossil fuel combustion, deforestation, etc. While this is scientifically important, it is not necessary to debate this point in order to disprove global warming alarmism.
Scientists including Salby, Berry and Harde have hypothesized that the increase in atmospheric CO2 to more than 400 ppm is largely natural and not mostly human-made.
While my 2008 observations support this hypothesis, I have considered this question for ~11 years, and am still agnostic on the conclusion.
Regardless of the cause, the increase in CO2 is strongly beneficial to humanity and the environment.
It could be largely natural. The annual cycles of CO2 are certainly natural, and larger in magnitude than human emissions and the overall trend. Someday we’ll know.
So if CO2 levels start dropping, will those numbers be fudged like the temp data??
“BFL October 28, 2019 at 9:01 am
So if CO2 levels start dropping, will those numbers be fudged like the temp data??”
Not necessary, BFL. Pas convaincant.
Maybe the next claim is woiperdinger devastated their data.
https://www.google.com/search?client=ms-android-huawei&biw=360&bih=518&sxsrf=ACYBGNQv9Cgl5Xt_Fj5SVCikveA_iPC1UQ%3A1572880200128&ei=SD_AXeO6B-iEwPAP0uWAkAE&q=wolpertinger+for+sale&oq=wolpertinger+for+sale&gs_l=mobile-gws-wiz-serp.
Dear Mr. George, regarding human evolution:
Hominids first appeared at the beginning of the Pleistocene ~2 mya — coincidently with the coolest global conditions in ~240 my and after ~50 my of global temperature decline since the Eocene optimum.
Yes, we arose in the tropics and are tropical animals, but the key factor in our evolution was the domestication of fire. We thrived as a species precisely because we could make fire — for cooking, warmth, light, protection from predators, ease in catching prey, and manipulation of the environment to enhance survival. Our bodies are adapted to artificial energy creation and use. Our intelligence and in-group cooperation revolve around the hearth. Making, feeding, and using fire made us human. We are fire creatures, the only fire creatures in the history of life.
The authors make the persuasive case that the Earth is cooling and perhaps sliding into another glacial stadial. The pressing question is: what can we as a species do, if anything, to prevent or delay global cooling? If the answer is nothing, then how might we adapt without undo suffering and precipitous human population decline?
Very good post – beautifully written, thank you Mike. “We are fire creatures, the only fire creatures in the history of life.” Beautiful!
Re “The authors make the persuasive case that the Earth is cooling and perhaps sliding into another glacial stadial.”
To clarify, I think moderate cooling is imminent, like the ~1940-1977 cooling period or even the Dalton (I pray not like the Maunder), but I have no opinion on the timing of the next major (continental) glaciation, because I have not studied it.
I really hope we are not there yet – but we should at least be thinking about what to do when the next continental glaciation starts – maybe albedo control of the ice sheet?
Best, Allan
Thanks Mike, good point.
We should all remember to give credit to our ancestors for the fact we are alive; the fortunate product of billions of years of successful parents.
“The authors make the persuasive case that the Earth is cooling and perhaps sliding into another glacial stadial. ”
The Author: “we should begin the next cooling period by 2020 to 2030”
Mike, like the old promise of free beer tomorrow you’re persuaded by a blog opinion but not by decades of data from multple sources?
 ?itok=RPG6MRlA
You must really want to be persuaded.
Loydo, free beer is around next corner:
https://www.google.com/search?q=free+beer+for+sale&oq=free+beer+for+sale&aqs=chrome.
There is a recent Chinese study based on sedimentary analysis claiming a 250 year period of cooling is ushering in.
https://www.scmp.com/news/china/science/article/3022136/china-scientists-warn-global-cooling-trick-natures-sleeve
This is the second paper I’ve written with veteran meteorologist Joseph D’Aleo. Our first paper was published in 2015 on Excess Winter Mortality.
https://friendsofsciencecalgary.files.wordpress.com/2015/09/cold-weather-kills-macrae-daleo-4sept2015-final.pdf
Joe is one of the best meteorologists on the planet – this story illustrates how very competent he and the team at Weatherbell are, based on their strong predictive track record.
The U.S. National Weather Service (NWS) forecast a warm winter for 2014-15, and Joe called me in October 2014 to say he was concerned that the NWS forecast was seriously incorrect, and that the next winter would be particularly cold and snowy, especially in the populous Northeast. This was the second consecutive year that the NWS has made a very poor (excessively warm) Winter forecast.
Joe and I had been working together on a paper on Excess Winter Mortality, and we agreed that this incorrect “warm winter” NWS forecast was dangerous, especially if the country and its people were unprepared.
I proposed an approach, and we sent a presentation for my friend at the US Energy Information Administration (EIA). At the EIA’s request, Joe prepared his own monthly Winter Forecast by region for the EIA, who re-ran their winter energy demand calculations. Using Joe’s forecast, the EIA projected 11% more winter energy required for the USA than the “warm” NWS forecast had projected.
After that brutally cold and snowy winter, the actual energy used was 10% more than the EIA had projected using the warm NWS forecast, and just 1% less than Joe’s forecast projection. That is a huge amount of energy for the entire USA. I’m not sure if we saved any lives, but we definitely did a good deed.
Regards, Allan MacRae
Calgary
Publishing a “paper” on blogs is not how science is done
Karl Marxist wrote: “Publishing a “paper” on blogs is not how science is done”.
It is now Karl. The leading journals, including Science and Nature, have disgraced themselves, publishing reams of false alarmist propaganda supported by PAL review.
Now we publish online, include all our data and live or die by true peer review.
And potshots from the weeds by trolls like you count for nothing.
“It is now Karl”
…
No Mr. MacRae, you are incorrect. Have you noticed how much effort folks such as Viscount Monckton and Pat Frank exert getting their work published in journals?
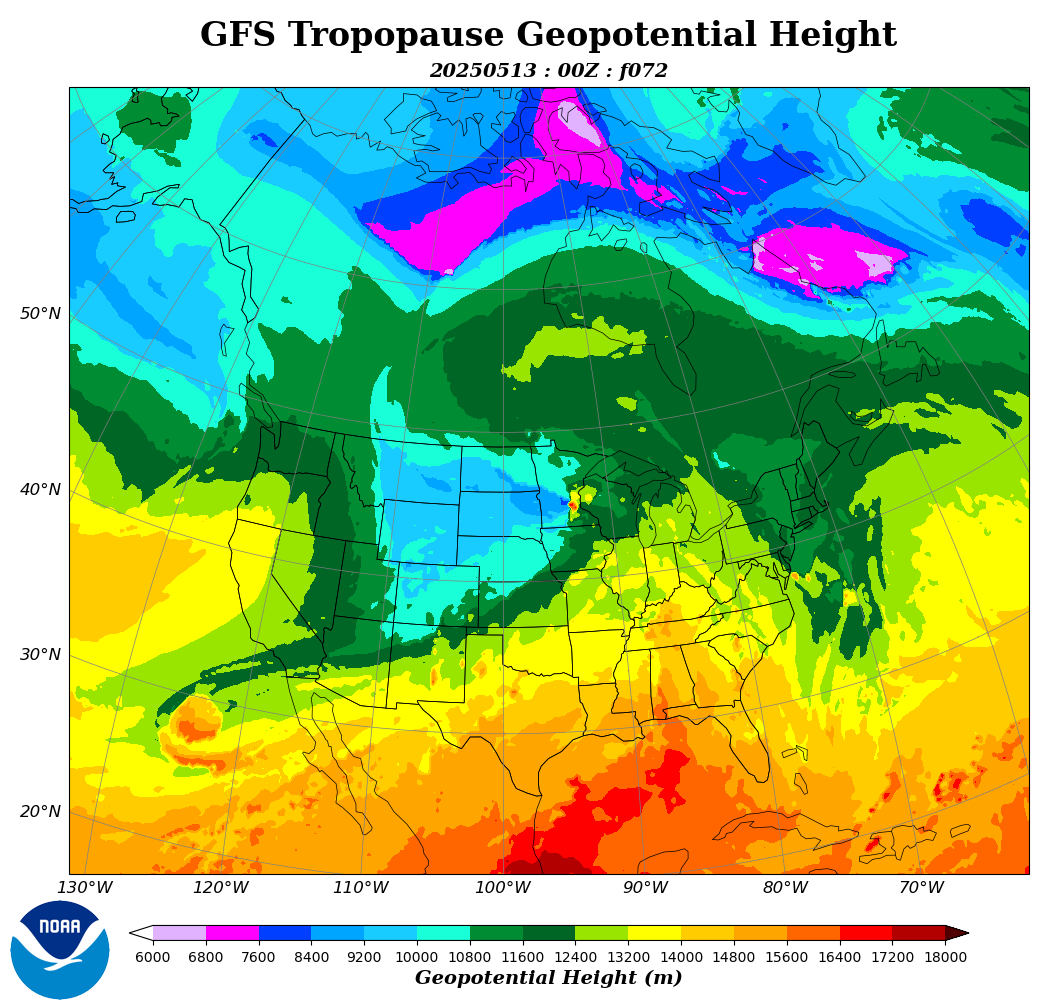
The inflow of Arctic air to the US visible in tropopause.
I thought Canada was warming 😉
It is. -40f to -40c.
Allan MacRae and Joseph D’Aleo, thank you for this update on the cooling hypotheses.
Cooling, like the warming up til now, will likely be spatially heterogeneous, so more than “tales from the corn belt” will be required to convince anyone. That said, I do appreciate your work.
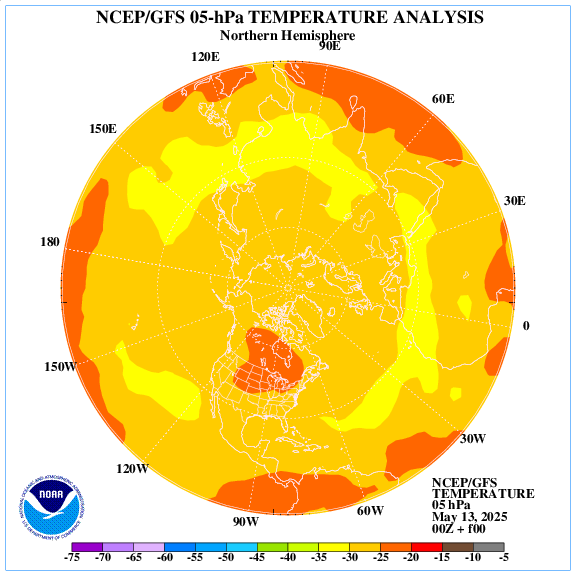
The asymmetrical location of the winter startospheric polar vortex in the north means the inflow of Arctic air to North America.
The cold eastern Pacific announces a severe winter in North America.

Yep
Allan
Thank you for an excellent posting.
Fraud is both the correct term to use for so much of the calculatedly deceitful nonsense broadcast by, for example the BBC, and the behaviour of scientists onboard the fund seeking academic gravy train.
It is important that in the future there is clear evidence that there were people who warned against the catastrophe the politico-alarmists are relentlessly and deliberately leading us into.
Keep up the good work.
Thank you MC of East Anglia – I have tried to notify your government of their climate-and-energy folly – in an open letter to Baroness Verma in 2013 and a submission to the Stern Commission in 2005.
https://wattsupwiththat.com/2019/08/19/renewable-energy-is-a-blackout-risk-warns-national-grid-after-chaos-during-biggest-outage-in-a-decade/#comment-2774481
{excerpt]
I predicted this debacle in 2013 and earlier, for example in an open letter to The Parliamentary Under-Secretary of State, Department of Energy and Climate Change, Baroness Verma, here:
https://wattsupwiththat.com/2013/10/31/blind-faith-in-climate-models/#comment-1130954
[excerpt]
I suggest that Excess Winter Mortality, the British rate of which is about double the rate in the Scandinavian countries, should provide an estimate of this unfolding tragedy.
As always in these matters, I hope to be wrong. These are not numbers, they are real people, who “loved and were loved”.
Best regards to all, Allan MacRae
“Turning and tuning in the widening gyre, the falcon cannot hear the falconer…” Yeats
[end of excerpt]
Regards, Allan
A high IOD index may indicate severe frost in North Asia.
http://www.bom.gov.au/climate/enso/monitoring/iod1.png
The value of this article is diminished by the ranting about fraud. Please publish it somewhere else in an edited form that can be linked to.
e.g – remove this:
“The Mann hockey stick (MBH98 etc.), the Climategate emails, historical temperature data revisions and the thuggish tactics of the climate extremists provide ample evidence of fraud.”
I think it is going to be a slow process to get enough scientists and teachers to move away from the Co2 theory. There’s been a generation or more had it drummed into them by TV, books, school lessons; and ironically by main stream media who love the drama of doom laden headlines. “World normal and likely to remain so” – does not sell papers.
A fraud is a fraud is a fraud…….period !
David Tallboys
Whilst you are right about the effects AGW indoctrination has had on our communities, the spectre of fraud and double dealing hangs like the sword of Damocles over the scientific community.
The terms ‘fraud’ and ‘fake’ do indeed sell papers. All the MSM needs is a target and with the continuing replication crisis in science, it’s only a matter of time before the MSM turn on it for telling us all lies, not just in climate science.
We are all well aware that in some time in the future the world will decline into another ice age. Nothing humankind can do will stop that. It might just be a mini ice age as we had before (hopefully) but if a cooling signal is identified over the next ten years or so, then watch the MSM turn on the likes of Mann and Gore, and all the other hysterical ‘scientists’ will go to ground.
I’d count myself in the Pleistocene Ige Age is still here group. We are in an interstadial and it is only a matter of time before the cold state returns. We should, in my opinion, be doing everything we can, beyond our 4% carbon dioxide breath, to raise the atmosphere’s levels to closer to 500 or 600 ppm, not that it’ll ‘warm’ the planet. 300 ppm is too close to general plant starvation levels (and remember oxygen poisoning of RUBISCO is a thing), for my tastes.
cdquarles
A point I frequently make to alarmists.
Not sure what evidence there is to support that. Even taking the satellite UAH_TLT data set, which has by far the slowest warming rate of all the global temperature data sets, warming between Dec 1978 (start of data set) and Dec1995 (mid-1990s) was +0.08 C per decade. From Jan 1996 to the present the warming in UAH is +0.11 C per decade, so faster since the mid 1990s, not slower as claimed. The rate for the whole UAH_TLT series, Dec 1978 – Sept 2019, is faster still, at +0.13 C per decade.
Taking the surface data sets and comparing the period since the mid 1990s with the same duration period up to the mid 1990s gives similar rates of warming; both up to and after the mid 1990s but also over the whole duration (all +0.16-0.18 C per decade, depending on which data set you use). These things are not difficult to check, e.g. (GISS here): http://www.woodfortrees.org/plot/gistemp/from:1972/plot/gistemp/from:1972/trend/plot/gistemp/from:1972/to:1996/trend/plot/gistemp/from:1996/trend
So where is the evidence supporting the claim that warming has slowed since the mid 1990s?
Hey. There is obvious a pause. Your link is the GISS which has been adjusted by the cult of CAGW.
This is what you wanted if you were interested in the truth.
The cult of CAGW were 100% incorrect. Their spin worked when there was a pause.
It will not when there is start of cooling. I would expect significant cooling in 6 months.
William Astley
Here’s that very same UAH_LT data you linked to, only this time with the trends in it as discussed above (Dec 1979 – Dec 1995; Jan 1996 – present). The authors of this article are claiming that “Global warming has slowed since the mid 1990’s…”
http://www.woodfortrees.org/plot/uah6/plot/uah6/to:1996/trend/plot/uah6/from:1996/trend
The data set ‘you’ link to and proclaim to be “the truth” shows their claim to be false. The rate of warming in UAH_LT since the mid-1990’s is faster (+0.11 C/dec) than it was leading up to the mid-1990’s {+0.08 C/dec). Check the raw data on that site or at UAH if you don’t believe it.
The evidence you posted in order to dismiss my point actually backs it up.
The data I linked to was UAH. The data you linked to was GISS.
GISS has been systematically modified reducing past temperatures and increasing current temperatures to create a hockey stick for propaganda reasons.
Compare the two graphs.
The majority of the rise in atmospheric CO2 was caused by warming, not the CO2 rise.
The tone of the discussion will change when there is real cooling.
I used the UAH data in my follow up post, not GISS. The same UAH data you used. Please see the link clearly showing that it is UAH data. UAH shows a faster rate of warming after the mid-1990’s than in the period leading up to it. The authors’ claim that global warming has slowed since the mid-1990’s is not supported by any data set and, in UAH at least, the opposite is true.
It will be difficult to collect corn in the northern US.

The world is warming. That’s a fact that can’t be argued. Peak warming was reached in early 2016 as far as we can tell. The cooling of 2017 and 2018 has been partially reverted in 2019, but obviously it could continue in 2020 and following years.
But that already happened around 1945. The world cooled for 30 years until 1976. Was the world cooling long-term? Not really, it was in the low part of a 65 year oscillation whose trend was still increasing, so we can say that the world has been warming for at least 200 years including that period of cooling.
So even if we enter a 30-year period of cooling, that doesn’t mean that the planet is long-term cooling. We must wait at least a full period of 65 years to know if the long term trend is no longer upward. So by 2090 we might be able to say if the world has stopped warming. Of course that makes it personally irrelevant to nearly all of us.
Cooling alarmism has even less grounds than warming alarmism, and has been consistently wrong in its past predictions. That won’t change even if we enter a 30-year cooling period. Alarmists are not that different even if what alarms them is. Eventually there will be a reason to fear climate change but that may still lie several thousand years in the future. No point in worrying now.
Meanwhile, in Dakotas, the type of crop needs to be changed if the growing season shortens.
“The world is warming.” No, we can’t say that is a fact. All we can say is that we have been in a warming period since the LIA. That warming period may have already ended, but we won’t know for a while, perhaps even ten years or more. These things don’t stop on a dime, nor are they uniform. I don’t see anything alarmist in the post, simply the fact that cooling is more something to worry about than warming, if we need to worry about something. That isn’t being “alarmist”. And we can’t know how long a period of cooling, if it happens, will be. We can only hope it might be only 30 years. That would be easy. A walk in the park. Except, it would blow the whole CAGW carbonistas arguments out of the water.
I have been working outside in the Uk for the last 45 years with an 8year break in the 80s whilst I was in the Royal Navy. In the 70s it was very cold with temperatures so low (for the UK anyhow) that the diesel was freezing in the fuel lines and week long spells of -10C were regular. In the 90s/00s it was considerably warmer, particularly in summer with droughts and hosepipe bans a regular feature The last 10 years has seen progressively colder and wetter summers with this year having at least 2 July days where the temperature hovered around the 10C mark and I needed the heater on in the cab of the excavator. Winter temperatures are still holding up but are definitely not as warm as 10years ago.
Couple all this with the cyclical nature of the weather since WW2, one could definitely observe that the temperature topped out several years ago now. Perhaps as above this is all just weather but I notice that most of the RCP graph lines do not represent a cyclical nature, even if they are not completely straight lines.
Using my own experience and it is my own opinion, the weather is definitely on a more cooling trend already and the bumper crop yields of around the millennium are no longer being repeated. It will be an interesting next 5 years – by then I would expect to be able to see who is right here…..for sure.
Allan, I don’t see any references to increased humidity in cold weather. That is also relevant.
It used to be that winter air was dry, with bouts of snow brought in from elsewhere and if you walked across a rug and touched a metal doorknob, you’d get zapped by static. I haven’t had that happen to me since the winter of 2000-2001. I haven’t had to run a vaporizer to increase indoor humidity to a “comfort” level in nearly 20 years now. It isn’t just indoor humidity, it is also outdoor humidity levels that count. Never used to have “thundersnow”, and now it’s a fairly common occurrence.
I’m 8 miles south of the WI/IL state line. The weather forecast from NWS is for a snow and rain mix this week, several days in a row. (There goes Hallowe’en!) It may also mean a longer and wetter snow season in my area, and if it is going on here, it is also moving south into the metro Chicago area because of Lake Michigan’s higher levels. Lake Michigan has been consistently 11 inches higher than ever this year, and next year’s forecast for a rising lake level is another 20 inches. The local rivers have been higher than ever, and since they all head downstream to the Mississippi River, being up over their banks is adding a bodacious water volume to that waterway. These things need to be addressed. All the rivers around here are so full that some are over their banks. The local hiking trails and forest preserves are more wet than dry, and the trails are frequently mud if they aren’t paved for bikes.
We had so much rain this past summer that my little lawn looked like green velvet and not once did I have to water my plants on the front steps. We also had late snows, up to three inches deep. The last one was on April 30 this year. I have photos of it.
So why is this elevated humidity level not being addressed along with the other aspects of weather? Why the higher humidity? What’s going on there? I think that needs to be looked at, not just temperature swings.
Tomorrow morning expect a temperature below 0 C.
Not in the forecast for my AO, Ren, definitely not around here. Not even to the west of me.
The failed CAGW hypothesis assumes that increasing atmospheric CO2 from fossil fuel combustion drives dangerous runaway global warming. The alleged evidence for this fraud is climate computer models”
err.. nope.
psst. also, usa aint the globe
But but but…what about The World Series?
Only the globe is the globe, but go back and review how basic science is done and review hypothesis testing.
“usa aint the globe”. How convenient for Alarmists.
steven wrote: “psst. also, usa aint the globe”
err.. nope.
Actually, the USA *is* the globe, when it comes to temperature profiles. All other unmodified surface temperature records, from around the world and from both hemispheres, resemble the USA surface temperature profile, which shows the 1930’s to have been just as warm as today.
Here are some temperature charts from around the world. Look at how similar their temperature profiles are. They look nothing like the Hockey Stick chart that erases the warmth of the 1930’s for political purposes, because if it was just as warm in the 1930’s as it is today then that means we are not experiencing unprecedented warmth today, as the alarmists claim, and that means that CO2 is a minor player in the Earth’s atmosphere, not a threat. So the Data Manipulating conspirators had to get rid of that inconvenient truth.
Tmax charts
US chart:
China chart:
India chart:
Norway chart:
Australia chart:
err.. nope.
err… yup! Models all the way down… and failure all the way through.
Mosher clearly has no idea of what he is speaking, or is lying once again.
Far, far away down south in the lower corner of Western Australia, we have now had three of the coolest summers in a row, with increased moist humid cool air from Antarctica replacing the usual hot air from the inland deserts. Also increased cloud cover in summer.
Toggweller et.al. has studies on glacial/interglacial changes, and on WHY CO2 lags temperature on long timescales. They figure that midlatitude westerlies control ocean circulation and CO2 feedback. When westerlies shift poleward, like the present, CO2 is flushed out of the ocean into the atmosphere. If that’s the case, increasing atmospheric CO2 could be mostly natural.
https://agupubs.onlinelibrary.wiley.com/doi/full/10.1029/2005PA001154
“…..We hypothesize that these transitions occur in nature through a positive feedback that involves the midlatitude westerly winds, the mean temperature of the atmosphere, and the overturning of southern deep water. Cold glacial climates seem to have equatorward shifted westerlies, which allow more respired CO2 to accumulate in the deep ocean. Warm climates like the present have poleward shifted westerlies that flush respired CO2 out of the deep ocean.”
Minus 8C today in Oulu, Finland, some early snow already. Tyre changes were need 3 weeks ago – earlier than normal. We have had cool summer again and all the signs are it will be another cold winter. Green party is becoming more and more popular here and more stringent energy policies being introduced all the time (carbon taxes and so forth). Seems that most people are happy to pay for the “green revolution”.
Saturday it was 77, today (monday) thru most of this week in the low 30s. That is the only climate change i care about.
Thank you for an excellent, concise review of the science and its implications. This should be required reading at all the Ivy League institutes of higher indoctrination.
I’m glad I’m not a vegan homesteader here in central WI where my veggie garden was a miserable failure- worst in 50 yrs of doing this. Luckily, my nasty methane-producing cattle did just fine and I won’t be protein malnourished over this winter.
One word of caveat about GW and the northward movement of optimum growing temp/precip conditions– it will take the soil a little more time to undergo ecological succession to keep up with the weather changes.
Hi Guido – a better review of the science is here. This is not all mainstream yet – I’m either 11 years ahead of the pack or I’m wrong – but I hate being wrong so I generally avoid that.
Best, Allan 🙂
CO2, Global Warming, Climate And Energy
by Allan M.R. MacRae, B.A.Sc., M.Eng., June 15, 2019
https://wattsupwiththat.com/2019/06/15/co2-global-warming-climate-and-energy-2/
Excel: https://wattsupwiththat.com/wp-content/uploads/2019/07/Rev_CO2-Global-Warming-Climate-and-Energy-June2019-FINAL.xlsx
How come El-Nino phases are completely left out?
It seems that the atmosphere warms ONLY when we are in El-Nino phase, cools when we are in neutral or La-Nina phase.
This gets overlooked over and over, why?
Right now the Ocean waters has been in a long term COOLING phase, that will eventually peter out……..
How come so many here forget Bob Tisdale’s presentations?
It won’t be warmer in November.

Sunsettommy
“Right now the Ocean waters has been in a long term COOLING phase, that will eventually peter out……..”
Wrong! Here is the current Ocean temperature situation since 1979, comparing the lower troposphere and the surface:
https://drive.google.com/file/d/10FWtzbw-R8FUjI9SX5MoFahbLFIcIMg5/view
Maybe you confound, like do so many people, short term (since 2016) and long term (since 1880).
Oh dear…,
your own chart supports my contention, when there is a dominant El-Nino phase, the ocean waters are in a cooling phase, the atmosphere will be in a warming phase.
Regarding “the following two studies calculated that the MAXIMUM climate sensitivity to a hypothetical doubling of atmospheric CO2 is only about 1 degree C”:
I clicked the link for the Lewis and Curry 2018 study, and saw in its abstract:
“ECS of 1.50 K (5%–95% range: 1.05–2.45 K)”
“Using infilled, globally complete temperature data give slightly higher estimates: a median of 1.66 K for ECS (5%–95% range: 1.15–2.7 K)”
“Allowing for possible time-varying climate feedbacks increases the median ECS estimate to 1.76 K (5%–95% range: 1.2–3.1 K), using infilled temperature data.”
Global temperatures change inversely to changes in the solar wind strength at interdecadal scales. The 1970’s global cooling was stronger solar wind conditions driving colder ocean phases, and driving an increase in low cloud cover. Post 1995 global warming has been dominated by weaker solar wind conditions driving warm ocean phases, and reduced low cloud cover.
https://www.linkedin.com/pulse/association-between-sunspot-cycles-amo-ulric-lyons/
El Nino episodes drive major warm pulses to the AMO with an 8 month lag, that is a likely cause of the 9 month lag of CO2 with temperatures.
Ulric Lyons
Yet the authors of the above article claim that “Global warming has slowed since the mid 1990’s …”. According to UAH_LT it’s got faster, and according to the surface data sets it’s stayed fairly constant over the long term.
Regarding “the following two studies calculated that the MAXIMUM climate sensitivity to a hypothetical doubling of atmospheric CO2 is only about 1 degree C”:
I just clicked the link for Christy and McNider 2017, and found in it:
“tropospheric transient climate response (ΔTLT at the time CO2 doubles) is +1.10 ± 0.26 K”
This is transient climate response; equilibrium climate sensitivity is higher. Also, the 1.10 +/- .26 degree K per 2xCO2 was determined using warming in the UAH TLT dataset adjusted downward from .155 to .096 degree/decade because of volcanic effects in the earlier years of the tropospheric temperature dataset.