Sun spotless for 33 days straight – airline travelers getting dosed with up to 70 times more radiation [than at sea level]

Are we in a solar grand minimum? We’ve seen this before, but now predictions are for an extremely weak solar cycle ahead.

Today is the summer solstice in the northern hemisphere. The sun has been without a single observable sunspot now for over a month – 33 days according to NOAA and SIDC data. Spaceweather.com says:

“This is a sign of Solar Minimum, a phase of the solar cycle that brings extra cosmic rays, long-lasting holes in the sun’s atmosphere, and a possible surplus of noctilucent clouds. “

Solar Dynamics Observatory HMI Continuum image for June 21, 2019 More at WUWT’s solar page: https://wattsupwiththat.com/solar/

There’s been sightings of the electric blue noctilucent clouds as far south as Joshua Tree, near Los Angeles, and many many other locations. But one of the most interesting things is due to the fact that the Sun’s magnetic field has weakened, more cosmic rays are now bombarding Earth and some airline flights are seeing doses of radiation up to 73 times that which we’d see at ground level.

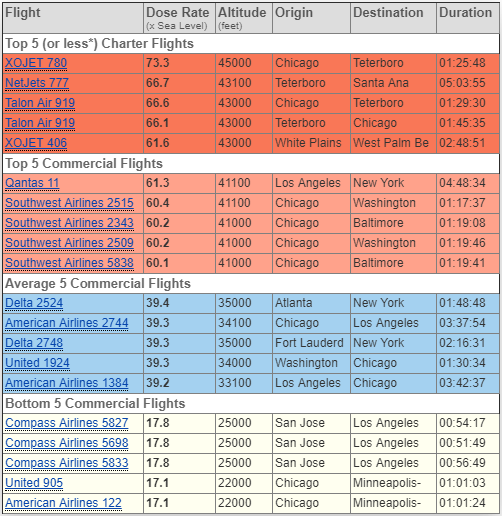
For example, a flight from Chicago, IL to Teterboro, NJ which flies at 45,000 feet gets 73.3 times the radiation dosage than a traveler would experience at ground level. A typical commercial flight across the United States gives you about 40x exposure – about the same amount of radiation as a typical dental x-ray. The Chicago-Teterboro flight is almost double that. Frequent air travelers during the solar minimum like we have now would get an even more elevated dose of cosmic rays.

Spaceweather.com is monitoring passenger flights:

We are constantly flying radiation sensors onboard airplanes over the US and and around the world, so far collecting more than 22,000 gps-tagged radiation measurements. Using this unique dataset, we can predict the dosage on any flight over the USA with an error no worse than 15%.

E-RAD lets us do something new: Every day we monitor approximately 1400 flights criss-crossing the 10 busiest routes in the continental USA. Typically, this includes more than 80,000 passengers per day. E-RAD calculates the radiation exposure for every single flight.

The Hot Flights Table is a daily summary of these calculations. It shows the 5 charter flights with the highest dose rates; the 5 commercial flights with the highest dose rates; 5 commercial flights with near-average dose rates; and the 5 commercial flights with the lowest dose rates. Passengers typically experience dose rates that are 20 to 70 times higher than natural radiation at sea level.

Here is a table of recent “hot flights” arranged by radiation dosage level:

Column definitions: (1) The flight number; (2) The maximum dose rate during the flight, expressed in units of natural radiation at sea level; (3) The maximum altitude of the plane in feet above sea level; (4) Departure city; (5) Arrival city; (6) Duration of the flight. Data provided by spaceweather.com

There’s now a dedicated website setup for monitoring this https://www.radsonaplane.com/

Meanwhile, the sun seems to be in a deep slumber, PerspectaWeather reports:

The sun continues to be very quiet and it has been without sunspots this year 62% of the time as we approach what is likely to be one of the deepest solar minimums in a long, long time. In fact, all indications are that the upcoming solar minimum may be even quieter than the last one which was the deepest in nearly a century.  

Daily observations of the number of sunspots since 1 January 1977 according to Solar Influences Data Analysis Center (SIDC). The thin blue line indicates the daily sunspot number, while the dark blue line indicates the running annual average. The recent low sunspot activity is clearly reflected in the recent low values for the total solar irradiance. Compare also with the geomagnetic Ap-index. Data source: WDC-SILSO, Royal Observatory of Belgium, Brussels. Last day shown: 31 May 2019. Last diagram update: 1 June 2019 . [Courtesy climate4you.com]

In addition, there are now forecasts that the next solar cycle, #25, will be the weakest in more than 200 years.  The current solar cycle, #24, has been the weakest with the fewest sunspots since solar cycle 14 peaked in February 1906. Solar cycle 24 continues a recent trend of weakening solar cycles which began with solar cycle 21 that peaked around 1980 and if the latest forecasts are correct, that trend will continue for at least another decade or so.

Full story here

0 0 votes
Article Rating
250 Comments
Oldest
Newest Most Voted
Inline Feedbacks
View all comments
Marcus
June 21, 2019 6:34 am

By the time President Trump gets reelected in 2020, the liberal left’s “Greenie” heads will be exploding at a constant rate of 0.97% per hour +/- 0.42…IMHO : )

June 21, 2019 6:37 am

But now predictions are for an extremely weak solar cycle ahead.
If the polar fields are any guide, the next maximum will be a bit stronger than SC24:
https://leif.org/research/Prediction-of-SC25.pdf

Paradox
Reply to  Leif Svalgaard
June 21, 2019 8:00 am

I am inclined to believe in this analysis. Thanks, Leif for the reminder.

Sara
Reply to  Paradox
June 21, 2019 3:27 pm

But how long will it last? That’s important.

beng135
Reply to  Sara
June 22, 2019 10:00 am

I doubt anyone could credibly say yet. Perhaps a next cycle prediction is the best that can be done w/the current science (polar field persistence). I doubt pattern-matching (the previous long minimums started out w/minimum sunspot cycles, so that’s what will happen) is credible.

Reply to  Leif Svalgaard
June 21, 2019 8:28 am

But that’s OK according to the IPCC who ignores things like night and seasonal change as they assert that despite acknowledged uncertainty about how the Sun may change over long periods of time, there’s no need to account for it relative to the future climate or past reconstructions.

I wonder what kind of nonsense they’ll come up with next to explain a cooling planet. Perhaps it will be man made aerosols that are cooling the planet …

Bryan A
Reply to  co2isnotevil
June 21, 2019 10:11 am

Ban deodorant…Ban Hair spray…Ban Spray paint…Ban Bug spray…Ban Spray___…
We’ll teach those aerosols a lesson

Joel O'Bryan
Reply to  Bryan A
June 21, 2019 3:23 pm

Liberal chicks love their candles. Lots of candles. (not just liberals, but then they are ones who are hypocrites).

If you really want to get the Liberal’s attention…. ban candles. Or make them so expensive that only the richest can afford them.

Modern candles are of course made with highly refined paraffin, which is a petroleum product. The alternative would be sperm whale oil, marine mammal blubber, or other animal fat derived candles.

RACookPE1978
Editor
Reply to  Joel O'Bryan
June 21, 2019 4:17 pm

Ah! Save the panek (er, planet), burn the whales!
Outlaw fossil-fueled candles!
Only permit “natural” candle light. Burn the whales!

Daniël Lemmers
Reply to  Joel O'Bryan
June 21, 2019 4:44 pm

That’s not totally true. Also bee wax is a good product to make candles. In my childhood (1970s and 80s), all our candles at home were made out of bee wax.

Patrick MJD
Reply to  Joel O'Bryan
June 22, 2019 12:08 am

No CO2 is emitted either.

MangoChutney
Reply to  Joel O'Bryan
June 22, 2019 1:25 am

Burn the bees!

ozspeaksup
Reply to  Joel O'Bryan
June 22, 2019 3:07 am

hello? beeswax are the best and cleanest burning candles;-) and yes they are getting expensive as the cold weather n pesticides take their toll on the bees along with varroa and other issues.

Johann Wundersamer
Reply to  Joel O'Bryan
June 22, 2019 8:07 am

Daniël Lemmers, bee wax is a natural byproduct of honey production. That’s OK.

Problems raised in landscapes where honey production were “no problem at all”.

The word comes from the Greek σκάφη, skáphe, meaning “anything scooped (or hollowed) out”. It entailed trapping the victim between two boats, feeding and covering him with milk and honey, and allowing him to fester and be devoured by vermin.

https://www.google.com/search?client=ms-android-huawei&ei=H0IOXaXCBcfKrgTkjr3YBA&q=The+Ancient+Persian+Torture+Method+That+Killed+Victims+With+Milk+And+Honey+meaning&oq=The+Ancient+Persian+Torture+Method+That+Killed+Victims+With+Milk+And+Honey+meaning&gs_l=mobile-gws-wiz-serp.

Contrary to the landscapes where the only lighting means was olive oil:

The drawing illustrates a parable in Matthew 25:1-13 used by Jesus to warn listeners to be spiritually prepared:

“Then shall the kingdom of heaven be likened unto ten virgins, which took their lamps, and went forth to meet the bridegroom. And five of them were wise, and five were foolish.”

https://www.google.com/search?q=Then+it+will+be+with+the+kingdom+of+heaven%2C+as+with+ten+virgins%2C+who+took+their+lamps+and+went+to+meet+the+bridegroom.+…+The+foolish+ones+took+their+lamps+with+them%2C+but+no+oil%2C+the+wise%2C+but+took+oil+in+pitchers+besides+the+lamps.+When+the+bridegroom+did+not+come+for+a+long+time%2C+they+all+got+tired+and+fell+asleep.&oq=Then+it+will+be+with+the+kingdom+of+heaven%2C+as+with+ten+virgins%2C+who+took+their+lamps+and+went+to+meet+the+bridegroom.+…+The+foolish+ones+took+their+lamps+with+them%2C+but+no+oil%2C+the+wise%2C+but+took+oil+in+pitchers+besides+the+lamps.+When+the+bridegroom+did+not+come+for+a+long+time%2C+they+all+got+tired+and+fell+asleep.&aqs=chrome.

donb
Reply to  co2isnotevil
June 21, 2019 12:30 pm

Aerosols have already been blamed — for the ~1945-1975 cooling.

Crispin in Waterloo but really in Johor
Reply to  donb
June 21, 2019 6:49 pm

Ineffectively blamed. They tried to blame coal-fired power and sulphate aerosol. The correlation between AG emissions and temperature is a weak as AG CO2 and temperature.

Do you remember the ’80’s and the solar dimming – how sunlight was going to be so weak on the ground that crops couldn’t grow by 2000?

F1nn
Reply to  Crispin in Waterloo but really in Johor
June 23, 2019 7:23 am

You are right. Oceans oscillations are much better blame.
Switch to cool is coming very soon.

Loydo
Reply to  co2isnotevil
June 21, 2019 4:19 pm

“I wonder what kind of nonsense…”

Through the looking glass we go.

I wonder if aerosols and an insolation downturn have helped cool things over the past 50 years, then how much AGW would there have been without them?

F1nn
Reply to  Loydo
June 23, 2019 6:56 am

It´s very easy to count. 0 – 0 = 0, and 0 + 0 = 0. All, what has happened is natural variation, and because AGW is not (nothing), it´s 0 (zero). Mmkay?

How much you can count from nothing? And I mean in reality, not in climate”scientists” wet dreams.

F1nn
Reply to  co2isnotevil
June 23, 2019 8:51 am

It´s already climate change, which they still call global warming. Every weather phenomenon is covered. It´s winwin to UN whatever happens.

Nicholas McGinley
Reply to  Leif Svalgaard
June 21, 2019 9:03 am

I am sure I am not the only one watching and waiting and wondering about this, and related questions.
Has the outlook based on the polar fields been changing over the past several years?
IOW, any trend in the polar field guided outlook?
Of course, and with the exception of fervent noctilucent cloud aficionados, many or most, and perhaps all of us are really wondering about what is happening and going to be happening here on Earth, and looking to the Sun for a possible confirmation of a link, or confirmation there is not one.
Or at the very least some evidence.
Worst case scenario: It plays out in a way which is perfectly indeterminant, and nothing is settled, no one changes their mind, no insight is gained…

ldd
Reply to  Nicholas McGinley
June 22, 2019 12:12 pm

Well, the last 3 years we’ve noticed a drop in spring/summer temps.
We are 5 weeks behind in planting crops in my local. (Ontario, Canada)

We just had a very long brutally cold winter that lasted far into April this year.

The wild jet stream brings us temps too cold or temps too hot when we’re normally moderate and big crop growers. This year fields are still not planted (too late for corn now) and what’s been planted only got in last weekend when we finally warmed up.

Corn from here will be way down this year. Hay will be in abundance tho since many are doing that on their still boggy fields.

Reply to  ldd
June 22, 2019 12:22 pm

hi guys

did I not tell you?

I take this opportunity to again warn you all about the big drought times coming to the great plains of America. You can see what the reason is: the continued lower solar polar magnetic field strengths allow more of the most energetic particles to be released from the sun. On earth, we are protected from these particles as they are involved in the creation of ozone, peroxides and N-oxides [hence , do not go to to Mars before you have created an atmosphere].
However, more ozone & others mean less UV (i.e. less heat) going into the oceans.
We clearly see the repetitiveness of the coming droughts, namely every 87-90 years,
2019\ possible start of the coming drought / we already had a very dry summer 2018 in Europe/
1932-1939 Dust Bowl drought. This was one of the biggest disasters in the history of the USA…
1845-1856 Apparently the drought times were so severe that it seriously affected the Bison population..
1755 – There is evidence of special tax concessions made in Virginia due to the drought…
Again, I am not the first person who figured out the periodicity of the coming drought times. Before they started with the CO2 nonsense there were at least two reports who also found the 90 year periodicity of drought times in the USA.
See here:
https://documentcloud.adobe.com/link/track?uri=urn:aaid:scds:US:d6ec23b0-6f50-4758-b93f-80dfdbe4e289

ldd
Reply to  HenryP
June 22, 2019 3:26 pm

Interesting read, thanks HenryP.

tom in texas
Reply to  HenryP
June 26, 2019 12:06 pm

2004 through 2015 the effects last 7-11 years. Happens about every 66 years.

Reply to  tom in texas
June 26, 2019 12:27 pm

No. The big drought at the higher lats comes every 87 years, give or take a few years. However, looking at Europe it is very dry already. USA drought coming up ….just about now…
It is due to less UV on the equator, i.e. it is cooling…

Reply to  HenryP
June 27, 2019 8:56 am

just as I was saying
[was somebody reading my mind?]
https://wattsupwiththat.com/2019/06/26/part-of-the-pacific-ocean-is-not-warming-as-expected-buy-why/

there is less UV heating up the ocean…

Reply to  HenryP
June 27, 2019 11:14 am

Mind you. A lot of the uv hitting the ocean goes straight into evaporation of the water.

Joel O'Bryan
Reply to  Leif Svalgaard
June 21, 2019 10:07 am

Leif,
A peak amplitude tells us as much about a SC as does a peak wind strength or minimum eye pressure for a hurricane. The dissipation/release of stored energy is what really tells us how strong an event is.

Does anyone integrate the area under a smooth GSN curve, sort of like ACE is calculated for tropical cyclones?

An accumulated Solar magnetic event energy release by time for each cycle?

MattS
Reply to  Joel O'Bryan
June 21, 2019 12:45 pm

“Does anyone integrate the area under a smooth GSN curve, sort of like ACE is calculated for tropical cyclones?”

Seems kind of hard to do with a forecast that only predicts peak amplitude.

Joel O'Bryan
Reply to  MattS
June 21, 2019 3:02 pm

Well it wouldn’t be based on forecast magic. It would be calculated maybe each month based on smoothed (actual) GSN, or something like that.

The problem I see is that each solar hemisphere behaves slightly different in timing of its peak. SC24 is a perfect example, where the N-S peaks were separated by almost 2 years. Had they been almost simultaneous, then the peak SSN for cycle 24 would have been much higher (and Dr. Hathaway would have been spot on with his prediction, and Leif would have been SOL). And Leif’s prediction doesn’t take such differential peak behavior (delayed-separated peaks) into account as far as I can see.

ResourceGuy
Reply to  Leif Svalgaard
June 21, 2019 10:14 am

A bit stronger than SC24 is not saying much in the context of the series of cycles 12-16 centered around the year 1900. Moving the needle on decadal global temp trends might take multidecadal cycles to do it and some distributed lag term.

example:
comment image

Editor
Reply to  Leif Svalgaard
June 22, 2019 7:11 am

There are others who predict differently:

From NASA,

The ability to forecast these kinds of events is increasingly important as NASA prepares to send the first woman and the next man to the Moon under the Artemis program. Research now underway may have found a reliable new method to predict this solar activity. The Sun’s activity rises and falls in an 11-year cycle. The forecast for the next solar cycle says it will be the weakest of the last 200 years. The maximum of this next cycle – measured in terms of sunspot number, a standard measure of solar activity level – could be 30 to 50% lower than the most recent one. The results show that the next cycle will start in 2020 and reach its maximum in 2025.

and,

The new research was led by Irina Kitiashvili, a researcher with the Bay Area Environmental Research Institute at NASA’s Ames Research Center, in California’s Silicon Valley. It combined observations from two NASA space missions – the Solar and Heliospheric Observatory and the Solar Dynamics Observatory – with data collected since 1976 from the ground-based National Solar Observatory.

Carla
Reply to  Leif Svalgaard
June 24, 2019 10:21 am

Hi Dr. S., have you seen this aricle yet?
Wondering if you might comment on this?

The Origin of Parity Changes in the Solar Cycle
Soumitra Hazra, Dibyendu Nandy
(Submitted on 16 Jun 2019)
Abstract
…Although hemispheric asymmetry in the emergence of sunspots is observed in the Sun, a parity shift has never been observed. We simulate hemispheric asymmetry through the introduction of random fluctuations in a computational dynamo model of the solar cycle and demonstrate that changes in parity are indeed possible in long-term simulations covering thousands of years. Quadrupolar modes are found to exist over a significant fraction of the simulated time. In particular, we find that a parity shift in the underlying nature of the sunspot cycle is more likely to occur when sunspot activity dominates in any one hemisphere for a time which is significantly longer than the cycle period. We establish causal pathways connecting hemispheric asymmetry and cross-equatorial phase-shifts to parity flips in the underlying dynamo mechanism. Our findings indicate that the solar cycle may have resided in quadrupolar parity states in the distant past, and provides a possible pathway for predicting parity flips in the future….
https://arxiv.org/abs/1906.06780

beng135
June 21, 2019 6:53 am

electric blue noctilucent clouds as far south as Joshua Tree, near Los Angeles

Warmies BEWARE. If you don’t die from the heat, the electric clouds will zap you….

Farmer Ch E retired
Reply to  beng135
June 21, 2019 10:21 pm

How much albeto do noctilucent clouds add and does it contribute to cooling during solar minimums?
On a possibly related note, I drove through Illinois and Wisconsin yesterday and today (summer solstice) and very few corn fields looked “normal” for this date. Most fields were either unplanted or had newly emerged plants ~4” tall. Many areas of standing water are still on the fields. (climate change or solar minimum?)

Johann Wundersamer
Reply to  Farmer Ch E retired
June 22, 2019 8:16 am

Good question, farmer retired :

“Clouds, water vapor and other atmospheric gasses also absorb about 20 percent of this incoming solar radiation. Low-level clouds reflect the greatest amount of heat, which is why we enjoy cooler temperatures during a cloudy day.”

https://www.google.com/search?client=ms-android-huawei&ei=p0UOXdxqiOuuBN6vr5gI&q=How+much+albedo+do+noctilucent+clouds+add+and+does+it+contribute+to+cooling+during+solar+minimums+meaning&oq=How+much+albedo+do+noctilucent+clouds+add+and+does+it+contribute+to+cooling+during+solar+minimums+meaning&gs_l=mobile-gws-wiz-serp.

Reply to  Farmer Ch E retired
June 22, 2019 11:47 am

Farmer, old chap, you ask –
“Many areas of standing water are still on the fields. (climate change or solar minimum?)”

Weather.

Have a great evening.
Auto

rbabcock
June 21, 2019 7:01 am

What a great opportunity to finally see what impact the solar cycles have on short and long term weather and climate. As long as the data isn’t corrupted by the governments, we will be able to see how the Earth responds. With feedbacks and long lag times it will take a while but in 30-40 years we should have a great perspective on all this.

Unfortunately I probably won’t be around 40 years from now, but I’m betting with a change in the wavelengths hitting the Earth and the total power going down, it will turn colder.. and maybe much colder. Even now it appears changes are happening, but again it will take years for anything to become dominate.

Reply to  rbabcock
June 21, 2019 8:31 am

Don’t believe the BS about the planet responding so slow. The effects will be far more immediate since if the planet didn’t respond rapidly to solar changes, we wouldn’t even notice seasonal temperature changes, much less diurnal variability.

Old England
Reply to  co2isnotevil
June 21, 2019 11:27 am

June in the UK is shaping up to be one of the17 COLDEST of the last 350 years from the Central England Temperature record according to a recent article.

Anecdotal but I don’t ever recall having to have heating on most days in June as we have this year, and that’s in 65 years since early childhood.

Alan the Brit
Reply to  Old England
June 21, 2019 12:22 pm

Ditto re my central heating, it’s been so relatively cold in SW England! Brrr!

Derek Lott
Reply to  Alan the Brit
June 23, 2019 6:08 am

Alan the Brit
What part of SW UK are you?
I’m writing this from N Devon ( Clovelly Way)
Good to know there’s more than just me trying to hold back the AGW tide in this part of the world

vukcevic
Reply to  Old England
June 21, 2019 12:47 pm

The CET’s June data has a ‘zero’ (10^-4,or +0.01C/century) trend in its 350 year long history.
http://www.vukcevic.co.uk/June-July.gif
(this is an old graph I need to update).

Steven Mosher
Reply to  vukcevic
June 21, 2019 7:59 pm

now all we need is a year where its only june

vukcevic
Reply to  vukcevic
June 21, 2019 11:33 pm

Hi Steven
Your analytical mind is telling you reasons why there are no long term temperature rises due to CO2 or major fall at the time of the solar Grand Minima with principal spectral component at 22 yr Hale cycle, in the month of the peak TSI.

Richard Patton
Reply to  Old England
June 21, 2019 5:25 pm

After *one* day of ‘summer’ on the 12th when it hit 100F, I am back to having to have the heat on with the highs in the upper 60’sF.

Johann Wundersamer
Reply to  Old England
June 22, 2019 8:22 am

That’s Steven Mosher wet dreams :

ONE month he always can refer to.

And too one month he can blame “deniers” always falsely referring to.

ldd
Reply to  Old England
June 22, 2019 12:37 pm

Same from here in Canada and we’re just above the USA border.
10 yrs ago (we heat with wood) we use to order 10 to 12 cords of wood for the whole winter, in last few years we’ve been adding on 5 cords per year, last winter we went through 25 cords, in June we were taking dead trees down and burning them for heat. This year we’ll be adding another 5 cords. Everyone we know that burns wood for heat, ran out this year.

Samuel C Cogar
Reply to  rbabcock
June 21, 2019 1:09 pm

rbabcock – June 21, 2019 at 7:01 am

What a great opportunity to finally see what impact the solar cycles have on short and long term weather and climate.

Well now, some of us have been “paying attention” to the changes in the weather during the past 3 Solar Cycles …… and we have been predicting a “cool down” iffen there was a continued diminishing number of Sunspots ……… and that “cool down” appears to be exactly what has been occurring, …. more profoundly during the past 8 months (November thru mid-June 2019) with above average rain events and massive flooding. Just like history tells us happened during the onslaught of the LIA.

So, iffen the rains and cool temperatures continue throughout summer and into the fall, the price of food will increase accordingly …….. and it matters not a twit what all the “experts” and their measurements and calculations are telling them to tell us.

By the way, just how many “experts” were there that their calculations predicted …. the massive rain and flood event for the Fall, Winter and Spring of 2018-2019?

John Finn
Reply to  rbabcock
June 21, 2019 3:06 pm

With feedbacks and long lag times it will take a while but in 30-40 years we should have a great perspective on all this.

Why? I thought the lower solar activity during the Maunder Minimum was responsible for colder climate. Similarly the Dalton Minimum. Not that there’s much evidence of a significantly colder climate during the Dalton Minimum period (or after)

tty
Reply to  John Finn
June 21, 2019 4:38 pm

Actually the Dalton Minimum was a very cold period, at least in Europe, which is the only area with good data that far back. The Thames froze for the last time in 1814.

n.n
June 21, 2019 7:12 am

So, if the prophecy of CAGW is correct, and CO2 is the determining factor in global warming, cooling, and climate change, then it is incumbent upon us to return hydrocarbons into the wild, and optimize conversion of the Sun’s low energy output. Then again, we still have temperature swings of 10, 20, 100 degrees and more, even in a steady solar state, and anthropogenic huffing and puffing has a negligible effect.

June 21, 2019 7:14 am

Seems almost counterintuitive to find that a quiet sun results in more radiation exposure.

John Tillman
Reply to  TomB
June 21, 2019 7:36 am

Most primary galactic cosmic rays are in fact charged particles rather than the photons of electromagnetic radiation. As such, they are deflected by the magnetic fields of the galaxy, sun and earth.

https://imagine.gsfc.nasa.gov/science/toolbox/cosmic_rays1.html

NASA’s writer should have said “atomic nuclei stripped of their” electons, not “atoms”.

Primary GCRs produce secondary particles in the atmosphere, which can form cloud condensation nuclei.

Pop Piasa
Reply to  John Tillman
June 21, 2019 8:41 am

NASA’s writer has a PhD in mathematics and is the production editor of Science@NASA.com. He has a side interest in GCR physics and uses that as the basis of teaching calculus that is relevant to research. I think Tony Phillips is one of the “real, pure” scientists still at NASA.

John Tillman
Reply to  Pop Piasa
June 21, 2019 9:58 am

I don’t know who wrote the article I linked. The site is a “service of the High Energy Astrophysics Science Archive Research Center (HEASARC), Dr. Alan Smale (Director), within the Astrophysics Science Division (ASD) at NASA/GSFC”.

But you don’t get a charged particle (proton or alpha particle, ie an H or He nucleus) by stripping off an atom. You do if you strip an electron off a hydrogen atom or two off a helium atom.

Pop Piasa
Reply to  John Tillman
June 21, 2019 10:21 am

Oops, sorry John. I misread your statement. I have seen Dr P make the same oversimplification of GCR physics.

John Tillman
Reply to  John Tillman
June 22, 2019 4:07 pm

No worries!

IMO anyone interested enough in GCRs to read that article would understand that atoms are composed of protons, neutrons and electrons, except for normal H, which has no neutron.

vukcevic
Reply to  John Tillman
June 21, 2019 9:33 am

For reasons of the solar magnetic field polarity during the SC minima following even numbered cycles there is a prolonged but somewhat less intense exposure to the GCR

vukcevic
Reply to  vukcevic
June 21, 2019 11:11 am

Cosmic rays shower
comment image

Schrodinger's Cat
Reply to  TomB
June 21, 2019 7:39 am

The radiation is cosmic rays from deep space, not the sun. The solar magnetic field normally deflects them but a quiet sun has weaker fields allowing the cosmic rays to reach earth in greater numbers. They are subatomic particles such as protons and electrons.

Reply to  Schrodinger's Cat
June 21, 2019 8:42 am

@cat

I am not so sure about that.
What we get from the stars is totally negligible compared to what we get from the sun?

John Tillman
Reply to  henryp
June 21, 2019 9:42 am

They’re called GCRs because they come from outside the solar system, as from supernovae and the supermassive black hole at the Milky Way’s center. The solar wind is also composed of charged particles, but earth’s magnetic field deflects most of them.

GCRs move at near light speed, while the slow solar wind near earth travels at 300-500 km/s, and the fast SW at up to 750 km/s.

Joel O'Bryan
Reply to  John Tillman
June 21, 2019 11:31 am

John,
high speed CME’s can approach and occasionally exceed 3,000 km/sec. Most are at below 1,000 km/sec. It is the CME’s that astronauts and satellite planners need to be concerned with, as the not just the particle speed goes up, but the fluence goes up dramatically (particles per area).

Even a manned Mars mission, the latest measurements tell us that CME events will be concern for extended manned Martian surface missions.

R.S. Brown
Reply to  John Tillman
June 21, 2019 8:26 pm

John, et al:

As the Sun “quiets” Earth’s atmosphere “shrinks”. It doesn’t mean
there’s less atmosphere between us and space… just that rarified
space is closer to ground level than usual.

The GCRs encounter atmospheric molecules at a lower level than
they might during an “active” Sun.

The cascades of daughter particles from GCR collisions with whatever
is floating in the now “lowered” upper levels of our atmosphere have
the opportunity to interact with “high” (as measured from ground
level) altitude objects.

So too will the dust/smoke from infalling meteorites make it to a
lower level… hence the recent plethora of noctilucent cloud
observations.

See:
https://spaceweatherarchive.com/2018/09/27/the-chill-of-solar-minimum/

John Tillman
Reply to  John Tillman
June 22, 2019 4:10 pm

Joel,

You’re right that I should have added CMEs to the solar wind mix.

But still less energetic than galactic cosmic “rays”.

MarkW
Reply to  henryp
June 21, 2019 4:30 pm

What we get from the sun are low energy and mostly deflected by the Earth’s magnetic field.

Joel O'Bryan
Reply to  Schrodinger's Cat
June 21, 2019 11:06 am

S-Cat,
The GCR’s that interact with Earth’s upper atmosphere are largely devoid of ultra-relativistic electrons due their trapping in the outer Van Allen radiation belt. Thus GCR’s of consequence to the Earth are almost all protons and some helium nuclei and even rarer high mass relativistic nuclei up to iron.
(ultra-relativistic electrons defined as > 5 MeV)

See more here:
“An impenetrable barrier to ultrarelativistic electrons in the Van Allen radiation belts”

D. N. Baker, A. N. Jaynes, V. C. Hoxie, R. M. Thorne, J. C. Foster, X. Li, J. F. Fennell, J. R. Wygant, S. G. Kanekal, P. J. Erickson, W. Kurth, W. Li, Q. Ma, Q. Schiller, L. Blum, D. M. Malaspina, A. Gerrard & L. J. Lanzerotti
Nature volume 515, pages 531–534 (27 November 2014)
https://www.nature.com/articles/nature13956

Joel O'Bryan
Reply to  Joel O'Bryan
June 21, 2019 11:38 am

and see an open access Supp Figure here from that paper:
https://www.nature.com/articles/nature13956/figures/9

Note: This is in situ measured data by a satellite. (Not some model simulation.)

Ryan Welch
Reply to  TomB
June 21, 2019 7:55 am

The sun’s magnetic field protects the earth from cosmic radiation.

Reply to  TomB
June 21, 2019 8:12 am

Tom
I think what happens is that
= > less solar magnetic field strengths
= > more of the most energetic particles being able to escape from the sun
earth’s atmosphere is obviously protecting us but at higher levels obviously there is more risk of exposure…?
= > more ozone, peroxides & N-oxides produced TOA
= > less UV going into the oceans
= > it is cooling

Mike Haseler (Scottish Sceptic)
June 21, 2019 7:25 am

On the positive side – if it weren’t for the global warming climate cult …. we’d be getting crazy lunatic rantings from the academics absolutely certain (they get money from) the global cooling climate cult.

F1nn
Reply to  Mike Haseler (Scottish Sceptic)
June 23, 2019 7:17 am

It´s very easy smoothly switch W to C = AGC. They are not going to abandon good cult.

rovingbroker
June 21, 2019 7:26 am

Anthony Watts wrote, ” … some airline flights are seeing doses of radiation up to 73 times that which we’d see at ground level.”

The “73 times” flight in the data box is XOJET 780, a charter jet (a Cessna Citation X) flying at 45,000 feet, not an airline flight at 35,000 and below like those listed.

Pop Piasa
Reply to  rovingbroker
June 21, 2019 9:07 am

That’s perfect irony. The rich and famous get most of the rads.
Let’s hope Gore and DeCrappio fly good and high.

mothcatcher
Reply to  rovingbroker
June 21, 2019 1:44 pm

Yeah, don’t see the point of the flights v rays table. Looks like altitude is the overwhelming factor in ray penetration, just as you would expect. And no other useful data shown.

“Some airline flights are seeing doses of radiation up to 73 times.. that at ground level”
Sounds like a bad advert for stain remover. So what? Do we have a useful comparison to previous solar cycles?

WXcycles
Reply to  rovingbroker
June 22, 2019 1:47 am

Long-haul cruise flights up to 41,000 feet occur as fuel burns away (depending on takeoff weights). Certainly 38 to 39kft is a common cruise altitude later during a flight. An altitude of 35kft would be low except for shorter distance domestic or intra-regional flights.

George
Reply to  rovingbroker
June 22, 2019 10:32 pm

Today there was a charter flight from LAX to White Plains, N.Y. at 49,000 ft. that received an 86.6 dose rate.

Bruce Cobb
June 21, 2019 7:28 am

Invest in lead aprons now.

Pop Piasa
Reply to  Bruce Cobb
June 21, 2019 8:59 am

Maybe tinfoil skycaps…

Steve Reddish
Reply to  Pop Piasa
June 21, 2019 11:54 am

If “tinfoil” sky caps would help, the airliner’s aluminum fuselage would have eliminated all exposure.

yarpos
Reply to  Steve Reddish
June 22, 2019 12:56 am

less so the carbon fibre ones

WXcycles
Reply to  Pop Piasa
June 22, 2019 1:50 am

Pressurized aircraft are already made of a thick gauge of aluminum ‘foil’, so no need to wear the foil beanie just yet.

vukcevic
June 21, 2019 7:29 am

“In addition, there are now forecasts that the next solar cycle, #25, will be the weakest in more than 200 years.”
If my calculations are any good (the last time gave the ‘incredibly’ accurate result http://www.vukcevic.co.uk/SSN.htm ), I have to estimate the max time of the SC25. Assuming this is a long minimum, the next max is most likely to occur some time in late 2025 or 26. If so the SC25 annual smoothed max would be be in the low 50s in the old (Wolf) numbers (mid 70s new corrected). As far as I understood Dr. Svalgaard predicts much higher peak possibly around 100 (Wolf), or in 140s in the new corrected numbers.

vukcevic
Reply to  vukcevic
June 21, 2019 10:46 am

Solar Cycle 25 Prediction Panel
“We expect Solar Cycle 25 will be very similar to Cycle 24: another fairly weak cycle, preceded by a long, deep minimum,”
SC24 peaked at 116 in April 2014.

François
Reply to  vukcevic
June 23, 2019 3:11 am

Then, according to the usual WUWT discourse regarding a “grand solar minimum”, it should feel cold. It does not.

F1nn
Reply to  François
June 23, 2019 8:46 am

Yeah, like AGW should feel warm. It doesn´t.

vukcevic
Reply to  François
June 23, 2019 1:42 pm

Dalton minimum was just couple of cycles which wasn’t long enough for temperature to drop significantly, most of the reduction is thought to be due to couple of large volcanic eruptions.
Maunder Minimum lasted 5 cycles, the fall in temperature started after about 20+ years.
According to my calculations, if they are any good,
http://www.vukcevic.co.uk/NH-GM.htm
you can see what might happen if there is another Maunder type minimum in the next few decades, depending on the 60 year and the multi-centenary cycles.

BallBounces
June 21, 2019 7:44 am

I guess blaming sunspot-famine on global warming and CO2 is a non-starter?

Pat Frank
Reply to  BallBounces
June 21, 2019 9:39 am

Blame Trump.

That’ll get a lot of traction in certain circles.

Joe Civis
Reply to  Pat Frank
June 21, 2019 11:18 am

YES! His intergalactic policies have the Sun in a huff, so it joined the resistance!

Cheers!

Joe

Thomas Homer
June 21, 2019 7:47 am

“We are constantly flying radiation sensors onboard airplanes over the US and and around the world, so far collecting more than 22,000 gps-tagged radiation measurements.”

Imagine if the purported ‘Greenhouse gas’ property could be measured. We could have sensors at ground level, and sensors on airplanes. We could generate meaningful charts and derive meaningful formulae describing this effect by elevation. And, we could begin to formulate answers to simple questions like: If Denver has a mile less of the densest atmosphere above it than does Miami, FL, why does Denver typically get several days per year over 100F while Miami has never been over 100F?

But alas, our inability to measure this ‘property’ leaves us unable to advance our knowledge.

Mark
Reply to  Thomas Homer
June 21, 2019 9:55 am

Miami is close to the ocean which has a localized cooling effect. Try central Florida in the summer and you will see 100F

John F. Hultquist
Reply to  Thomas Homer
June 21, 2019 10:04 am

Denver ==> Continental, lack of water mass, rain-shadow fewer clouds
Miami ==> Coastal, surrounded by water, clouds=reflection

The many real physical characteristics overwhelm any CO2 effect that might otherwise (or not) be there.

Climate classification systems have many categories.
Earth does not have a single ‘climate’.

Thomas Homer
Reply to  John F. Hultquist
June 21, 2019 10:26 am

John F. Hultquist: “The many real physical characteristics overwhelm any CO2 effect that might otherwise (or not) be there.”

Precisely!

Reply to  Thomas Homer
June 23, 2019 6:48 am

“Imagine if the purported ‘Greenhouse gas’ property could be measured. We could have sensors at ground level…”

And the TV weather forecasts would include the CO2 count for the day:

“CO2 in the tri-cities will be over 425 parts per million over the weekend. Temperatures will increase by 0.137 degrees Fareinheit. Instead of the previously predicted high of 87, get ready for a blistering 87.137 degrees both Saturday and Sunday.”

Ever hear that? Or anything like it? Any report of CO2 levels on the weather report?

No.

Goldenrod pollen counts in PPM, yes. Humidity, yes. Minutes of sunshine, yes.

Barometric pressure, yes.

Many, many, many measurements that effect our weather are reported every day. Never is CO2 reported.

Over and over and over the CO2 cult chants: Basic physics! Arrhenius!

What’s going on?

Tbruno214@comcast.net
June 21, 2019 7:53 am

So flying at a higher altitude increases your exposure. This is new?

rah
Reply to  Tbruno214@comcast.net
June 21, 2019 8:18 am

Flying high during a solar minimum increases your exposure over what is usual at other times during a solar cycle is what I got out of that particular point. And it makes a lot of sense.

Reply to  rah
June 21, 2019 8:23 am

flying at night is OK?

Chaswarnertoo
Reply to  henryp
June 21, 2019 10:30 am

Um, ok I’ll bite. No. The cosmic rays don’t come from the sun. Are you just trolling?

Reply to  Chaswarnertoo
June 21, 2019 10:44 am

We are going to die….
Eventually…
But for those who believe…

Reply to  Chaswarnertoo
June 21, 2019 10:50 am

No. I am puzzled by your comment.

MarkW
Reply to  Chaswarnertoo
June 21, 2019 4:29 pm

Since cosmic rays don’t come from the sun, day or night makes no difference.

Reply to  henryp
June 21, 2019 11:06 am

Nope–them Cosmics are 24/7

rah
Reply to  henryp
June 21, 2019 11:21 am

The way I understand it flying any time the weather allows is just fine. The exposure is still well below danger levels for normal air travelers. Does not matter if it’s day or night because the sources of the rays are from our galaxy and beyond and not from our sun. It’s just that the weakness of the suns magnetosphere is resulting in more cosmic rays reaching the earths magnetosphere and thus more of them penetrating our magnetosphere and atmosphere. The higher up in the atmosphere you are the greater the exposure. Astronauts outside of the earths atmosphere and yet still in earth magnetosphere are getting more than the those flying in the atmosphere. Astronauts that would be in space beyond earth magnetosphere would get even more and exposure to cosmic rays and solar radiation when the sun gets very active and has coronal mass ejections is one of the big problems that will have to be solved for extended space travel or habitation beyond a planets magnetosphere, such as a trip to mars or colonization of the moon.

RACookPE1978
Editor
Reply to  Tbruno214@comcast.net
June 21, 2019 9:35 am

Navy reactors on surface ships are, of course, installed below decks, below tons of steel and concrete and plastic shielding: The plastic slows and reflects neutrons, the steel provides pressure barriers for the high pressure steam and water and ships structural needs, the steel and concrete and water and petroleum fuel provides gamma and beta ray attenuation. Nuclear dosimetry is worn by all engineering personnel and by the CO and XO (who are always nuclear qualified officers.
On carriers, the CO and XO are also flight qualified. Those two are always the highest dosed individuals on the ship. Even though they have the LEAST time near the reactor! Even their time up high in the ship on the bridge and flight deck gives them more radiation from space than those who live below the shielding.

bwegher
Reply to  RACookPE1978
June 21, 2019 10:56 am

Nuclean submarine crews on deployment receive less radiation than civilians living on the surface.

rah
Reply to  bwegher
June 22, 2019 1:13 pm

water is a great insulator from radiation and cosmic rays.

June 21, 2019 8:00 am

Leif, I am a bit confused by your pdf.
Cannot I get the latest update on this graph here?
http://www.leif.org/research/Solar-Polar-Fields-1966-now.png

RACookPE1978
Editor
Reply to  henryp
June 21, 2019 9:26 am

henryp, Leif Svalgaard , charles the moderator,

Leif, I am a bit confused by your pdf.
Cannot I get the latest update on this graph here?
http://www.leif.org/research/Solar-Polar-Fields-1966-now.png

Actually, many of the graphs on our WUWT Solar reference page remain out-of-date (have not been updated) since the 2015-2016.

Reply to  henryp
June 21, 2019 10:04 am

Slides 9 ff show the polar fields for several cycles…
Slide 18 shows the polar fields for each cycle back to number 1.

Dodgy Geezer
June 21, 2019 8:02 am

“…….airline travelers (sic) getting dosed with up to 70 times more radiation……..”

Um. The implication there seems to be a bit misleading. Travellers are NOT getting 70x more radiation than usual – they are getting a maximum of around 70x the radiation at ground level.

A normal flight gives you radiation at about 40x ground level. So in this increased period of solar radiation, the amount you get is nearly doubled, compared to a less active period…

SMC
Reply to  Dodgy Geezer
June 21, 2019 9:51 am

Without defining what they mean by 70x normal radiation at ground level, their analysis is meaningless. The few times I’ve pulled out my survey meter on a plane, I typically see about 2-2.5mR/hr, at cruising altitude (typically 30-35k feet). Next time I’m on a plane (next week) I’ll see check and see if anything has changed.

dodgy geezer
Reply to  SMC
June 21, 2019 12:36 pm

ok – they mean some kind of average. there will be problems with any average but so long as they use the same averaging technique it should cancel out…

SMC
Reply to  dodgy geezer
June 21, 2019 1:54 pm

Ok fine. But they don’t tell us what the average is.

Kevin kilty
June 21, 2019 8:05 am

It is cold and cloudy here day after day. No summer yet. High today in the 40s. We are missing our opportunity to see those noctilucent clouds, darn it.

Reply to  Kevin kilty
June 21, 2019 8:54 am

and where is that?

Bindidon
Reply to  Kevin kilty
June 21, 2019 9:10 am

Oh sorry for you and family… Here in Northern Germany, the somewhat colder May has made way for a wonderfully warm June.

In France, however, they aren’t so happy, as they expect up to 40 °C next week.

Pop Piasa
Reply to  Bindidon
June 21, 2019 10:29 am

Blasted weather! If only there was some way to control it…🙄

tom0maason
June 21, 2019 8:13 am

😱 With less than 12 years left to live, who cares? 😉 ;-(

rah
June 21, 2019 8:16 am

And so, does this not seem the perfect time to be researching Henrik Svensmark’s theory and trying to quantify just how much effect cloud seeding by cosmic rays really does effect weather and climate?

I’ll tell you that based on just anecdotal evidence this truck driver observes in his little patch of this earth here in Indiana that there sure seems to be something to the idea the effect is significant. Seven days with 7″ in the rain gauge and more in the forecast and little sun between the showers and thunderstorms.

Eric
Reply to  rah
June 22, 2019 10:45 am

It’s been 12 years since his book “The chilling stars” was published. Quite an appropriate title. And there was the cloud experiment at CERN. But as with nearly everything you search for on the internet, there is still furious denials that cosmic rays have any affect on our weather. Only the existence of God seems to have as many internet battles. Then again, climate change is the new religion.

Terry clausen
June 21, 2019 8:16 am

From a top level look at things, the local green houses here in central iowa are no longer stocking zone 5 plants. I lost some that have been doing fine for the last 15 years. These last two years did them in. The green houses took some big hits this last winter and spring.

Gary Pearse
Reply to  Terry clausen
June 21, 2019 11:13 am

I had a large ash tree (red berry type) that used to fill mybackyard with berries that then filled my backyard with hundreds of blue grosbeaks that cleaned up the berries in a day ir two.

https://www.audubon.org/field-guide/bird/blue-grosbeak

The past three excessively cold winters killed it off ~1/3 at atime. We had to saw it down this spring.

Joel O'Bryan
Reply to  Gary Pearse
June 21, 2019 3:37 pm

Plant wild cherry trees. They are amazing bird attractors. Especially fun when the late ripe beries start fermenting and the birds get drunk.
I had 6 -7 big wild cherry trees on the back of my property in Massachusetts (abutted on the Assabet River). So much good natural bird food. The only down-side was the birds covered by back deck with cherry pit-seeds, and needed regular sweeping.

June 21, 2019 8:20 am

From the misleading headlines department:

Sun spotless for 33 days straight – airline travelers getting dosed with up to 70 times more radiation

Passengers typically experience dose rates that are 20 to 70 times higher than natural radiation at sea level.

So just how much more “cosmic radiation” (primarily high-energy protons and atomic nuclei) does one get from a spotless sun? It isn’t 7,000% now, is it?

Bruce Cobb
June 21, 2019 8:30 am

It’s Gaia’s revenge; for helping to kill the planet. Payback’s a beech.

beng135
Reply to  Bruce Cobb
June 22, 2019 10:23 am

Payback’s a beech.

Payback can also bite you in the ash.

kenw
June 21, 2019 8:37 am

Obviously the proper take away is that CO2 is weakening the sun’s output…..

Pop Piasa
June 21, 2019 9:03 am

I wager the presently humid mesosphere has as much to do with NLC formation as increased GCR. I’m getting the notion that nothing in nature has just a single factor driving it.

Jean Meeus
June 21, 2019 9:12 am

< Sun spotless for 33 days straight.

However, according to the SIDC (Belgium), there was a small sunspot on May 29.

Robert Watt
June 21, 2019 9:35 am

How do the predictions for sunspots made by Leif Svalgaard and his group compare with the predictions produced by Professor Valentina Zharkova, using a different method?

J Mac
June 21, 2019 9:42 am

Exposure to ‘cosmic radiation’ (high-energy protons and atomic nuclei) is making airline passengers into Genetically Modified Organisms! Oh noes – GMOs! Oh, the humanity….. /s

Gary Pearse
Reply to  J Mac
June 21, 2019 11:17 am

I’ve wondered if GCRs and background radionuclide radiation may be the mechanism driving evolution.

J Mac
Reply to  Gary Pearse
June 21, 2019 12:31 pm

They are certainly contributors, Gary!

Scott McNab
Reply to  J Mac
June 21, 2019 7:49 pm

Mainly the flight crew, they are under the windshield which allows a lot more rays to hit them, in addition they are in the air much more than most passengers.

WXcycles
Reply to  Scott McNab
June 22, 2019 2:51 am

There is far more mass within the plexiglass layers of the Windshield than within the skin of a jet. Optical transparency will not equate to a lack of attenuation of particles impacting it.

icisil
June 21, 2019 9:47 am

Supposedly, with more cosmic rays we should see more eruptions of volcanoes with silica-rich magmas.

MarkW
Reply to  icisil
June 21, 2019 4:34 pm

Cosmic rays don’t even penetrate all the way through the atmosphere, much less through miles of rock.
Even if they did, the total energy isn’t enough to make a measurable difference in the temperature of magma.

icisil
Reply to  MarkW
June 21, 2019 6:34 pm

Muons penetrate deeply into the earth, and they’re either cosmic radiation or generated by cosmic radiation. They don’t heat already hot magma, but apparently cause nucleation of bubbles in supersaturated magma that results in explosive eruptions.

William Astley
June 21, 2019 9:56 am

There is a group of solar scientists that argue the sun does not change and that there was no Maunder minimum and the sunspot record should be changed to agree with that position.

The problem with the sun cannot change theoretical position is it unfortunately leads one to ignore current observations that support the assertion that there has been a significant change in the sun.

William: There is observational evidence the Maunder Minimum happened. It is a fact that are cyclic climate changes in the paleo record including very large climate changes, such as the Younger Dryas, that correlate with solar cycle changes and geomagnetic field changes. There is no explanation as to cause of any of the observed climate/geomagnetic field changes.

https://arxiv.org/abs/1507.05191v1

The Maunder minimum (1645–1715) was indeed a Grand minimum: A reassessment of multiple datasets

Aims. Although the time of the Maunder minimum (1645–1715) is widely known as a period of extremely low solar activity, claims are still debated that solar activity during that period might still have been moderate, even higher than the current solar cycle # 24. We have revisited all the existing pieces of evidence and datasets, both direct and indirect, to assess the level of solar activity during the Maunder minimum.

Results. The level of solar activity during the Maunder minimum is reassessed on the basis of all available data sets.

Conclusions. We conclude that solar activity was indeed at an exceptionally low level during the Maunder minimum. Although the exact level is still unclear, it was definitely below that during the Dalton minimum around 1800 and significantly below that of the current solar cycle # 24.

Claims of a moderate-to-high level of solar activity during the Maunder minimum are rejected at a high confidence level.

Is there observational support that something unusual is happening to the sun? Yes!!!

https://iopscience.iop.org/article/10.1088/1742-6596/440/1/012001/pdf

The peculiar solar cycle 24 – where do we stand?

There were signs from the solar interior too that something unusual was going on inside the Sun. Data on solar oscillation frequencies that can be used to deduce conditions inside the Sun (see e.g. Christensen-Dalsgaard 2002). Solar oscillation frequencies are known to change with solar activity (Woodard & Noyes 1985; Elsworth et al. 1990; Libbrecht & Woodard 1990; and more recently Basu 2002; Howe et al. 1999).

These solar-cycle related changes are also correlated with solar activity indices (Jain & Bhatnagar 2003). The solar cycle-related change in the frequency of a given mode is known to be a function of the frequency of that mode.

High frequency modes have larger shifts than lower-frequency modes. and this implies that solar-cycle related changes in the solar structure occur predominantly in a thin sub-surface layer of the Sun (Nishizawa & Shibahashi 1995). The Birmingham Solar Oscillation Network (BiSON) has been collecting solar oscillation data for over thirty years. Its observations cover cycles 22 and 23 in their entirety and of all cycle 24 to date. The data also cover a few epochs of cycle 21.

Basu et al. (2012) showed that the frequency-dependence of solar-cycle related shifts was different during cycle 23 compared to cycle 22.

The correlation of the different solar activity indices with the frequency shifts was affected, and in particular, they showed that while the International Sunspot Number (ISN) and the 10.7 cm flux was correlated with the change frequencies during cycle 22, this correlation was lost after the maximum of cycle 23 (Figures 2 and 3 of Basu et al. 2012). Had this change in behaviour been detected in a timely fashion, it would have alerted us to the fact that the Sun was going through an unusual phase.

The correlation between frequency change and activity indices was regained for the high-frequency modes (ν > 2400 µHz) in cycle 24, but not for modes with lower frequencies.

The above examples are just some of the unusual characteristics of the minimum that have been documented in the proceedings of the SOHO 23 workshop entitled “Understanding a Peculiar Solar Minimum” (ASPCS Vol, 428). Other noteworthy differences include the fact that the fast solar winds were confined to higher latitudes — using interplanetary scintillation measurements Manoharan (2012) showed that at 125 R…

Reply to  William Astley
June 21, 2019 12:17 pm

The peculiar solar cycle 24
SC24 was not particularly peculiar. It was much like SC14, SC12, and SC5.

Bindidon
June 21, 2019 10:08 am

Instead of looking at sequences of spotless days, I prefer to keep reading info about the long term:
http://www.sidc.be/silso/node/152

Javier
Reply to  Bindidon
June 21, 2019 1:22 pm

Well, that’s the problem with sunspots as a measure of solar activity. Once they drop to zero there is no measurement of solar activity. 10.7 cm solar flux does not go to zero and therefore solar activity can be better gauged. So far the month with lowest 10.7 cm flux was last November. It will be interesting to see what the measurement for June ends up being.

Bindidon
Reply to  Javier
June 21, 2019 5:00 pm

Javier

You were told so many times about the SSN vs. 10.7 correlation that such comments become really ridiculous.

J.-P. D.

Javier
Reply to  Bindidon
June 22, 2019 4:28 am

Unlike most, instead of trusting what I am told, I actually check the data.

comment image

And what the data says is that 10.7 cm adjusted flux is less noisy and not capped at zero, and therefore more useful for defining the solar minimum in real time.

Observe how in August 2009 the number of sunspots was zero, yet the minimum had been nine months before. 10.7 cm adjusted flux however was two units higher in August 2009.

Keep counting sunspots if you want. I keep an eye on 10.7 cm flux because they don’t always give the same information and 10.7 in my opinion can be trusted more.

Now it is your comment that looks ridicule.

Bindidon
Reply to  Javier
June 22, 2019 2:57 pm

Sorry Javier, but…

… you were told of that some months ago by a person who really checks the data. Here is – again – a percentile based comparison of SSN with 10.7:

https://drive.google.com/file/d/1ShXgzae4Fr_fOs9kWJiSzD8yXkcewQZY/view?usp=sharing

{ The chart ends with Dec 2017 because the F10.7 record provided by LISIRD:
http://lasp.colorado.edu/lisird/data/noaa_radio_flux/

had a big hole in 2018). Maybe you have a better source allowing me to finalise the comparison. }

You see thus how wrong it can be to cherry-pick a single date within a long time series.

*
But how ridiculous you behave you see moreover when having a look at the chart below, showing the monthly differences between SSN and 10.7 for the same period:

https://drive.google.com/file/d/1yjvQYk0Q7oMxdpl9x_w3hriiBQiYzvQH/view

How is it possible to discuss the tiny differences around 2009 while ignoring that
– there were much greater ones within several other years, but
– the average difference for 1948-2017 was 0.07 % ?

But this is, like yours, only my simple layman’s look at the stuff.

What scientifically more educated people do, you can grasp when carefully reading the following ducument:

https://pdfs.semanticscholar.org/85d9/363b9c51d30ec3a1a2db3affcad3936798ad.pdf

The abstract:

We investigate the nature of monthly sunspot numbers and solar flux F10.7 by employing the linear and multiple regression techniques.

We observed a brilliant correlation between monthly mean sunspot number and F10.7.

We observed that even in deep solar minimum there exist some magnetic activities. We obtained the coefficient of determination R2 to be 0.9533.

We estimated the correlation coefficient for solar flux F10.7 and sunspot number to be 0.97. We extrapolated the F10.7 back to the year 1700 and observed a good correspondence between the modelled F10.7 and sunspot nature.

We also found a very good correspondence between the modelled and observed solar flux F10.7.

Il n’est jamais trop tard pour apprendre.

Javier
Reply to  Javier
June 22, 2019 4:53 pm

It seems you answered without reading my comments. I am discussing here that SSN “at the time of solar minima” is not the best way to measure solar activity. And this is because of two problems:
1. It has more noise. And part of it is the way sunspots are counted as a single sunspot counts as 11 (10 for forming a group and one for the sunspot), while two sunspots count as 12. So they might count 23 sunspots when there are only three in two groups.
2. It is capped at zero. Once there are no sunspots if solar activity goes lower there is no way to know.

10.7 cm flux does not have any of those problems and it is a more reliable way of gauging solar activity during solar minima. And I showed the data that proves it:

comment image

It has less noise and defines better the minimum in activity. You can ignore it as much as you want. I don’t care.

Bindidon
Reply to  Javier
June 27, 2019 10:14 am

Javier

Sorry again, but I still can’t agree with what you pretend concerning the SSN accuracy compared with that of F10.7 when looking at your mid 2007 – end 2009 example using monthly averages.

Here is a graph showing the two plots for this period:
https://drive.google.com/file/d/12QdLjNh8BSQ7UIQxsQbxIOHuB17xMcL3/view

There is no reason at all to prefer F10.7 just because SSN drops down to zero at one place.

It becomes even more evident when you switch to a percentile based comparison where both plots reach zero when showing least data values:
https://drive.google.com/file/d/1xTsSUrL2ibv-LtAU9NIaOcOuqidovCAB/view

*
But… here, Javier:
https://drive.google.com/file/d/1JbUKZwfqBXCu49YoJ5sJVzU1gTSpAyo6/view

you are obviously right. This shows SSN vs. F10.7 for 20019, April 1 till May 31.

People who need / wish to observe daily solar activity certainly won’t rely on SSN, as the F10.7 flux info is much more detailed.

Here I can understand what you mean.

ResourceGuy
June 21, 2019 10:17 am

I guess global virtue signaling jet setting does have a price after all.

NickSJ
June 21, 2019 10:41 am

Perhaps a minor point, but no commercial airliners fly at 45,00 feet. The highest airliner service ceiling I’ve seen is 43,000 feet, and virtually none actually fly above 41,000 feet. The vast majority of flights occur between 30,000 and 40,000 feet.

Reply to  NickSJ
June 22, 2019 12:20 pm

NickSJ
“The highest airliner service ceiling I’ve seen is 43,000 feet, and virtually none actually fly above 41,000 feet. ”
If I may –
“The highest c u r r e n t airliner service ceiling I’ve seen is 43,000 feet, and virtually none actually fly above 41,000 feet. ”
Concorde had a service altitude of about 60,000 feet.
Now, of course, only seen in museums.

Auto

Gary Pearse
June 21, 2019 10:42 am

So, it must also increase radiation at ground level. Do we have data for that?

vukcevic
Reply to  Gary Pearse
June 21, 2019 12:58 pm
Mike B
June 21, 2019 11:10 am

Solar Cycle 25 is starting about right now or will be in a few months. I think those predictions it happened some months ago are proving to be off some.

Edim
June 21, 2019 11:12 am

Regarding solar minimum, the best insight is given by the butterfly diagram. It is easy to see when the new butterfly (however fuzzy) starts forming. Unfortunately, I couldn’t find any that is updated regularly. This one here (Hathaway) was last updated on 02/2019:
http://solarcyclescience.com/bin/bfly.jpg

I found another one here, seems to be updated on 06/2019:
comment image

So, there is still NO sign from the sc25 butterfly. That means that the 24/25 minimum is not here yet, and it will be extended and deep, something like the 23/24 one.

tty
Reply to  Edim
June 21, 2019 12:22 pm

Incidentally this would give a few years warning of a “Maunder Minimum”. During the MM the “butterfly” did not extend beyond 20 degrees latitude, and perhaps as little as 15 degrees during the weakest part.

Reply to  Edim
June 26, 2019 11:17 am

Yes. Sitting on the toilet I often have that a big wind can cause a butterfly!

Mike B
June 21, 2019 11:14 am

If Solar Cycle 25 ends up weaker than 24 then Zharkova may end up being right about Cycle 26 literally being dead like in a mini ice-age.

Chaswarnertoo
Reply to  Mike B
June 23, 2019 7:37 am

Looking like the lady is correct. I’m buying new skis!

Yooper
June 21, 2019 11:34 am

Interesting that Prof. Valentina Zharkova hasn’t been heard from since last October (at least DDG can’t find anything). I wonder what her current thinking is?

Mike B
Reply to  Yooper
June 21, 2019 12:29 pm

I agree. SC 25 should tell us a lot about her predictions if they haven’t changed.

jim edwards
Reply to  Yooper
June 21, 2019 9:02 pm

I have heard her paper is going through final stages and should be release shortly. I expect more chatter over her work in the coming months.

Bob Weber
June 21, 2019 12:35 pm

Are we in a grand solar minimum? No, not yet anyway.

The Maunder Minimum is considered the last GSM. Since then the Dalton Minimum and Centential Minimum are the next lowest solar activity periods lasting at least two solar cycles.

The Maunder had a group sunspot number of 1.0, while the Dalton averaged 2.3, the Centential average was 3.5, and through 2015 it was 3.7 for solar cycle 24. Using GN = 0.0468*v2SN + 0.6797, solar cycle 24 GN through May 2019 is about 3.1.

Therefore at over three times the GN as the Maunder, we will not reach a low GSM level in SC24.

Solar indices indicate SC24 activity is still so far higher overall than during the last minimum.

Zero sunspots total count at 433 days as of yesterday for this SC24 minimum compared to 817 total for the last minimum.

Too many eager beavers are fear-mongering over a thus-far non-existent GSM. Don’t even talk to me about a GSM until we’ve had a Dalton-like year of zero sunspots first, or five years without reaching 100 sunspots in SC25.

Bindidon
Reply to  Bob Weber
June 21, 2019 1:53 pm

Bob Weber

Thanks, here you show appreciated matter.

rah
Reply to  Bob Weber
June 22, 2019 2:38 am

It’s easier for them to hype this because there is no detailed accepted scientific definition of a Grand Solar Minimum.
BTW though the author of the article talks about a new method of solar forecasting that is predicting SC-25 to be less active than SC-24, SILSO has not changed it’s projection and still shows SC-25 to have about the same level of activity as SC-24.

“This prediction is now given in the scale of sunspot number Version 2. Therefore, solar cycle 25 will be similar to cycle 24, which peaked at 116 in April 2014.”
http://sidc.oma.be/silso/

Bindidon
Reply to  rah
June 23, 2019 2:16 pm

Exactly.

Bindidon
June 21, 2019 12:35 pm

“Solar experts predict the Sun’s activity in Solar Cycle 25 to be below average, similar to Solar Cycle 24”

https://www.weather.gov/news/190504-sun-activity-in-solar-cycle

There you read:

“We expect Solar Cycle 25 will be very similar to Cycle 24: another fairly weak cycle, preceded by a long, deep minimum,” said panel co-chair Lisa Upton, Ph.D., solar physicist with Space Systems Research Corp. “The expectation that Cycle 25 will be comparable in size to Cycle 24 means that the steady decline in solar cycle amplitude, seen from cycles 21-24, has come to an end and that there is no indication that we are currently approaching a Maunder-type minimum in solar activity.”

Alarmism in whichever direction is bare nonsense.

Rgds
J.-P. D.

Reply to  Bindidon
June 22, 2019 12:21 pm

I agree with you on the claim being over hyped. No one knows what level of cooling this trend will peak at. There is one example though of a major temp drop in the NH occurring right in the middle of the Medieval WP. It takes place around 1130 AD, and the drop in temps is the deepest drop on the 2,000 years represented on the graph. … http://www.uni-mainz.de/eng/bilder_presse/09_geo_tree_ring_northern_europe_climate.jpg

Note that around 10 years prior was the initial start of a cool trend. Hekla volcano in Iceland started a violent eruption in 1104 with 30 eruptions in the years which followed. Perhaps Hekla’s eruptions led into a natural cooling trend such as a Gleissberg/grand minimum, and that is why the cooling seen at that point in time was so deep. It lasts about 60 years, which was also the length of the Maunder GM. So imo it would take a major eruption, ie: Iceland, Alaska, Kamchatka all have volcanoes capable of affecting the entire NH.

Bindidon
Reply to  goldminor
June 23, 2019 2:12 pm

goldminor

Thanks for your convenient reply focusing on the center of an endless debate about what caused the successive cooling phases between 1000 AD and present.

But… just a question: if you think that Hekla’s 1140 AD eruption with a VEI 4 (and its followers) had such a cooling effect on climate: what then do you think of the effect of all these eruptions noted below, having all occured before the last Maunder GSM?

– 1257 Samalas, Indonesia, VEI 7
– 1280 Quilotoa, Andes VEI 6
– 1452 Kuwae, Vanuatu, VEI 6+
– 1477 Bárðarbunga, Island, VEI 6
– 1563 Agua de Pau, Acores, VEI 5
– 1580 Billy Mitchell, Solomon Island, VEI 6
– 1586 Kelut Island, VEI 5
– 1600 Huaynaputina, Peru, VEI 6
– 1641 Mount Melibengoy, Phillipines VEI 6
– 1650 Kolumbo, Greece, VEI 6
– 1660 Long Island, Papua New Guinea, VEI 6

Please take into account that eruptions with a VEI equal or superior to 5 mostly are able to bypass the Equator. The Samalas eruption in 1257 is known to have caused 15000 deaths in London (33% of its population at that time) during the year 1258.

Maybe you had a look at e.g.

https://agupubs.onlinelibrary.wiley.com/doi/full/10.1029/2011GL050168

Reply to  Bindidon
June 25, 2019 8:52 pm

I think that every eruption which you listed above can be sen clearly on the JG/U @K tree ring study. That is what I think.
1257 = substantial cold trend, lasts around 60 years
1280 = temps had warmed from prior cold then suddenly plunge cold for another 8 years approximately
1452 = 2nd deepest drop, then warms over 20+ year till around 1477 when temps plunge again for around 6 more years
1563 1580 1586 1600 = a GM at 1560 for 30 years and 80 86 are end of cold trend. 1600 is a temp drop short tern about 12 to 15 years
1641 1650 1660 + all show up as temp drops on the JG/U graph

http://www.uni-mainz.de/eng/bilder_presse/09_geo_tree_ring_northern_europe_climate.jpg

Bindidon
Reply to  goldminor
June 27, 2019 2:01 pm

Yes indeed, I agree.

The interesting point in the JGU graph is imho the running mean showing as usual much more than does a linear estimate alone.

The second point is that during the Maunder Minimum, the running mean’s deviations below the linear trend are minimal in comparison with those around 1150, 1450 etc.

This graph is so interesting that I’ll try to obtain the data source from JGU.

Gordon Dressler
June 21, 2019 1:11 pm

Meanwhile, a passel of climate “scientists” are gathering to apply for a Government grant and author a paper on how mankind’s CO2 emissions over the last 200 years have affected the sunspot cycle.

Rumor has it that the basis for this claim is Earth’s increased radiation forcing of the Sun’s photosphere and coronal environmental energy budgets, estimated at 1.473 x 10^(-18) watts/m^2 per deg-F increase in Earth TOA effective radiation temperature (sunlit side, of course). Oh, lest I forget, that’s with a 2-sigma error band of 2.951 %.

Bindidon
Reply to  Gordon Dressler
June 21, 2019 1:46 pm

Source?

David A
Reply to  Bindidon
June 21, 2019 9:19 pm

It is certainly sarcasm. Right?

Bindidon
Reply to  David A
June 22, 2019 2:34 pm

If sarcasm was a synonym for ignorance, then: yes.

Reply to  Bindidon
June 23, 2019 5:45 am

David
he is a jolly joker.
there is no man made warming
anyone believing that the 50-100 ppm CO2 that was added to the atmosphere in the past 50-100 years can do anything on earth or on sun has absolutely no idea of how life came to be what it is now.

vukcevic
June 21, 2019 1:13 pm

About 2% up on mid May when the SSN count was around 20-25 points
http://cr0.izmiran.ru/scripts/nm64queryD.dll/mosc?PD=1&title=Moscow&dt=0&base=9600&Res=1_hour&y1=2019&y2=2019&m1=4&m2=6&d1=21&d2=21&h1=19&h2=19
which was due to a coronal mas ejection i.e a Forbush dip.

Schrodinger's Cat
June 21, 2019 1:26 pm

The current debate reminded me of some thoughts I had several years ago. I was trying to find a plausible link between solar activity and climate. I reasoned that apart from TSI, the sun interacted with the earth via particle emissions (solar wind), its massive magnetic field and indirectly through modulation of GCRs. I further reasoned that the most powerful mechanism for climate interaction would be via albedo changes. I set about to find a suitable candidate.

Cosmic dust, asteroid fragments and meteor debris enter our atmosphere all the time. Estimates of the amount vary from about 36 thousand tons to 5 million tons per annum. The range 37000 to 78000 tons is often quoted. The huge range suggests that we don’t really know.

NOAA has reported that aerosols in the stratosphere have almost doubled during the decade starting in the year 2000, this at a time when it was thought that terrestrial emissions were constant. The increase had a significant cooling effect that offset some of the warming expected from increased carbon dioxide over the same period. A study reported in the Journal of Geophysical Research (1) claims an inverse relationship between meteor rates and solar activity as measured by sunspot numbers. This fascinating possibility suggests a connection between cooling caused by meteor dust and the solar cycle.

Meteor “smoke” nucleates ice crystal formation in the mesosphere, creating noctilucent clouds (2). Nasa claims that these clouds are known to peak at solar minima. This ties in with the modulation of dust flux by the solar cycle. Some climate scientists regard such clouds as indicators of climate change (3) and suggest that the water is produced by photocatalytic oxidation of the greenhouse gas, methane. Perhaps a simpler explanation is that meteors entering the mesosphere frequently bring their own water in the form of ice.

There is speculation that the metallic dust may interfere with stratospheric chemistry and ozone. It is well established that iron rich dust entering the upper oceans will fertilize phytoplankton (4) growth thus removing carbon dioxide from the atmosphere and the warming it would otherwise have caused.

So there we have several mechanisms. Meteor dust particles can reflect solar radiation directly by scattering, help to seed clouds, remove CO2 via phytoplankton growth and modify our atmospheric chemistry. The dust entering our atmosphere is greatest when there is low solar activity.

Perhaps there is more to meteor storms than meets the eye.
(1)https://agupubs.onlinelibrary.wiley.com/doi/abs/10.1029/JA082i010p01455#references-section
(2) https://www.nasa.gov/mission_pages/aim/news/early-nlcs-2013.html
(3) https://projectpossum.org/research/noctilucent-cloud/about-noctilucent-clouds/
(4) https://www.ncbi.nlm.nih.gov/pubmed/16370118

WXcycles
Reply to  Schrodinger's Cat
June 22, 2019 2:46 am

You seem to be saying that the location of meteorite ‘dust’ concentration varies with respect to the orbital geometry of earth (which of course varies) during solar activity level changes. And yet the location and intensity of meteorite showers is fairly predictable as we pass through them. So what evidence is there to the contrary?

Personally I find it amazing that Milankovich Cycles explain so much of the features of the palaeo T record but then seems to fail to explain major cyclicity change within the Quaternary record. Which makes me think the sun can undergo signicicant changes over >2my periods that we don’t know about yet, and that the explanation of climate change is not just about geo-tectonic configurations or resulting variable orbital/rotation wobbles. And if there are varying cyclic T periodicity changes recorded that Milankovich Cycles can’t explain, and there are, then it’s conceivable smaller periodic excursions of such a mechanism can occur as well.

Javier
Reply to  Schrodinger's Cat
June 22, 2019 10:33 am

Your first reference is from 1977, at the early years of satellite observations. It is really touching that you would embrace a hypothesis that has not found support in 40 years of improved observations. If the author is still alive he would be thrilled to know he got a supporter, unless of course he abandoned his own hypothesis some time later. After all he claimed an inverse relationship between meteors and solar activity after only 8 years of observation, when for a cycle of 11 years, a minimum of 22 years of data would be desirable. By now we must have about 50 years of data, and it is curious that nobody has noticed the same relationship.

Reply to  Schrodinger's Cat
June 22, 2019 11:37 am

+10 …interesting idea, so maybe the metallic dust is an integral part of that layer of the atmosphere, and the change in concentration of the dust is part of what drives shifts in the climate from warm and cool trends.

J Cuttance
June 21, 2019 1:41 pm

Is the Earth’s general albedo up? Sources, please.

ren
June 21, 2019 2:00 pm

The current figures below show the NAIRAS prediction of the radiation exposure quantity related to biological risk – Effective dose rate (uSv/hr) – at several altitudes and flight paths. To put the exposure rates into perspective, one chest X-ray is about 100 uSv, and a CT scan is about 8,000 uSv.
http://sol.spacenvironment.net/nairas/Dose_Rates.html

tty
Reply to  ren
June 21, 2019 4:44 pm

Actually it is unproven that such low dose rates have any biological effect whatsoever. It may even decrease cancer risk.

Reply to  tty
June 21, 2019 6:03 pm

Possibly but I know of two pilots who died of cancer right after retirement at 65. Of course it could be coincidence.

Reply to  tty
June 21, 2019 6:05 pm

Pilots are concerned.

Chaswarnertoo
Reply to  davidgmillsatty
June 23, 2019 7:46 am

Pilots in the UK have been monitored for 40 years. No evidence of any increase in cancer vs control groups.

ren
June 21, 2019 2:05 pm

The important thing is that the Earth’s magnetic field concentrates galactic radiation in specific regions at high latitudes.
http://sol.spacenvironment.net/raps_ops/current_files/Cutoff.html

Flight Level
June 21, 2019 2:30 pm

Just checked: I’m not glowing in the dark.

Therefore no evidence to justify a “radiation worker” pay-rise. Sarcasms set aside, reality is that no one I know in the trade shows concerns for in-flight radiation. Nor has called sick due to radiation overdose.

Ken
June 21, 2019 3:17 pm

Does anybody know if this changes the balance between UV-A and UV-B at the earth’s surface?

Right-Handed Shark
June 21, 2019 3:56 pm

If this does result in significant cooling whilst CO2 continues to rise, the climate spin doctors will go into overdrive.
“Surface temperatures and sea level have risen to their lowest levels in decades. Polar ice has melted so fast that it has increased exponentially. The climate has degraded into unpredictable instability, and this is precisely what we warned you would happen”
And the gullible masses will swallow it whole.

Bruce A. Frank
June 21, 2019 4:25 pm

I have always been under the impression that a lack of sunspots indicated a lower level of radiation, not higher?

Richard Patton
Reply to  Bruce A. Frank
June 21, 2019 9:01 pm

True, lower solar radiation which means less solar wind, which means more cosmic rays, when they hit the upper atmosphere cause a lot of secondary radiation. So lower solar radiation=more radiation from cosmic rays.

Bruce A. Frank
June 21, 2019 4:41 pm

The sun doesn’t generate the magnetic field that protects the earth from cosmic rays. The earth generates that magnetic field.

June 21, 2019 4:58 pm

So if the radiation at altitude is increasing, then why are the Greens not
telling u to stop flying. After all think of the vast amounts of CO2 being
produced by the jet engines.

But wait, if we ban planes, then how can we continue to go to all of the
big talk fests about climate change, silly thought.

MJE VK5ELL

jim heath
June 21, 2019 6:00 pm

Ban carbonated drinks, flat beer anyone?

GUILLERMO SUAREZ
June 21, 2019 6:53 pm

Earth’s Magnetic poles are on the move, and it’s magnetic field is also weakening , considerably , so if this trend continues , the escalating threat to frequent fliers and astronauts is imminent . A recent article published in one of the leading Geophysics Journals highlights evidence that supports the hypothesis that some extinction events, such as the disappearance of the Neanderthals 40,000 years ago, and possibly the North American megafauna(12800 bp ) , maybe linked to transient reversal, and weakening of Earth’s Magnetic poles.

WXcycles
Reply to  GUILLERMO SUAREZ
June 22, 2019 2:58 am

” … highlights evidence that supports the hypothesis that some extinction events, such as the disappearance of the Neanderthals 40,000 years ago, … maybe linked to transient reversal, and weakening of Earth’s Magnetic poles.”
>>

Somehow humans were exempted? Maybe we really were all trogs. And somehow chimps and mountain gorillas survived as well? I’d be looking for another explanation.

June 21, 2019 7:45 pm

Here is an opportunity to corroborate or reject the protective effect of long term exposure to low-level radiation. Compare the cancer rate for pilots and flight attendants with the rest of the population.

Reply to  Dan Pangburn
June 22, 2019 7:04 am

good point!!!

icisil
Reply to  Dan Pangburn
June 22, 2019 8:01 am
Reply to  icisil
June 22, 2019 8:36 am


@icisil

I must say that I am quite shocked about this. I am sure nobody ever told the pilots and attendants that they were more at risk of dangerous radiation when they were employed? This could be a major claim coming up at some time in the future.
But indeed, it does make sense. However, my thinking is that it is not cosmic radiation, as the report is claiming.. It is the sun’s radiation. The lower the sun’s solar polar magnetic field strengths, the more of the most energetic are -or can be – released from the sun. Our atmosphere is protecting us by forming ozone, peroxides and N-oxides. However, the higher you are the less air you have to protect you….

tty
Reply to  HenryP
June 22, 2019 10:26 am

If you are “shocked” by this then you are remarkably ignorant of basic physics. Which is proven by the nonsense about the sun.

Incidentally there is a lot more to be shocked by. For example people living in granite areas are exposed to considerably increased radiation levels. As are people who eat bananas (0.1 microsievert/banana).

Reply to  icisil
June 23, 2019 12:58 pm

This documents that low dose whole body gamma radiation has a protective effect: https://www.ncbi.nlm.nih.gov/pmc/articles/PMC2477708

The high cases of melanoma in the high flyers suggests conflation.

Tom in Florida
Reply to  Dan Pangburn
June 22, 2019 8:11 am

Way too difficult. You would have to document lifestyles, diet, exercise, genetics, drug use, and much more for thousands of people over a long period.

Scott McNab
June 21, 2019 7:50 pm

Been reading for over 10 years that low sun spots, create more gamma rays which allow more clouds, which I guess makes more rain, and that is what we are seeing..

SAMURAI
June 21, 2019 8:39 pm

The strongest Grand Solar Maximum event in 11,400 years occurred for 63 years from 1933~1996.

There hasn’t been a global warming trend since these abnormally strong solar cycles ended in 1996, despite 30% of all man-made CO2 emissions since 1750 being emitted just since 1996, if the 2015/16 Super El Niño spike is factored out.

The next La Niña cycle starting at the end of next year will very likely be a strong one, which will finally negate the 2015/16 Super El Niño spike. Moreover, the PDO, AMO, NAO and AOO are all approaching their respective 30-year cool cycles, and the the NAO cool cycle seems to have started.

Since 1850, global temps rise during 30-year ocean warm cycles, and fall during 30-year cool cycles. Period.

To top it off, a 50-year Grand Solar Minimum event seems to have already started which will add to the coming global cooling.

Given all these converging global cooling phenomena, by the end of Trump’s second term, the absurd CAGW scam will be laughed at.

KLohrn
Reply to  SAMURAI
June 21, 2019 11:24 pm

And why you’ve seen it approached by state and local government. Which in most cases probably worse thought out, which in turn leads to more Centralized power,,, after all those local measures are tossed out as failing to produce sustainable tax dollars they bet on coming.

SAMURAI
Reply to  KLohrn
June 22, 2019 4:21 am

The Constitution allows state and local governments to pretty much do anything that’s not specifically granted to the federal government in Article 1 Section 8, providing these laws and policies don’t infringe upon citizen’s civil rights, and with the proviso federal funds will never be used to bail out states who foolishly overspend and under-tax
their residents on crazy Leftist policies…

My advice to anyone living in insane Leftist states is to move, and do so quickly…

ironicman
Reply to  SAMURAI
June 21, 2019 11:35 pm

Thanks Sam, I believe you have pretty much nailed it.

Geoff Sherrington
June 21, 2019 11:39 pm

The lead article as reported shows two bad uses of measured data.
1. There are too many significant figures in the ratio of airborne to ground radiation. You can’t quote 73.3. Better to write “About 70 times”.
2. Dangers in using average radiation exposures for people on the ground compared with airborne. The literature has numerous examples of how different rooms in a home have different levels from effects like radon movement. What matters to the person, for health purposes, is the time exposed to high levels and not the time exposed to local or regional averaged levels. Also, time exposed to low levels is important medically, though not as sensational and thus often ignored or downplayed.
The lead article is spoiled by an attempt to sensationalise it and to make it look like sexy, trendy science. Should not do that, authors. Geoff

Patrick MJD
June 22, 2019 12:07 am

When flying in such skies, people worry about Chernobyl.

yarpos
Reply to  Patrick MJD
June 22, 2019 12:57 am

I worry about Chernobyl, and the luggage handling system at Heathrow.

Reply to  yarpos
June 22, 2019 12:36 pm

There would be reason to worry about the luggage handling ‘system’ at Heathrow.
Although better than it used to be [except when ‘they’ initiate an “Improvement”], the old adage,
“Breakfast in London; Lunch in New York; Luggage in Ulan Bator”, was pretty accurate.

Auto

icisil
Reply to  Patrick MJD
June 22, 2019 7:53 am

There would be reason to worry about Chernobyl, depending on what parts you visit … or what part visits you. The Red Forest is highly radioactive (some measured hotspots @ 1 mSv/hr), and the wood is not decaying properly there possibly due high radiation effect on insects, fungi and microorganisms.

Forests Around Chernobyl Aren’t Decaying Properly
https://www.smithsonianmag.com/science-nature/forests-around-chernobyl-arent-decaying-properly-180950075/

This presents a problem because accumulated debris increases the risk of forest fires that make the radioisotopes airborne again.

Heavily Contaminated ‘Red Forest’ Near Chernobyl on Fire
https://sputniknews.com/europe/201806051065132274-chernobyl-red-forest-fire/

angech
June 22, 2019 12:12 am

All too confusing. Almost deliberately so. By all sides.
How does the actual temperature of the sun vary with time and what is the correlation of the temperature to the sunspot cycle.
How does the actual average distance of the earth from the sun vary with time over a thousand year period?
Both are important to working out the actual sun exposure while being different from what actually gets through due to albedo changes.

chaamjamal
June 22, 2019 2:44 am

On the responsiveness of surface temperature to the sunspot cycle

https://tambonthongchai.com/2019/06/19/sunspots-and-temperature/

June 22, 2019 4:01 am

Leif says

‘the next maximum will be a bit stronger than SC24’

At least there I agree now with Leif!! We had the double pole switch on the sun in 2014 and IMHO that was the beginning of the new GB cycle. At that time the solar polar field strengths were at their lowest.

It cannot go lower still so it must go up, most likely by the same pace going up as in the past it was going down.

All planets arrived in time. I predicted a few years ago that SC 25 will be similar in size than SC 23….It seems I was right. SC26 will be similar to SC22, etc., etc.

Of course we are still reading the SC’s wrong. You must read them in pairs. (Nicholson – Hale cycle)

Alex
June 22, 2019 5:07 am

This is normal.
When they are these phases they last a long time, and this century will be so.
The next cycle will decrease further, like the next one.

Johann Wundersamer
June 22, 2019 8:24 am

That’s Steven Mosher wet dreams :

ONE month he always can refer to.

And too one month he can blame “deniers” always falsely referring to:

“Steven Mosher June 21, 2019 at 7:59 pm

now all we need is a year where its only june”

June 22, 2019 8:37 am


@icisil

I must say that I am quite shocked about this. I am sure nobody ever told the pilots and attendants that they were more at risk of dangerous radiation when they were employed? This could be a major claim coming up at some time in the future.
But indeed, it does make sense. However, my thinking is that it is not cosmic radiation, as the report is claiming.. It is the sun’s radiation. The lower the sun’s solar polar magnetic field strengths, the more of the most energetic are -or can be – released from the sun. Our atmosphere is protecting us by forming ozone, peroxides and N-oxides. However, the higher you are the less air you have to protect you….

RACookPE1978
Editor
Reply to  HenryP
June 22, 2019 10:11 am

No, the sun’s radiation does not produce the same barrage of secondary high-energy ions and particles that come after cosmic radiation hits the atmosphere and its dust-gas-particle barriers.

Reply to  RACookPE1978
June 22, 2019 11:31 am

@RACook

one of the rare occasions where we seem to disagree; there was a small error that slipped through my last comment. It should read:

It is the sun’s radiation. The lower the sun’s solar polar magnetic field strengths, the more of the most energetic PARTICLES are -or can be – released from the sun. Our atmosphere is protecting us from this dangerous radiation by forming ozone, peroxides and N-oxides. However, the higher you are the less air you have to protect you….

Hence, do not go to Mars before you have created an atmosphere similar to that of earth’s

June 22, 2019 9:19 am

The important result is that we are entering the Landscheidt mini Iceage. See Paullitely.com for verifiable details.

June 22, 2019 11:32 am

@RACook

one of the rare occasions where we seem to disagree; there was a small error that slipped through my last comment. It should read:

It is the sun’s radiation. The lower the sun’s solar polar magnetic field strengths, the more of the most energetic PARTICLES are -or can be – released from the sun. Our atmosphere is protecting us from this dangerous radiation by forming ozone, peroxides and N-oxides. However, the higher you are the less air you have to protect you….

Hence, do not go to Mars before you have created an atmosphere similar to that of earth’s

bonbon
Reply to  HenryP
June 23, 2019 4:08 am

Lava tubes bring shielding with the territory.

ren
June 22, 2019 11:53 am

Professor Valentina Zharkova gave a presentation of her Climate and the Solar Magnetic Field hypothesis at the Global Warming Policy Foundation in October, 2018.

Principal component analysis (PCA) of the solar background magnetic field observed from the Earth, revealed four pairs of dynamo waves, the pair with the highest eigen values are called principal components (PCs).

PCs are shown to be produced by magnetic dipoles in inner and outer layers of the Sun, while the second pair of waves is assumed produced by quadruple magnetic sources and so on. The PC waves produced by a magnetic dipole and their summary curve were described analytically and shown to be closely related to the average sunspot number index used for description of solar activity. Based on this correlation, the summary curve was used for the prediction of long-term solar activity on a millennial timescale. This prediction revealed the presence of a grand cycle of 350-400 years, with a remarkable resemblance to the sunspot and terrestrial activity features reported in the past millennia: Maunder (grand) Minimum (1645-1715), Wolf (grand) minimum (1200), Oort (grand) minimum (1010-1050), Homer (grand) minimum (800-900 BC); the medieval (900-1200) warm period, Roman (400-10BC) and other warm periods.

This approach also predicts the modern grand minimum upcoming in 2020-2055.
https://www.youtube.com/watch?v=M_yqIj38UmY&t=3257s
http://www.solen.info/solar/polarfields/polarfields.png

Chaswarnertoo
Reply to  ren
June 23, 2019 7:52 am

Yep. Wish someone could prove her wrong, I can’t.

Javier
Reply to  Chaswarnertoo
June 23, 2019 2:28 pm

Ilya Usoskin did prove her wrong:
Usoskin, I.G., 2018. Comment on the paper by Popova et al.“On a role of quadruple component of magnetic field in defining solar activity in grand cycles”. Journal of Atmospheric and Solar-Terrestrial Physics, 176, pp.69-71.
https://arxiv.org/pdf/1710.05203

Bindidon
Reply to  ren
June 23, 2019 1:18 pm

Ren

The cooling sum of all solar minima (Oort, Maunder, Dalton, Wolf) will, according to research done by Stefan Rahmstorf, certainly not be below -0.5 °C / decade.

Rahmstorf was discredited many times on many blogs, but was never scientifically contradicted.

When an experienced person like Leif Svalgaard confirms what Zharkova pretends, then it will be time to accept her claims. And not before, ren.

Bindidon
Reply to  Bindidon
June 23, 2019 2:49 pm

“… certainly not be below -0.5 °C / decade.”

Sorry: per century…

pigs_in_space
June 23, 2019 12:32 am

I have been regularly measuring radiation in aircraft for the last 6 months since I got a mobile geiger muller counter. (Ukraine makes excellent ones!)
Flying at anything near 60N (my regular flights) raises secondary spallation radiation from cosmic rays to suprisingly high levels.
I routinely measure rates between 4-5mR/hr on such flights, which means a highish dose for the aircrews over years.

To put some perspective on this, the radiation levels at FL30-35 are now so high, they are many times above the levels in much of the Chernobyl exclusion zone.
There are also areas of Europe which have particularly high BACKGROUND radiation levels due to the large presence of uranium and thorium in the ground or in Granite rocks.
Estonia is one of the most radioactive countries in Europe, as are parts of Cornwall & Brittany.

One of the most suprising things I discovered recently was leaving Warsaw airport.
The concrete of the runway had clearly and obviously been made using large amounts of coal based fly ash. A lot of coal fly ash particularly form Eastern Europe and China can have significant amounts of uranium in it.
Also in France for many years Areva sold the uranium mining tailings as simple ballast for building roads, with the result lots of minor roads in certain areas of France are really quite radioactive.
At WAW it was fairly astonishing to see the gamma-beta level on the ground many times normal background then see it DROP, the moment we took off.

As usual with most of this stuff “ignorance is bliss!”

bonbon
Reply to  pigs_in_space
June 23, 2019 4:04 am

I heard the ISS astronauts got a bad surprise not long ago when it was found that GCR’s were causing neutron showers from aluminum hull impacts. As far as I know they were issued bubble detectors.
Just wondering if this is going on in commercial aircraft and also not measured? Thermal neutrons are bad for bones.
Are you measuring neutron spallation ?

I was recently at a DLR expo where their new aerosol and pollution monitor aircraft was shown off. I asked whether among the hundreds of detectors aboard were any for radiation. Answer was No. Privately admitted they were requested by refused by their committee.

Reply to  pigs_in_space
June 23, 2019 6:20 am

@pigs that are flying

most interesting comment.
as I said, I believe that the continued lower solar polar magnetic field strengths allow for relatively more of the most energetic particles being released compared to when the sun has higher polar magnetic field strengths. I don’t really think the cosmic rays other than those coming from the sun are important at all.
Hence, my belief that the exposure level of flight personnel during the night will be lower.
Could you perhaps do a test to either prove or disprove this theory?
IOW measure highest exposure during a night time flight and compare this with exposure during same day time flight?

I am sure we will all very much appreciate your results – I am sure Charles will publish them here.

ren
Reply to  pigs_in_space
June 23, 2019 6:54 am

The further to the north the higher the galactic radiation. During class X solar flares there is a rapid increase in gamma radiation at the stratosphere boundary.

June 23, 2019 6:25 am

@pigs that are flying

most interesting comment.
as I said, I believe that the continued lower solar polar magnetic field strengths allow for relatively more of the most energetic particles being released compared to when the sun has higher polar magnetic field strengths. I don’t really think the cosmic rays other than those coming from the sun are important at all.
Hence, my belief that the exposure level of flight personnel during the night will be lower.
Could you perhaps do a test to either prove or disprove this theory?
IOW measure highest exposure during a night time flight and compare this with exposure during same day time flight?

I am sure we will all very much appreciate your results – I am sure Charles will publish them here.

June 23, 2019 6:53 am

“Imagine if the purported ‘Greenhouse gas’ property could be measured. We could have sensors at ground level…”

And the TV weather forecasts would include the CO2 count for the day:

“CO2 in the tri-cities will be over 425 parts per million over the weekend. Temperatures will increase by 0.137 degrees Fareinheit. Instead of the previously predicted high of 87, get ready for a blistering 87.137 degrees both Saturday and Sunday.”

Ever hear that? Or anything like it? Any report of CO2 levels on the weather report?

No.

Goldenrod pollen counts in PPM, yes. Humidity, yes. Minutes of sunshine, yes.

Barometric pressure, yes.

Many, many, many measurements that effect our weather are reported every day. Never is CO2 reported.

Over and over and over the CO2 cult chants: Basic physics! Arrhenius!

What’s going on?

June 23, 2019 6:57 am

sorry for the double postings

lately, there seems to be an extraordinary big delay in posting the comment and the actual publication.
That leaves me sometimes under the impression that something went wrong with the posting of the first comment?

[like I also asked many years ago: where do e-mails go that never arrive at the person you wanted to reach?}

pigs_in_space
June 23, 2019 7:37 am

“continued lower solar polar magnetic field strengths allow for relatively more of the most energetic particles being released”
NO!
It simply doesn’t work like that at all.

The solar wind (mostly high velocity protons) scatters the cosmic ray flux, causing it to decrease.
(It’s all about particle velocity, energy and density).
There are large energy differences of Mev to GeV here.
It’s true, the slight lowering in earth’s magnetic field has changed the CM/spallation to secondary particles, but it’s not the only thing that matters.

In an a/c the staff and passengers are largely unprotected, because thin aluminium is a largely useless beta/gamma shield at those kind of energies.
I was suprised to see, the largest particle fluxes were not seen out of the windows, but down the main aisles of the A/C.
If you need further proof of CR decreases, watch the forbush decrease as a CME hits the earth’s outer ionisised layers.

The CME has such high particle flux that it sweeps the cosmic ray flux out of the way and the decrease is very noticeable in high altitudes (particularly at the kind of altitude Concorde used to fly at), – around FL50 where the frictional losses are a lot lower at several MACH numbers.
If you like to know, Concorde was the ONLY commercial airliner that had continous monitoring onboard for neutron and gamma flux. Another reason it should still be flying and racking up profits for BA.

Please distinguish between proton flux from the sun propelled over the solar wind and CR flux from deep space (such as supernovae & X ray sources from Black holes etc)
They are totally different things.

Reply to  pigs_in_space
June 23, 2019 10:39 am

yes, but I disagree with you?
you have to bring me the data to show me the difference between day time and night time exposure?
I think what we get from super nova and black holes etc is nothing compared to what we get from the sun, on its own.
Why do we not yet have nuclear fission on earth to make energy (H to He)? Is it not precisely because we cannot build a magnetic field strong enough to contain the energy?

June 23, 2019 11:07 am

yes, but I disagree with you?
you have to bring me the data to show me the difference between day time and night time exposure?
I think what we get from super nova and black holes etc is nothing compared to what we get from the sun, on its own.
Why do we not yet have nuclear fission on earth to make energy (H to He)? Is it not precisely because we cannot build a magnetic field strong enough to contain the energy?

pigs_in_space
June 23, 2019 1:05 pm

Sorry this is complete nonsense.
Don’t you know the difference in energy spectrum between protons and gamma rays?

The energy from CR are many millions of times higher than anything that comes from the solar wind,- so high they have no problem penetrating into the ground.

The proton stream from the solar wind stops high up in the boundary between the earth’s atmosphere and space, which is why it manifests itself as AURORA, -after which all it can cause is some magnetic perturbations in the ground currents which we can detect more easily.

The fact is, the energies of CR are so high there is some scattering/spallation of secondary particles caused by collision of these with atmospheric molecules while the others carry on in their own sweet way.
We have difficulty detecting these, as we do measuring energetic neutrons because they are not charged by definition, and fundamentally random.

The solar wind can only diminish CR flux when it reaches a certain velocity by having such a large solar particle stream that it scatters the incoming CR flux by sheer volume and density, so the CR signal is temporarily overwhelmed.

As for daytime and night-time A/c radiation levels I didn’t see any difference.
That’s hardly suprising because they are sourced from particles from outer space, nothing to do with the sun.

Bindidon
Reply to  pigs_in_space
June 23, 2019 2:15 pm

Cochons dans l’espace

Thanks for this intelligent and intelligible comment.
J.-P. D.

pigs_in_space
June 23, 2019 11:21 pm

At ground level we are measuring all kinds of radiation as background.
Some places have high background (eg. the chiltern hills 30miles west of London), whereas some, eg, London, Paris, Moscow built on a mixture of mud and sediments usually have low background.

I have no idea what is left over from places like the Kyshtym nuclear disaster,and when Mayak make a massive release of Ruthenium 106, they still go into denial like in 1986. (Nov 2017).

With the current mix of backgrounds, (well worth the visit to Criirad in France), there is an almighty confusion of stuff considered normal (but actually very high, eg. in my hotel in La Roche s Y, which had a huge wall built of nicely active granite)…some farmers in central France that built their cattle sheds on “remblais” using “steriles” from Uranium mines (yes it’s past belief but true, making the farm unsaleable!), a factory in Estonia making radioactive bricks & roof tiles for 40yrs from local active ordovician clay,measuring between 10x>50x normal bg. high Radon levels in apartments built in France believe it or not on a filled in uranium mine quarry (Crazy eh!)..the remains of Chernobyl’s caesium 40 (a nasty gamma emmitter) now in first half life, to be found right up as far up as the St Bernard pass…or in patches all over Corsica, Alsace, Cumbria, Finland, Estonia., Russia, Belorussia and Sweden…the Baltic sea which is by far the most radioactive in the world….(thanks to an extremely low rate of seawater renewal).

Some of it ends in the food chain through Fish, deer and wild boar meat..who eat the mushrooms that bring it to the surface…and of course everyone now has a bit of Plut in them thanks to the insane bomb testing rituals that the USSR and USA served up to us from the late 40s to the mid 60s, with a little bit of the Brits, the Frogs, Chinese, Indians, Israelis and Pakis thrown in for good measure.

If you have a geiger-muller counter, it’s fascinating to see just what places are ‘hot” “warm” or low, then we also detect the CR flux which varies with CMEs and Coronal hole high speed solar wind.
The Warsaw airport radioactive runway was just a bonus!

bonbon
Reply to  pigs_in_space
June 24, 2019 5:22 am

The time has come the Walrus said,
to speak of many things –
Of cabbages and Kings,
why the sea is boiling hot, and
Whether pigs have wings.

Joking aside, notably no mention of the Sellafield/Winscale nuclear disaster in 1957?
Geiger-Mueller don’t do neutrons. You mentioned Concorde did monitor neutrons above.
Is it worth checking this for commercial aircraft altitudes?

Javier