James A. Schrumpf
If there’s one belief in climate science that probably does have a 97% — or more — consensus, it’s that the raw temperature data needs meaning, least-squaring, weighting, gridding, and who know what else, before it can be used to make a proper data set or anomaly record. I’ve been told several times that without some adjustments or balancing, my calculations will be badly skewed by the imbalance of stations.
So the null hypothesis of temperature data all along has been, “Just how bad/far off /wrong are the calculations one gets by using raw, unadjusted data?”
NOAA provides access to unadjusted monthly summaries of over 100,00 stations from all over the world, so that seems a good place to begin the investigation. My plan: find anomaly charts from accredited sources, and attempt to duplicate them using this pristine data source. My method very simple. Find stations that have at least 345 of the 360 records needed for a 30-year baseline. Filter those to get stations with at least 26 of the 30 records needed for each month. Finally, keep only those stations that have all 12 months of the year. That’s a more strict filtering than BEST uses, as they allow fully 25% of the 360 total records to be missing. I didn’t see where they looked at any of the other criteria that I used.
Let’s see what I ended up with.
Browsing through the Berkeley Earth site, I ran across this chart, and decided to give it a go.

I ran my queries on the database, used Excel to graph the results, and this was my version.

BEST has more data than I, so I can’t go back as far as they did. But when I superimposed my version over the same timeline on their chart, I thought it was a pretty close match. Mine is the green lines. You can see the blue lines peeking from behind here and there.

Encouraged, I tried again with the contiguous 48 US states. Berkeley’s version:

My version, superimposed:

That’s a bit of a train wreck. My version seems to be running about 2 degrees warmer. Why? Luckily, this graphic has the data set included. Here is BESTs average baseline temps for the period:
% Estimated Jan 1951-Dec 1980 monthly absolute temperature (C): %
Jan Feb Mar Apr May Jun Jul Aug Sep Oct Nov Dec
% -4.07 -1.75 2.17 8.06 13.90 18.77 21.50 20.50 16.27 9.74 2.79 -2.36
% +/- 0.10 0.09 0.09 0.09 0.09 0.09 0.10 0.09 0.09 0.09 0.09 0.09
Here are mine:
JAN FEB MAR APR MAY JUN JUL AUG SEP OCT NOV DEC
-1.26 1.02 5.2 11.13 16.22 20.75 23.39 22.58 18.68 12.9 6.09 .98
.03 .03 .02 .02 .02 .02 .01 .01 .02 .02 .02.02
It’s obvious by glancing at the figures that mine are around two or so degrees warmer. I guess it’s due to the adjustments made by BEST, because NOAA says these are unadjusted data. Still, it’s also obvious that the line on the chart matches up pretty well again. This time, the data set for the BEST version is provided, so I compared the anomalies rather than the absolute temperatures.
The result was interesting. The graphs were very similar, but there was offset again. I created a gif animation to show the “adjustments” needed to bring them into line. The red line is BEST, the black is mine.

At the moment, the GISS global anomaly is up around 1.2, while BEST’s is at 0.8. The simple averaging and subtracting method I used comes closer than another, highly complex algorithm that uses the same data.
My final comparison was of the results for Australia. As with the US, the curve matched pretty well, but there was offset.

The same as with the US comparison, the BEST version had a steeper trend, showing more warming than did the NOAA unadjusted data. For this experiment, I generated a histogram of the differences between the BEST result for each month and the simple method.

The standard deviation was 0.39, and the vertical lines mark the 1st and 2nd standard deviations. Fully 77.9% of the error fell within one standard deviation of the BEST data.and 98.0% within 2.
What does this mean in the grand scope of climate science, I don’t know. I’m certainly no statistician, but this is an experiment I thought worth doing, just because I’ve never seen it done. I’ve read many times that results of calculations not using weighting and gridding and homogenization would produce incorrect results — but if the answer is not known in advance, like how the “heads” result of a million coin tosses will come very close to 1 in 2 is known, then how can it be said that this simple method is wrong, if it produces results so close to those from to more complex methods that adjust the raw data?
We’ve seen this over and over where the official records have cooled the past, and heated the present. This is not a surprise to skeptics who have been following the data sets.
This is prima facie evidence that the adjusters havent actually adjusted each station based on quality considerations. It has undertaken a gross adjustment of the intact series. It’s as if a thumb tack was used at the pivot point to rotate the curve counterclockwise. The closer you are to the thumb tack, the lesser the adjustment and there is a smooth transition from positive adjustments to the right of the pivot to negative adjustments to the left.
This shouts BS to the quality control argument. Ask yourself, why would the “little bridge” between 1965 and 1980 be perfect without adjustment needed but the earlier be shifted down and the later jerked up!! In a court of law this would be indictable on the evidence.
Whenever I’ve queried some apparent flaw, Nick Stokes or some other is quick to say, yeah, but there was a station move! It kills you in your tracks. But hear that enough and couple it with climate revelations of willful altering that they discussed openly, even corrupting history to support an agenda or such things as Santers rewrite of the IPCC uncertainties into certainties or the Karlization of the Pause, and it dawns you that station moves would be a good way to stop some decline in temperatures. It is likely one of the tools in their fudging toolbox. Why didnt they move bad stations away from A/C exhaust an asphalt parking lots if they were so concerned about quality control.
The past is always cooled, the present is always warmed – statistical chicanery in the service of maximum FEAR, how surprising….
An important new report has just come out that explains these types of reconstructions are hopeless until we address issues of how the temperatures are measured: https://eprints.utas.edu.au/29788/1/JDVlok_Eprints_20190429.pdf
It is by a really clever guy called Jaco Vlok, soon to be out of a job.
In Australia, the change over to automatic weather stations (AWS) combined with no averaging of the one second readings makes for more warming for the same weather. To be clear, the Bureau is not taking spot one second readings and the highest for any one day is recorded as TMax. Also, they have an increasing number of these at airports within reach of the exhausts from large boeing jets.
I’ve written lots on this, something recent that perhaps has relevant links: https://jennifermarohasy.com/2019/04/new-drought-report-consistently/
Someday perhaps some climate scientist will write a paper that explains why thermometers always showed too high temperatures before 1960 and too low after.
Of course I’m just joking.
James A. Schrumpf
“My method (is?) very simple. ”
Great post…
I think that the KISS method is the correct one. Whenever I see the
words, “”A Anagram was used”” my BS detector lights up.
A very interesting article, thank you.
MJE VK5ELL
Goldilocks adjustments..
The data before 1960 was just too warm
The data after 1980 was just too cold
The data from 1960-1980 was jusssst right
GISSTEMP changes to their Land Ocean Temperature Index (LOTI) since 2002:
https://postimg.cc/YvkVJR1G
Here’s how GISSTEMP’s LOTI adjustments have altered the slope since 1997:
https://postimg.cc/D8kZw3yN
GISSTEMP has probably made nearly 100,000 changes to their LOTI report over the last two decades.
That these changes have been made cannot be disputed. Why they have been made is a matter of opinion.
I produced this a 5 years ago to point out why there was a pause. Better than fitting straight lines and then arguing about choice of end points.
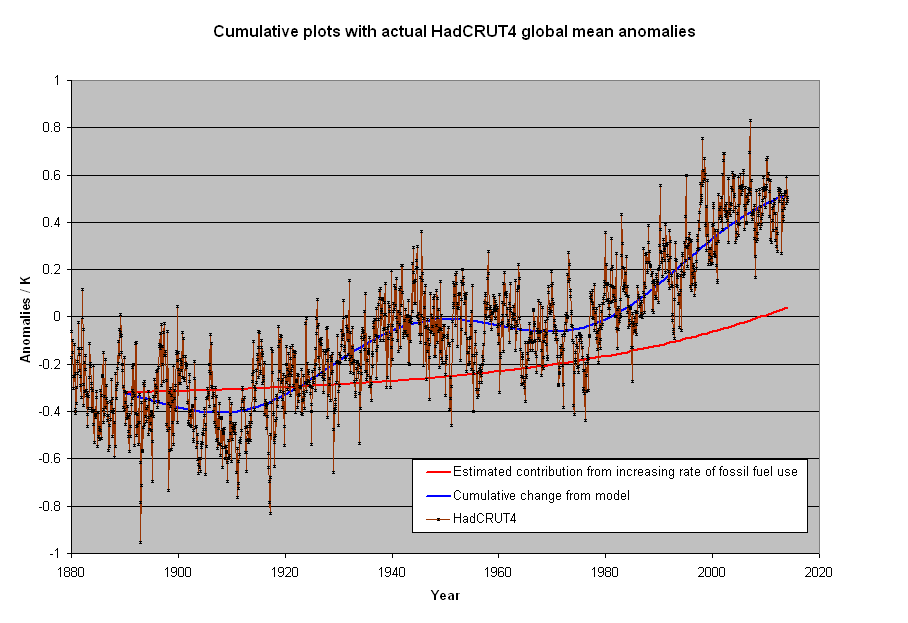
The component consistent with an exponential increase due to increasing human emissions is 1/3 of the hole degree of warming. The rest is an assumed constant rate of warming since the LIA and an oscillation with a 60 year period. Such an opinion shouldn’t make you a heretic of AGW, or even CAGW, but the pause made even this smaller contribution dubious. When human emissions should have been the most noticeable is where the plot strays from fit the most. Relevant to the post because it shows that only small changes are required to make a stronger case for human rather natural reasons for changes that have occurred.
Mods I had a perfectly fine, apropos ad hominem free comment that initially was up and now taken down. Is there an explanation? I know there were changes made but to me it seems almost arbitrary sometimes. For me, some of these are a lot of work.
The thing to understand is not whether there are adjustments but why. Logic tells me that over the last 100 years older raw temperatures should be raised and / or later temperatures lowered to take account of the urban heat island effect, yet adjustments almost always go the other way. The lack of verifiable and logical reasons for the adjustments confirms that whether it’s deliberate or just caused by confirmation bias the data provided is misleading . The crazy thing is if we can’t trust scientists in relation to historical data how can we expect any accuracy in their future predictions.
Part of the challenge is there are so many stations to validate. It seems that researchers all try to apply algorithms or other mass review methods to filter through them, when in fact they each need an individual evaluation.
I would rather see wider error bands due to having fewer stations, and only use pristine data. When adjusting data, the error bands are mathematically unknowable. How do researchers expand confidence limits based on possible adjustment error?
Again, when the range is a degree or two, I just don’t see how we can take anomalies in temperature data seriously.
Suppose a temperature-measuring station consisted of a larger area, where, say 12 different thermometers were distributed throughout the area. I wonder what sort of agreement there would be between the 12 thermometers just for one day, for one station. Would all the readings agree within one degree? Two? A fraction of a degree? [I don’t know]
All the focus, all the calculations, all the discussion around a degree or two still seems bizarre to me.
My take on this is they tell us the adjustments are for data quality issues and give the idea that changes are applied to individual station data – some made warmer, some cooler. If this was the actual case, the result wouldnt look like they stuck a thumb tack in between 1965 and 1980 and rotated the graph counter clockwise about 5 degrees angularly, making it steeper.
How could it be coincidence that no adjustment was necessary on the stretch between 1965 and 1980, but increasing amounts are subtracted from the readings going back to the 19th Century and increasing amounts added coming up to the present. This can only be done by adjusting the trace of the record as a whole (ie, the thumbtack method on the raw data) rather than quality control on the readings themselves. Moreover, it means the entire record at each station individually were “thumb tacked”, i.e. a bad reading was made by an observer in Capetown on the same date as one was being made in Paraguay, Ecuador, Nuuk and Malmo. WUWT?
Average is an abused measure of centrality. They have to process the data in order to get rid of the obvious sampling biases. The more you process, the more difficult it is to interpret and the more likely that human confirmation biases will be introduced to make the data ‘right.’
Finding the ‘average’ is simply trying to put a square peg in a round hole. But it does lead to a lot of papers discussing “proper” treatment and give enough wiggle room to get the numbers “right.”
Ordering-based statistics like the median (as opposed to sum-based stats like the mean) make more sense to me with this type of data .
“I’ve read many times that results of calculations not using weighting and gridding and homogenization would produce incorrect results”
They don’t (or shouldn’t) say that it would produce incorrect results, rather that it could. If you have a biased sample, it only causes trouble if there is a complementary trend in the data. The unweighted dataset will lean heavily to results for ConUS, for example. If ConUS behaves differently to global, this is a problem; if not, not.
I did a recent post here which compared various proper methods with just unweighted averaging. The latter was not particularly biased, but just all over the place. I had to graph it in pale yellow so the proper results would show through. The interest there was that if you take out the main variation that clashes with the sample bias, by subtracting a fit of spherical harmonics which have known (zero) integral, then the unweighted performs quite well.
A major practical problem with sampling without area weighting is that the result depends a lot on what turns up in the sample. It happens that GHCN V4 include a lot of ConUS stations. Someone might compile a set with a different emphasis and get a different result. Proper weighting counters such discrepancies.
Hi Nick,
The way I view it, the important point is “What are you trying to show?” It seems to me that you believe an average global temperature, or anomaly, can be produced from this data if you weight it, interpolate it, grid it, and subtract from it a fit of spherical harmonics with known integral.
But here’s the thing: you can’t prove you have the “right” answer. My calculated average global anomaly was closer to BEST’s than was NASAs’. Does that mean I’m “more right” than NASA? Or is NASA correct, and BEST and I are way off?
There’s really no way to tell. When sampling a population, a standard error is just a statement of how close your new calculated mean would be to the original mean if you ran the entire experiment over with all new measurements. It tells you nothing about the “correct” mean.
My calculations, on the other hand, are a true representation of the mean of the stations I’ve decided to include in my sample. In my universe, this was the average anomaly for March. UHI doesn’t matter; the city isn’t going to disappear any time soon, so its contribution will be the same every month. My simple calculations will show what’s happening with each station, if I so desire, or for an entire continent.
The bottom line is that with only simple calculations, my anomalies for three different regions of the earth had a standard deviation within ±0.4°C of a “proper” method, and there’s no way to prove which method gave the “right” answer for the Earth.
However, I can show that my methods give the right answer for the stations.
I’ve mentioned before of tremendous temperature difference just a few miles apart.
For example, where I work in Mt Vernon, WA, in high summer it may get to 90. By the time I get home, 13 miles straight-line distance, it’s usually 10-20 degrees cooler. The highest disparity I’ve seen was 27f. Which is why infilling and averaging readings from different stations is bad, very bad.
“then how can it be said that this simple method is wrong, if it produces results so close to those from to more complex methods that adjust the raw data?”
By testing it James. Thoroughly and completely.
To test it you use the SAME data!.
To do a proper test you change ONE variable.
You are testing a METHOD.. call it method B
To test it against method A, method C, Method D.
you use ONE data set with the three diferent methods.
Here is one example how to do it
http://static.berkeleyearth.org/memos/robert-rohde-memo.pdf
Simple averaging will always perform WORSE when the following occur
A) there is a change in average latitude over time
B) there is a change in aveverage altitude over time.
The other way to test your method is to randomly remove data from your series
and see if the answer changes.
take your European dataset.
Now remove 10%, 20%, 30%, 40% 50% ect.
See if your curve changes.
if it does, then you know your method is not robust
simple averaging is not robust
What this mean?
Excel is the sign of amatuer at work.
“if the answer is not known in advance, ”
But we do know the answer. We’re doomed. So we just have to make sure that the data supports that.
” if the answer is not known in advance,”
But we do know the answer. We’re doomed. So we just have to make sure the data supports that.
James, nice work.
Since you have the numbers try this.
Instead of correlating station ids correlate on lat/lon rounded to 2 decimals. The few times you get overlaps take the average.
Include both v3 and v4 in this process.
Now map the different versions inventory to those same lat/lon readings. Compare!
What do you see?
Thanks, James. Interesting to note that part of your work replicates some of that produced by Heller and presented on a youtube here.
https://www.youtube.com/watch?v=6kUAtt2pXlc&feature=youtu.be
(Hopefully WordPress will not truncate the address, or search youtube for Heller Corruption Of The US Temperature Record.)
Heller has done a lot a good work in this field, I realise that some scholars of maths and statistics might not like his presentational methods, but this is a war of minds and sometimes simple (but correct, of course) is best. Do not be overly discouraged by those critiques yourself.
The fundamental point is this:
You are trying to find evidence of a change in the heat input/output balance in the system comprising the sun/atmosphere/rocky planet.
To do so by measuring the air temperature near the surface daily, taking the max/min and dividing by two isn’t really anything like what is needed considering basic physics.
It’s not fit for purpose.
It’s no good arguing that that is all you have got. I’m well aware of that. Arguing doesn’t make it any more fit for purpose, in fact it makes it worse because you are likely to delude yourself.
Try considering what you would ideally like to measure and how, in detail you would do it if , as a thought experiment, you had another rocky planet with an atmosphere and you wanted to monitor the heat input/output over, say, 200 years with current technology.
Where would be the best place to put your temperature probes, how often would you take readings, etc.
Once you have that sorted and agreed then you could start such monitoring here on Earth, let it run and compare with the traditional crock of shite method currently in use.
I’ll wager the results would be quite illuminating.
I’ll stick my neck out and assert they won’t be telling you the same about heat input/output balance.
What you have with the CARW “debate” on here as well as pretty well everyhere else is arguments about the relative merits of the architecural design of the upper stories of the castle. I’m standing a little further away than most of you and all I see is the whole edifice built upon dodgy foundations wabbling from left to right as the wind blows in different directions. The group over here by me is tiny and NEITHER side near the edifice like arguing or talking with us.
Trouble is BOTH camps are going to get squashed when it all comes down and who do you think will have to pick up the pieces. Well I’m getting bored with that. It’s gone on tooooooooo long.
I’m getting my RPG out soon.
You have been warned.
Step away.
Or risk getting squashed.
If you are not sure you are welcome to come over here and look at it from afar, free tea and biscuit and a nice chat too.
You can even handle my RPG before you decide whether to defect or not!