
In a recent USA Today story “Hottest summer ever? US breaks longstanding record,” the writer claims that the United States just experienced its hottest summer ever based on the National Oceanic and Atmospheric Administration’s (NOAA) latest temperature analysis. That claim is misleading, based on an incomplete causal analysis. The best available evidence suggests that much of the reported “record” depends on adjusted temperature datasets and weather stations increasingly affected by urban development, while the nation’s highest-quality climate network tells a very different story.
USA Today accurately repeated NOAA’s announcement that the average temperature for June through August 2026 was the warmest in the 132-year record for the contiguous United States, edging out 1936 and 2021 by just 0.4°F.
That sounds straightforward enough, but unfortunately, it isn’t.
The first problem is terminology. USA Today repeatedly calls this the “hottest summer ever.” NOAA itself does not. NOAA consistently describes 2026 as the “warmest summer on record” based on average temperatures. The word “hottest” never appears in NOAA’s announcement. That distinction matters because “warmest average” and “hottest” are not the same thing.
Meteorologist Chris Martz carefully examined NOAA’s data and found that the reported record was driven largely by higher than normal overnight minimum temperatures rather than record daytime highs. Using average daytime maximum temperatures, 2026 ranks behind several earlier summers, including the legendary Dust Bowl summer of 1936.
That fact is hardly a trivial. Most Americans experience summer heat primarily during the daytime, not as an average of daytime highs and nighttime lows. Martz also points out something almost entirely absent from the media coverage. Although the national average narrowly set a record, very few parts of the country actually experienced their hottest summer.
Using NOAA’s own data, he found that only seven of 344 climate districts, barely two percent, recorded their warmest summer on record in 2026. Those districts were concentrated almost entirely in the Desert Southwest, see in Figure 1 below. By contrast, during the infamous summer of 1936, fifty-one climate districts set all-time summer records.

That paints a much different picture than headlines suggesting the entire nation experienced unprecedented heat, when it did not.
Then there is an even larger issue that deserves far more attention.
NOAA’s long-term temperature record is not based solely on raw observations. It relies on a “homogenized” dataset in which station records are adjusted to account for changes in observation times, instrumentation, station moves, and other factors. NOAA openly acknowledges using these adjusted datasets for its national rankings.
Whether those adjustments perfectly capture reality is a legitimate scientific question; Martz argues they may not.
He notes that some adjustments are larger than the tiny 0.4°F margin separating 2026 from 1936, raising reasonable questions about whether the new record is as certain as headlines suggest. He also discusses concerns that NOAA’s pairwise homogenization algorithm may not adequately remove gradual urban heat island effects and could unintentionally blend urban warming into nearby rural stations. Whether one ultimately agrees with every aspect of that critique, these are serious methodological issues worthy of discussion, but the USA Today never opens that discussion.
There is another dataset that deserves attention.
The United States Climate Reference Network, or USCRN, is widely regarded as America’s gold standard surface temperature network. Unlike many older Cooperative Observer stations, USCRN sites were specifically designed to avoid contamination from expanding cities, parking lots, buildings, and other artificial heat sources.
The USCRN Figure 2 graph below tells an interesting story.

The USCRN network data shows one extraordinary warm month during March 2026, with a national temperature anomaly reaching nearly 7.7°F above average. But June, July, and August do not stand out nearly as dramatically. Instead, they fall within the normal range of variability seen across the roughly twenty-year USCRN record.
If America truly experienced an unprecedented hot summer across its highest-quality climate observing network, one might expect the USCRN record to show an equally extraordinary signal. It doesn’t, and that discrepancy deserves investigation, not dismissal.
One plausible explanation is the urban heat island effect (UHI).
Many of NOAA’s legacy stations are located at airports or sites that have experienced decades of surrounding development. Asphalt, concrete, buildings, jet traffic, air conditioning exhaust, and expanding urbanization all contribute to elevated nighttime temperatures. Those are precisely the temperatures that drove much of NOAA’s reported national record. A perfect example of such a situation is the weather station is Reno, NV where an investigation revealed large warm biases in official temperature measurements. A similar problem has been identified by Roy Spencer, Ph.D. with temperatures recorded in and reported for Phoenix.
That possibility becomes even more significant in light of extensive station surveys documenting widespread siting problems throughout the U.S. Historical Climatology Network. The issue is not whether cities are warmer. Everyone agrees they are.
Then there is the problem of “ghost stations,” with NOAA reporting temperature data from stations that no longer exist. NOAA simply makes up temperature measurements for a huge number of closed stations based on averaging from surrounding stations, to maintain record continuity – but made up or assumed temperatures are not actual data.
The issue is whether artificial heat island biases are being fully removed and assumed “data” from ghost stations not counted, before national climate conclusions are announced. Reasonable scientists can debate that question, journalists should at least acknowledge it, but they don’t
Instead, USA Today presented NOAA’s adjusted temperature ranking as settled fact while ignoring both the methodological caveats and the existence of higher-quality observational data that display no record setting warmth. The result is another headline that generates maximum attention while minimizing scientific complexity and compromising accuracy.
Good climate journalism should do the opposite. It should explain uncertainty, distinguish between adjusted datasets and pristine observations, and recognize that a record based on a few tenths of a degree deserves careful examination rather than unquestioning repetition.

Anthony Watts is a senior fellow for environment and climate at The Heartland Institute. Watts has been in the weather business both in front of, and behind the camera as an on-air television meteorologist since 1978, and currently does daily radio forecasts. He has created weather graphics presentation systems for television, specialized weather instrumentation, as well as co-authored peer-reviewed papers on climate issues. He operates the most viewed website in the world on climate, the award-winning website wattsupwiththat.com.
Originally posted at ClimateREALISM
UAH data GMST = 0.017 C/y
So basically adjusted to 1.7°C per century
> NOAA’s long-term temperature record is not based solely on raw observations. It relies on a “homogenized” dataset in which station records are adjusted to account for changes in observation times, instrumentation, station moves, and other factors. NOAA openly acknowledges using these adjusted datasets for its national rankings.
An homogenized dataset in not data. It is an enproduct is not good for any further analysis.
It would be good follow up to the surface stations project to obtain the adjustments to the raw data used in this process. I understand that the measured temperatures in downtown Los Angeles are routinely adjusted 10-12°F to account for UHI.
Yes, it seems that temperature “constructs” are all that are ever used for climate indicators.
Temperature readings from all different devices, at all different places, at all different times being ‘averaged’ are not a particularly reliable basis for reaching “settled” scientific conclusions.
The probity of such metrics is appalling.
Moreso when indicators such as ‘temperature’ are not particularly appropriate as climatic behaviors in the first place.
Personally I judge how hot a particular Summer is by my Electricity Bill. Last summer, and the summer prior (and the one before that even) my August Utility Bill was $750+ (close to $800) while this last one was $618. That makes this Summer relatively cool compared to at least the last 3.
Good comment, Bryan A. Here’s another observation: 1936 was a “Dust Bowl” year, when a combination of higher temperatures and drought produced dust storms in the US southwest. Show me the dust storms this summer?
For multiple reasons it is difficult to make comparisons of 1930s weather and situations with now, approaching a century later. An award winning book tells the sad story of the “dust bowl” years.
by Timothy Egan:
The Worst Hard Time: The Untold Story of Those Who Survived the Great American Dust Bowl
I tend to judge the “hottness” of a Summer by the yield of my tomato crop. Taking into account the number of plants grown of course. The last good year for tomatoes where I am (South East of Australia) was 2019, with subsequent years being generally poor. This year may be shaping up to be a better one, time will tell though. Last year was terrible, with barely enough tomatoes for table use and definitely nothing worth preserving, better years (with the same number of plants) yield enough excess for several dozen jars of preserved tomatoes, passata, etc. as well as as many fresh tomatoes as you could eat. Fingers crossed for a good year this year, I’m looking forward to some nice home grown tomatoes to eat.
“Ignores the Most Important Temperature Record”
That record presumably being USCRN. But what this article ignores (again) is that USCRN and the NOAA ClimDiv produce virtually identical results. Here is the comparison for summer temperatures. USCRN is just a little higher, and also shows the most recent summer to be the warmest in its record.
Now I know that when this has been pointed out previously, there is some lame story about a giant conspiracy to realignthe ClimDiv (with thousands of stations reporting) to USCRN. But whatever, it is pointless to say that NOAA is ignoring USCRN when they are the source of that dataset, and it confirms the Climdiv result.
The high anomaly in March is a distraction. The NOAA claim is warmest summer.
Came here to say the same thing Nick.
Looking at maxes, they were higher at the pristine USCRN stations vs ClimDiv for all summer months and minima were virtually identical.
Also USCRN summer months since 2014 have been higher than ClimDiv.
and my tomatoes were ripe to pick 4 days earlier this year than they were last year.
My tommies time of ripeness is as good an indicator of yearly seasonal conditions than incessantly-averaged, questionably-sited thermometers readings from disparate climatic localities.
The probity of such “evidence” from dodgy thermometers ‘averaged’ readings is appalling.
(For the illiterate –
“probity” –
integrity, honesty, uprightness, trustworthy
From Latin probitas, from probus ‘good’ )
I rebuilt my firepit in the spring. Hottest year evah.
Don’t know why we don’t just ditch thermometers globally and go by tomato ripeness at a single location.
We agree, thermometer location is important. In 20years, my town grew from 5k to 25k people with lots of new asphalt and concrete.
Yep.
For all the good they do, we may as well stick them up our arse.
(if I have to explain . . . )
Reminds me of an old joke…
Beats determining the global climate from a single tree’s growth rings…
That’s a great idea! We could call it the Köppen-Geiger Climate Classification.
The map in the post shows above average for my area. That was definitely not true. It’s been a very mild summer here on Whidbey Island. All this averaging nonsense give people false information.
Well, I’ll have to think about that one Nick, because, after all, you are an Expert on the theme of Distraction.
Not just that 🙂
Ambition, distraction, uglification and derision.
This isn’t what Anthony showed. You’ve provided two data points for year. That’s a different measure. What was shown above by Anthony would lift the 1H26 figure, but does not amount to a summer average. Of course, you know this, right?
I can’t grok what you mean there but anyways ….
What Nick provided, and I seconded is the aggregate USCRN network mean summer months temperature in comparison to the same for the ClimDiv network.
I did this to show that there is no UHI effect that is not being compensated for (actually it seems it’s over-compensated for) in the ClimDiv data, as it averaged cooler than the USCRN stations (which are as good as you can get site/instrument/maintenance wise) for this last summer – and in fact the same is true for all summers since at least 2014.
In addition the average minima for the USCRN this summer were the same as for the supposed UHI infected ClimDiv data.
No, what NS provided is not ‘summer’ temps. Two data points are not granular enough to get ‘summer’. He’s likely showing Dec (some sort of unexplained avg) and Jun (ditto).
What you ‘seconded’ was his assertion because it aligned with your ex ante feelings, not because he provided something worth discussing
Why don’t you just go to the site linked to by the WUWT article, here, download the data for yourself onto a spreadsheet and average the June, July and August temperatures for each year?
You will get exactly the same chart Nick posted above.
Summer 2026 was the warmest on record for the US in both USCRN and in NOAA ClimDiv; but the ‘pristine’ USCRN data are warmer.
Yes it is. It’s just averaged for the summer months (JJA) per year.
It’s from the very site Watts linked to!
Ah averages. Statistics that can lie straight in bed. 😉
Are these averages based on fixed time of day readings or actual averages of warmest and coolest?
It’s odd that no one here has an issue with temperature averages until they show you what you don’t want to see.
Then suddenly they’re called into question.
You then have comprehension issues. But you didn’t answer the question. Was it A) or B) was true average warmer or was it due to TOD?
I’ll tell you what, I’ll do what you could do yourself but evidently can’t be bothered. I’ll ask a search engine.
Here’s my question: “are the USCRN temperature stations automated?”
Here’s the answer from Google AI, with references: “Yes, the U.S. Climate Reference Network (USCRN) temperature stations are fully automated. They are engineered for unattended, continuous operation in remote and pristine locations. [1, 2]”
So these are fully automated, 5 minute by 5minute observations averaged over 24-hours.
And they are still the warmest June July August in the USCRN record and USCRN was still warmer than ClimDiv this summer.
So how does that translate to TOD measurements, which aren’t designed to accurately record either T(max) or T(min)
Reanalysis and other higher temporal resolution products tells us that the (Tmin + Tmax) / 2 method is a good proxy for the integral[ T(t) dt, t:{a to b} ] / (b-a) method.
Ah, there you are, bdgwx. While cleaning up, I found a comment you made that I had failed to respond to earlier (in May – oops!), so I will respond now, here, because that thread is closed, and because I am the sort who believes that a man ought to be able to defend his words.
The comment you made was this one:
https://wattsupwiththat.com/2026/05/13/study-posits-how-carbon-dioxide-cools-the-upper-atmosphere-and-warms-earth-below/#comment-4195482
And in it, you claimed that I am “the guy who challenges the 1LOT and SB law”. You gave three references to support your claim.
Reference 1: no, it doesn’t support your claim in the least. Please show the exact quote where I somehow “challenges” the 1LOT or SB law.
Reference 2: also doesn’t. Ditto.
Reference 3: Likewise.
Nowhere in any of those threads did I say “I disagree with the 1LOT or SB law”, or anything like it. So either you are lying, or your reading comprehension is terrible. I suppose you could also simply be a troll, but I don’t believe so. Is there a fourth option?
You called the SB law a hallucination, challenged the fact that it predicts the radiant exitance of a body (W.m-2) given its temperature (K), and said that it cannot be used to determine the power a body emits. Along the way you also said that power (j/s) and energy (j) were not related via E = P*t.
“You called the SB law a hallucination”
No I didn’t. Liar.
Here someone posing as you straight up called the SB law a hallucination and not physics.
Here that same person backtracked a bit and said the SB law is a hallucination if you pretend there is no cold body in the equation. There is no cold body in the equation so…
So it sounds like you need to figure out who is masquerading as you on this site.
“Here someone posing as you straight up called the SB law a hallucination”
No he didn’t. Liar.
“backtracked a bit”
No he didn’t. Liar.
Be glad he didn’t haul out the “contrarian” invective he’s so fond of.
Lol…if you are one and the same then why are you using third person to refer to those posts?
“why are you using third person to refer to those posts?”
That was your idea, not mine, bonehead. I stuck with it in case it would help to make you feel better. It doesn’t look like that worked.
You’re not going to bother apologizing for your lies, are you? The third person perspective wasn’t the main problem with your comment.
Not only would I apologize for any lies, but I would also apologize for any mistakes.
Did you or did you author the posts I linked to?
And if you did author them I would even be happy to retract my criticism of your statements if you retract your statements claiming that the SB law is a hallucination, that it doesn’t predict a blackbody’s temperatures given its radiant exitance and vice versa, and that energy and power are not related via E = P * t. Is that something you’re will to do?
“Not only would I apologize for any lies,”
No you wouldn’t. You obviously lied, and you still haven’t apologized. So that’s another lie.
“Did you or did you author the posts I linked to?”
Of course I did. But the authorship isn’t the problem.
“your statements claiming that the SB law is a hallucination,”
I never said that. Liar.
Then it doesn’t sound like I have much to apologize for then does it?
Oh the irony…
“Then it doesn’t sound like I have much to apologize for”
How about your lies?
“Oh the irony…”
What irony? You’re still a liar.
That’s all you’ve got, bdgwx? You ran out of lies, and can’t defend anything you said, so you’re just going to inanely mumble “irony” and leave? Who taught you to behave like this? Was it your parents?
I should have allowed a fourth option above, when I was trying to decide what you were. I left out the option of illiterate liar.
You know WUWT is supposed to be a scientific blog, right? Perhaps you’d be more at home over at The
ConversationMonologue or perhaps “Skeptical” “Science”. They love people like you over there.Speaking of science, have you done that thermopile experiment I asked you to do yet? You know, the one that demonstrates that you have literally no clue how physics works? No? Not yet? Whyever not? Is it the $6 price tag? You know, I’d be happy to buy you a thermopile and mail it to you. Just let me know where I should send it.
I’ve been around here long enough to have seen the movement that showed Tmin was the largest reason for a rising Tavg. Climate science had nothing to do with showing this.
AG science had the first papers that showed Last Frost Days becoming earlier and First Frost Days being later. That makes for a longer growing season.
Climate science has yet to move on from (Tmax+Tmin)/2. Those are both different functional relationships and averages just tell you nothing about what is actually happening physically.
Give me a model that predicts land temperatures and consequent radiation over a 24 hour from a functional relationship that uses insolation. Show us a climate model that uses land surface temperatures to determine atmospheric temperatures. The same goes for GCM’s. Show us one that accurately predicts enthalpy increases around the globe for the next 100 years.
A good proxy that can’t relate to TOD measurement is useless. They were never T(Max) and T(Min)
Let me make sure I have this straight. Your argument is that because (Tmax+Tmin)/2 cannot tell you when the measurements were taken it therefore cannot be used to estimate the average temperature. Yes/No?
Here is a couple of graphs for you to peruse.
Tell us why in the first graph 1) the surface temp is always warmer than the air in day time and a little above the surface temp late at night. Use radiation to explain that.
The tell us why enthalpy is generally higher than surface temperature in the second graph.
No. TOD measurements cannot tell whether it was warmest or coolest for that day. Usually in my neck of the woods the coolest is about 6am, not 9am. Warmest often comes after 3pm. It doesn’t do T(Max) Or T(Min).
Your response has nothing to do with my statement or your initial challenge that (Tmin + Tmax) / 2 method is a good proxy for the integral[ T(t) dt, t:{a to b} ] / (b-a) method.
Your statement is lacking. Exactly what function are you integrating.
T(t) dt is not conclusive of anything. Air temperature does not follow a sine function so it must be a complex equation. To use a complex function you must also supply appropriate limits.
Here is a graph that is pretty representative of both surface temperature and atmospheric temperature.
And another from my weather station showing insolation and air temperature from midnight to midnight. Air temperature is not really a trig function. Sometime after insolation stops, air temperature assumes a decay function until sunrise arrives again. That makes a simple T(t) declaration very complicated.
Notice that he completely avoided even attempting an answer.
Climate science so badly wants to show insolation goes directly to the atmosphere. It is what their 33C GHG theory is based on.
Yet ocean/land mediates insolation and releases energy on a different scale of its own.
Insolation values and air temperature should never be discussed in the same breath
Are you insane? Everyone here has a problem with averaging an intensive value, let alone the fact that the standard deviation of the distribution of the average is never quoted. You are a troll.
You do know, don’t you Jim, that monthly temperature anomalies are themselves compiled from daily averages?
You do know that when subtracting the means of two random variables (monthly_average and baseline average), one must add in quadrature the variances of each in order to determine the combined standard deviation, right?
Tell us what you get for August 2026 anomaly for Tmax, Tmin, and Tavg.
BTW, I get a standard deviation of Tmax for the baseline 1990 – 220 of ±1.4°F. You can find the daily Tmax for the US in August yourself in order to calculate the standard deviation for the month.
Just using the baseline SD with a value of “1” for the monthly SD gives √(1.4² + 1²) = ±1.7°F. Or a value of 2.7 ±1.7°F for an interval of (1.0 to 4.4). That is a pretty large error bar.
Try it for June and July. And remember a 3 month smooth must also have an uncertainty.
You had to compute an average of those temperatures (an intensive property) to get the standard deviation.
The irony…
Yes, yes I did do that. Sometimes to deal with a pig, one must wrestle them in the mud. Had to do that often growing up.
The issue, which you obviously ignore and try to deflect from is that uncertainty is never dealt with by climate science. Why did you pointedly ignore this?
Ok, well, if you want to make a point about how meaningless and useless it is to average temperature then you probably shouldn’t make your argument dependent on the meaningfulness and usefulness of averaging temperature. I’m just saying.
It doesn’t mean that climate science when averaging aren’t making multiple mistakes. Ignoring variance or assuming it cancels is a mistake.
No one? Really? I’ve been railing against averaging temperature for a couple of decades.
Climate science needs to move on to enthalpy. Humidity is available in many of the databases along with temperature. CoPilot can write Python scripts to access temps and humidity in a data set and create an entry for enthalpy. It does it damn quick too.
Nick,
The chart shows temperatures apparently measured to +/-0.01° F. That can’t be right. What are temperature data used for calculating the anomalies and to what accuracy were temperatures measured? Except for the last data point there has been little change in annual temperature, I don’t too excited by an anomaly of even 2° F.
This is so tired and mechanical. AW’s post has a similar plot of USCRN temperatures to the same precision. Take it up with him.
No, that is an average of thousands (ClimDiv) or over 100 (USCRN) stations, not a measured temperature.
So you’ve come up with another excuse for showing averages. If that is not a measured temperature, then don’t pretend that it is a measure. You can fix that by not showing a °C or °F. You should also show the standard deviation for each data point since it is an average of a distribution after all.
You don’t like averages, even though they are used by every single temperature producer, because you don’t like what they demonstrate.
That’s what it boils down to.
Tell you what, take a CRN location near you, and do a trend for Tmax temperature and then trend enthalpy. The hourly CRN files have Tmax and humidity. They are at http://www.ncei.noaa.gov/pub/data/uscrn/products/hourly02/
If you don’t do the work, you have no basis to criticize.
Here is a graph of soil surface temperature vs air enthalpy for several days.
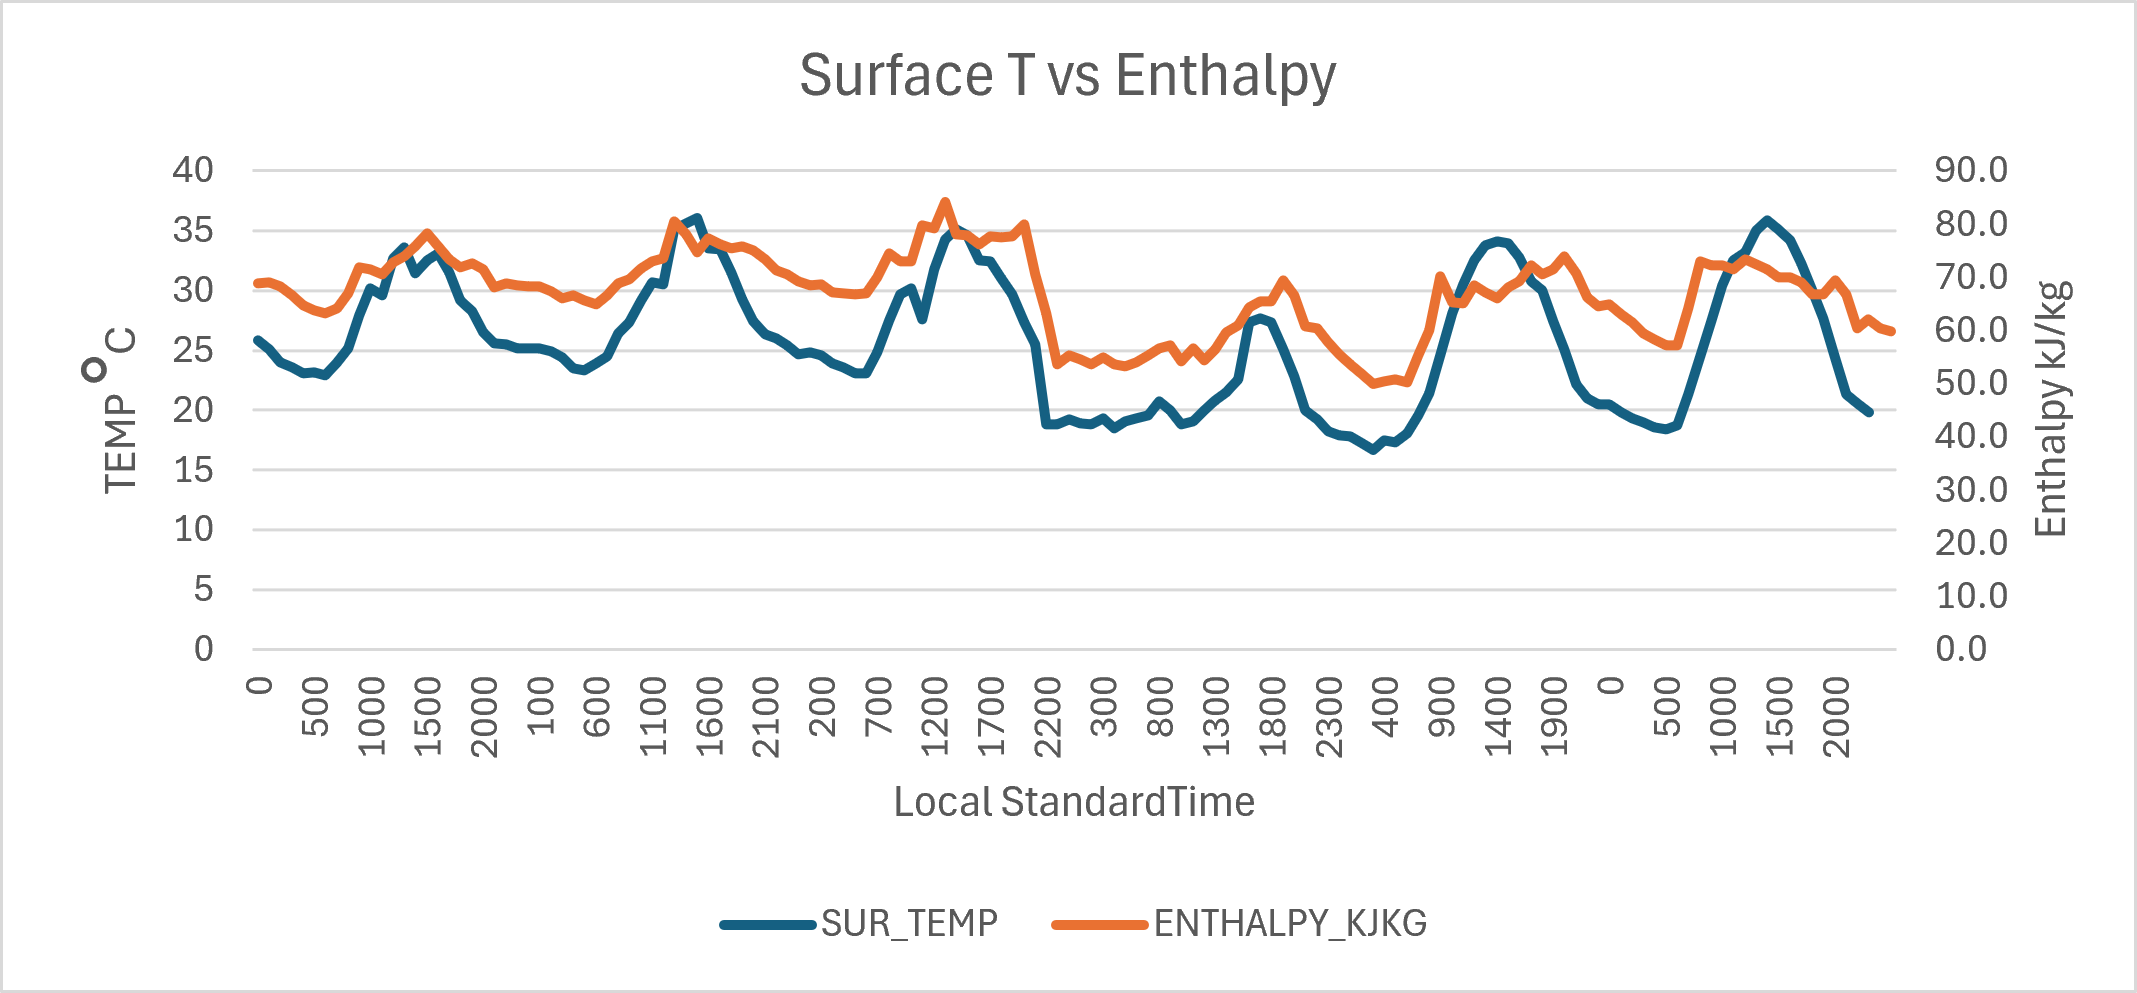
And here is another of soil surface temp vs 2m air temp. Funny how soil is quite a bit warmer than the air except late at night.
Curious, why aren’t temperatures keeping pace with CO2 increases?
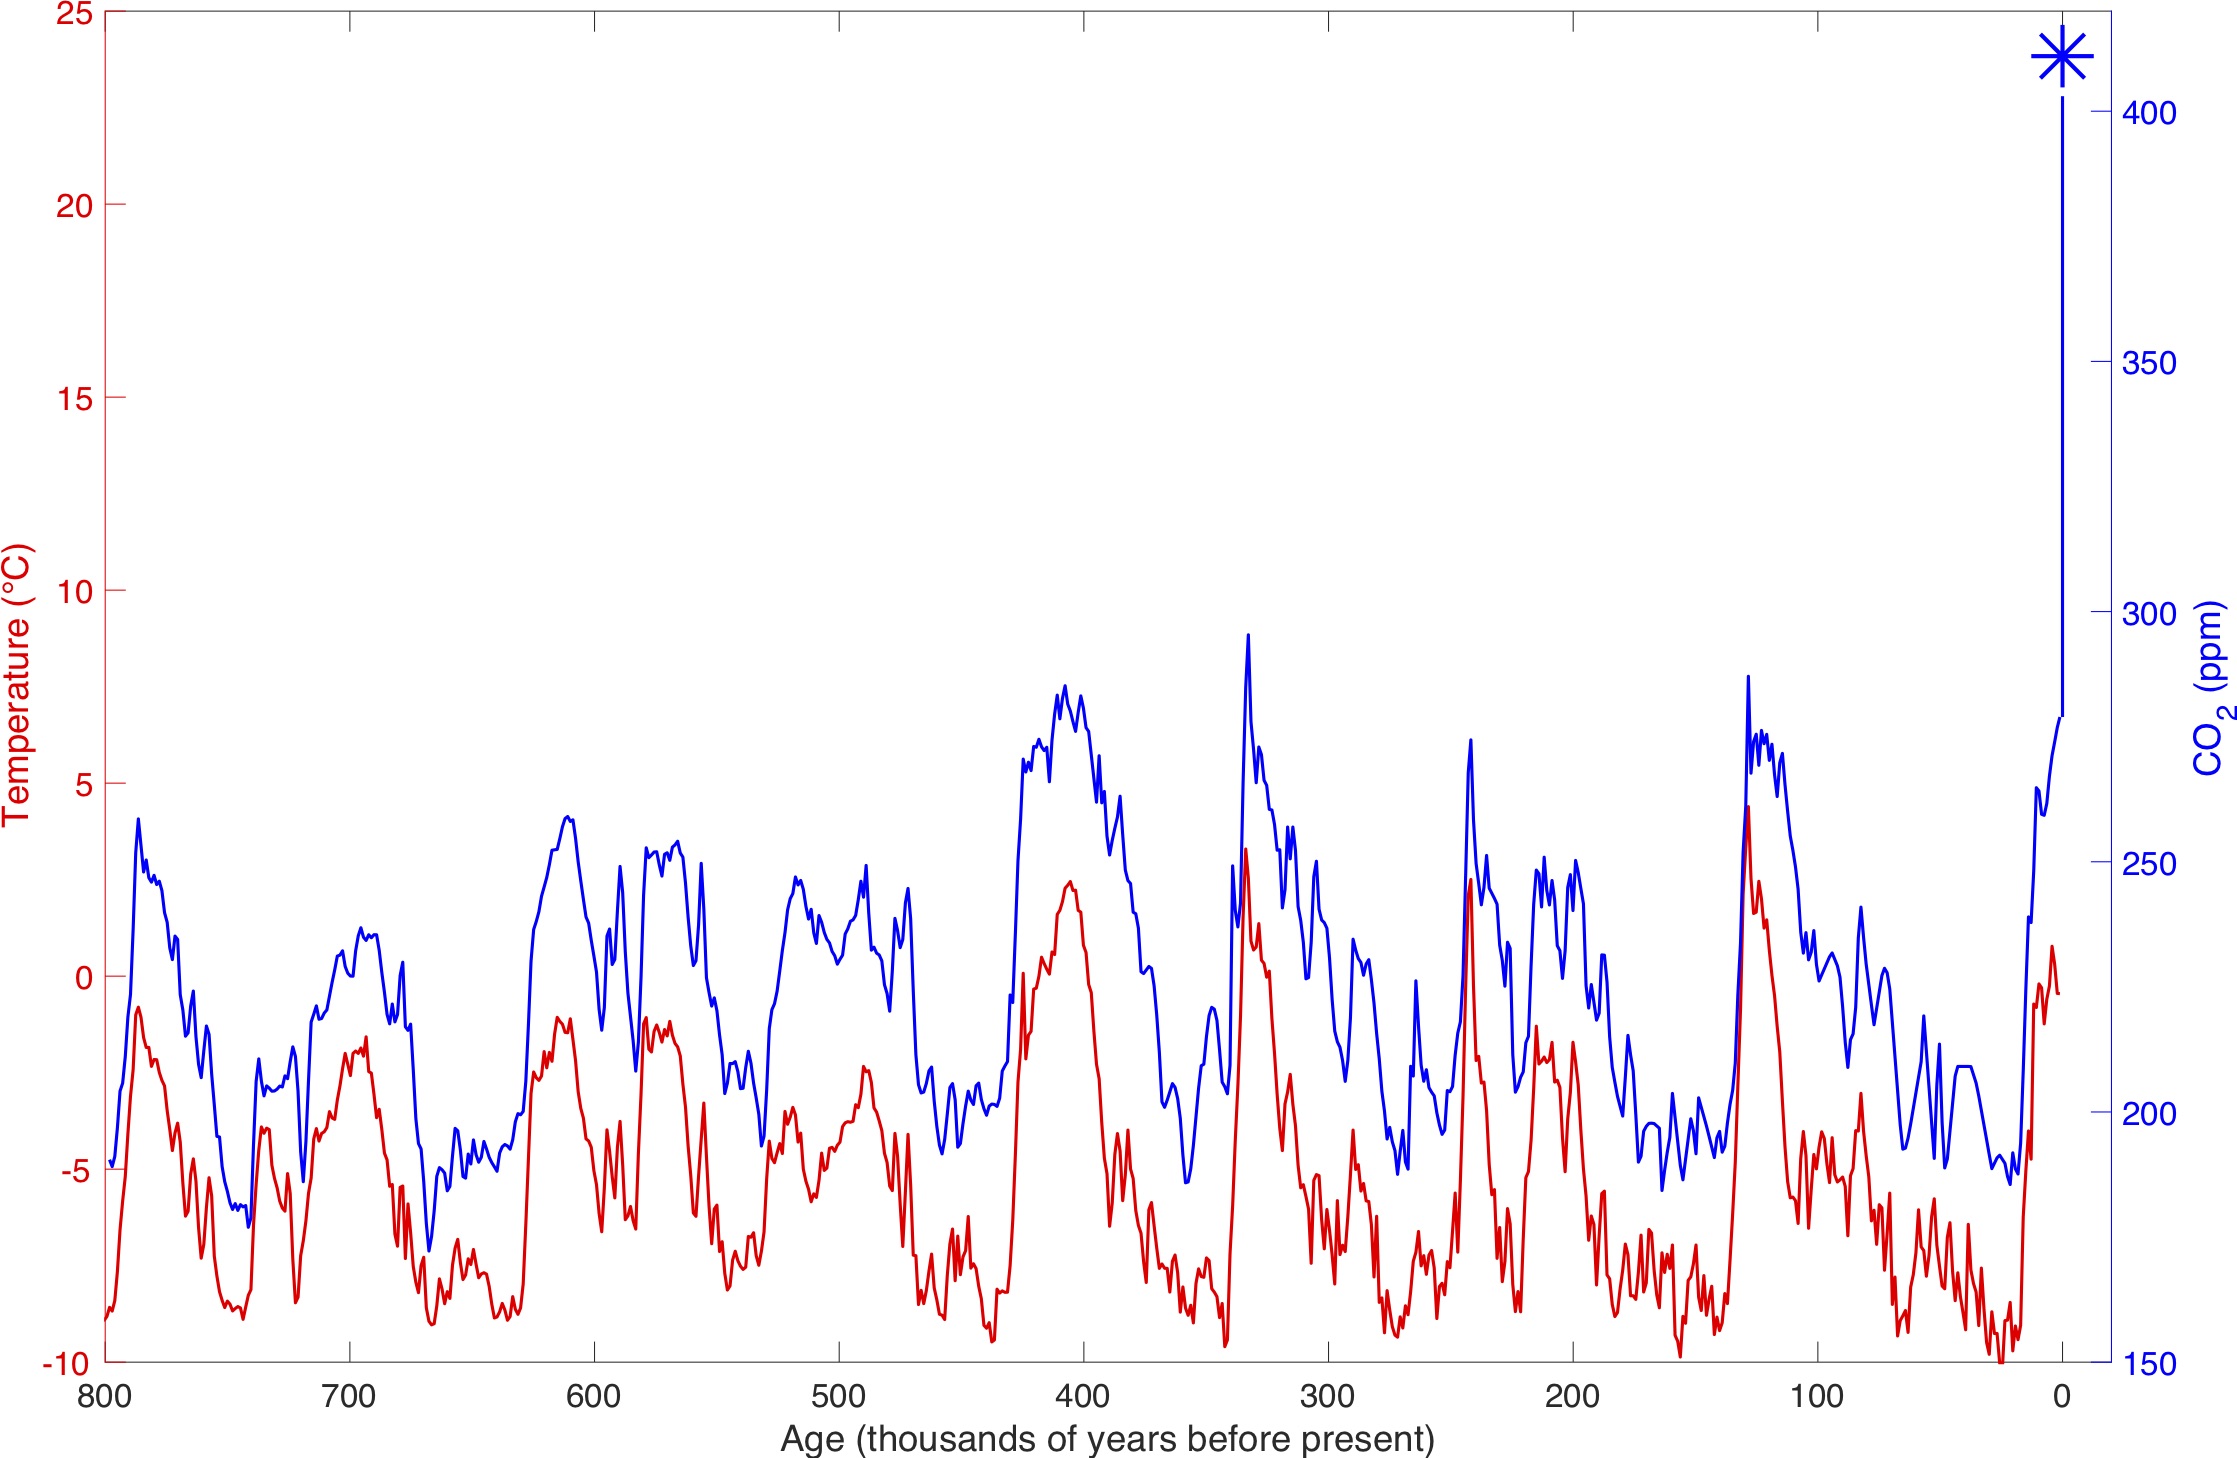
Temperatures where? Looks pretty cold.
Source?
Your favorite !
SKS!
SKS produce their own temperature charts now without labels?
Skepticalscience
Ice Core Data and Mauna Loa measurements
What ice core?
If it’s GISP2 it stops in the 1850s.
Looks like someone has added a vertical blue line to the end of the GISP2 CO2 data using Moauna Loa instrument data but has not updated the temperature data.
Why no link?
Here’s your link
https://skepticalscience.com/co2-lags-temperature-intermediate.htm
Kinda like adding thermometer measurements onto the end of Yamal Tree Ring Proxy data…”Mikes Nature Trick” to produce a Hockey Stick…wouldn’t you agree?
Because as a result.of mankind burning fossil carbon, CO2 has become a driver and not a feedback in the natural carbon cycle.
Sources have outpaced sinks – well our sourcing has.
You appear to think that before modern warming the CC was influenced by humans too. Err no.
Hope that satisfies your “curiosity”.
Driver;)
Baby Driver!
Sorry I have serious doubts that a gas that only comprises 0.043% of the atmosphere can control anything. 🤷♂️🙄
Not much of a driver as temperature has increased only a paultry few tenths since Climatic heating has been ascribed to CO2s influence. If the effects were the same that temperature chart should be upwards of +20°C but isn’t!
Why do you expect a 20 C rise?
Because if CO2 rises from 300ppm to 415ppm and temperature increase is only about 1.5C and thus less than previous warmings the gas clearly has nothing to do with it.
So your hypothesis is that a increase in CO2 of 115 ppm will produce a transient climate response of +20 C?
No, my hypothesis is that CO2 is a function of T and not vice versa, and has absolutely no effect whatever on temperatures.
How did T cause humans to release 700 GtC?
How could it have no effect if it is unequivocally and indisputably shown to impede the transmission of longwave radiation typical of terrestrial emission?
Tell us what equation you use to determine what CO2 can absorb and emit. Stefan-Boltzmann?
Do you think CO2 absorbs the entire power emitted by the earth as determined by SB equation?
As bdgwx says below…..
“How could it have no effect if it is unequivocally and indisputably shown to impede the transmission of longwave radiation typical of terrestrial emission?”
Experiment video here:
https://www.youtube.com/watch?v=SeYfl45X1wo
It is “unequivocally and indisputably” a GHG at terrestrial LWIR and thus MUST also lead T when a *Pulse* is injected into the Atmosphere (~50% rise since pre-industrial), and proceeding at ~40GTn/yr
If you do not agree with the above then I stand utterly confounded how your common sense/logic works.
This is a study re the PETM mass-extinction (Volcanic CO2 injection) ….
https://www.nature.com/articles/nature23646
And another …
https://pmc.ncbi.nlm.nih.gov/articles/PMC8449420/
Exactly. If it impedes the transmission of radiation then the energy carried by that radiation accumulates on the source side of the CO2 layer. And because ΔU = Q – W and and ΔT = Q / (m*c) then warming must occur. And we know 100% for certain that CO2 does impede the transmission of radiation as evidenced by the countless experiments over the last 170 years and by the countless NDIRs in use today.
And for the nit pickers…no I have not forgotten about Q = m*L.
Radiation is not impeded from the surface. Bodies radiate at their temperature period. CO2 can intercept radiation and either thermalize non-radiating gasses or reradiate. Thermalization can raise the temperature of the atmosphere as seen during daytime. However impede means trapping and holding the radiation.
Here is a graph of soil surface temperature and atmospheric temperature. As you can see, the atmosphere never exceeds the soil surface during the day when insolation is occurring. The only way radiation from the surface can be impeded is if CO2 intercepts all that is radiated. That would mean that saturation has been reached as Drs. Happer and Wijngaaren proposed.
What really impedes radiation is H2O absorption as latent heat which doesn’t raise temperature until it precipitates.
Not to nitpick, but you have Q equal to two different things. Generally Qtotal = (Qsensible + Qlatent). The problem with determining Qsensible is that there is a temperature gradient in the atmosphere, generally called lapse rate and another temperature gradient due to the surface warming and cooling.
Here is another measurement to think about. What is the mass of say the top /2 inch of sol compared to the mass of CO2 in say the first 20m of atmosphere? Do the ΔU values compare?
A better question is why you do not expect a 20C rise.
Shouldn’t the relative range of increase in one be to reflected in the other? Or is it that CO2 doesn’t drive temperatures to the extreme often proffered by the Krazed Klimate Kult
No. CO2’s radiative forcing is logarithmic; not linear. And the relationship between CO2 and T isn’t expected to be the same today as it was during the Quaternary Period. This is because in the past something else catalyzed changes in T first which resulted in changes in CO2. Thus the lag. But today changes in CO2 are catalyzing changes in T. Thus the lead. It’s a different situation.
I don’t know. What does the “Krazed Klimate Kult” say and why are you putting so much stock in what they say instead of more reputable sources that use a consilience of evidence approach?
And as a result CO2 has an even less impact on the climate today than it did in the past and will have a miniscule and ever decreasing impact in the future.
The big question is how much the relationship between increasing CO2 and increasing T will wane.
There is indeed a relationship between T and CO2, but it is opposite to the one you believe.
I accept that T causes changes in CO2 and that CO2 causes changes in T. To be opposite of this of this would require no relationship at all which I absolutely reject so you’re either unaware of my belief or you’re not understanding some crucial physical principal here.
No. CO2’s radiative forcing is logarithmic; not linear. And the relationship between CO2 and T isn’t expected to be the same today as it was during the Quaternary Period. This is because in the past something else catalyzed changes in T first which resulted in changes in CO2. Thus the lag. But today changes in CO2 are catalyzing changes in T. Thus the lead. It’s a different situation.
Wishful thinking on your part. Yet another assertion without evidence.
That’s just absurd. There’s like 170 years of evidence.
If what you really mean is that there is no evidence that you would accept then say that instead. But to just say there is no evidence at all is comically absurd since there is literally evidence.
Go on then, present the evidence that T is a function of CO2.
[IPCC AR6 WG1]
Shilling for the IPCC, good job.
Hopeless. Try again.
You said evidence didn’t exist. I showed you some of the evidence. That indisputably falsifies your hypothesis that no evidence exists.
Now if you want to change your hypothesis to be “there is no evidence that I would accept” then so be it. At least in that case there is no way that I could falsify it.
Just a quick look at the IPCC report convinced me it is utter garbage. For example, it relies on specious numbers for ocean enthalpy to calculate Earth’s energy imbalance. From TS3.1:
The global energy inventory increased by 282 [177 to 387] zettajoules (ZJ, equal to 1021 joules) for the period 1971–2006 and 152 [100 to 205] ZJ for the period 2006–2018 (Figure TS.13), with more than 90% accounted for by ocean warming. To put these numbers in context, the 2006–2018 average Earth energy imbalance is equivalent to approximately 20 times the annual rate of global energy consumption in 2018. The accumulation of energy is driven by a positive total anthropogenic effective radiative forcing (ERF) relative to 1750.
We have been over this point several times on WUWT. The very idea that we can calculate enthalpy changes of the World’s oceans is absurd. The rise in temperature required to produce the increase in enthalpy is tiny, far below the resolution of the thermocouples on ARGO buoys. If my memory serves, the increase in ocean heat content from 1960 to 2020 would require a warming of only 0.14°C.
Don’t forget every Joule that is stored in the ocean is a Joule that is not radiated into the atmosphere. If oceans are storing insolation it is not strange that a radiation imbalance exists at TOA.
Climate science can’t have it both ways.
As I said… evidence exists. You just don’t accept it. My guess is that there is no evidence you would accept. Am I wrong?
It’s most strange you seem unable to post such evidence.
As I said above, I can’t take the IPCC seriously as it bases its conclusions on obvious pseudoscience like ocean enthalpy.
I was able to post it. You saw it. You even responded to my post.
Like I said. You don’t accept it. That doesn’t mean it doesn’t exist.
The fact that your argument relies heavily on a claim that no evidence exists at all is so ridiculously absurd and false is devasting to your thesis.
You posted a link to the IPCC WG1 report. I pointed out that one of the pieces of evidence it used was pseudoscientific nonsense. Why should I even bother to take such drivel seriously?
The evidence from the IPCC is a joke. It is not scientific. Physical science requires numbers, equations, predictions. What does the IPCC have? Confidence! High confidence, medium confidence, low confidence. Those are not scientific evidence or predictions. They are guesses.
I see a 24% chance of rain today! What the hell does that mean? If it doesn’t rain, the weatherman wins. If it does rain, the weatherman wins. The IPCC has a high confidence that temperature will reach a certain point? Does that mean if it doesn’t the IPCC still wins?
Give us a break! The IPCC is nothing more than a con man shuffling a pea under a nut. Or a guy standing on a street corner with a sandwich board proclaiming the end tomorrow. When it doesn’t happen, well there is still tomorrow.
The IPCC was set up purely to give some scientific credibility to decision which had already been made to push the Climate Change Scam.
Be honest. Is there any evidence that you would accept? If there is state exactly what characteristics that evidence would have to have for you to accept it.
Be honest, is there any evidence that CO2 has no effect on T you would accept?
Yes. Show that the ΔE = Ein – Eout is false. Show that ΔT = ΔE / (m*c) is false. Show that CO2 cannot influence ΔE in a system in which radiation is in transport. Make sure the experiments are repeatable and reproducible. And finally provide an adequate explanation for why 170 years worth of previous experimentation fooled us.
ΔE = Ein – Eout cannot be proven because neither you nor climate science can define the system with equations that have gradients and the time frames involved. How much Ein is stored in the oceans and the land? If you don’t know that, you cannot compute Eout at all.
Tell us if there is a gradient from the tropics to the poles for both the land and the ocean. Do the land and ocean completely emit all the energy absorbed and in what time frame? You are posing a question that climate science hasn’t and can’t answer. Why don’t you ask “does God exist?”
Because as a result.of mankind burning fossil carbon, CO2 has become a driver and not a feedback in the natural carbon cycle.
Utter nonsense. What evidence do you have that any modern warming has a different cause than previous natural warming episodes? Computer models are not evidence.
Was CO2 a driver when it was 50ppm? That’ supposedly when it had the highest effect, early on. How about at 100? 400? Adding more has less of an effect. So if anything it’s LESS of a driver now.
Because CO2 is accumulating due to intentional release by humans any climate response including temperature changes will lag the CO2 increase.
According to the Climate Change credo, warming should be instantaneous and not lag CO2.
Can you post a link to this “credo” saying that warming stops immediately when CO2 stops increasing? I’d like to review it if you don’t mind.
The radiative effect (“heat trapping”) IS instantaneous. Why should there be any lag at all?
The forcing is instantaneous. The response is not. This should be mind numbingly intuitive and obvious because it has many parallels in your everyday life. If you turn on your oven will it instantly hit 350 F? No, of course not. If you turn on your furnace will it instantly hit the setpoint? No, of course not. Why would you expect the climate system to behave any differently?
If I set my oven to 200C it takes several minutes to reach that temperature, but within seconds the air inside is well above room temperature. The response is therefore effectively instantaneous.
An oven is a really poor analogy that’s been tried in the past. An oven heating element is many, many times as warm as the air. Most heat transfer is due to conduction and convection and not radiation. AT 300+C the heating element is probably radiating little energy at CO2’s wavelengths besides the fact of a small amount of CO2 being involved.
And bgx still doesn’t understand that opening/closing the oven door changes the thermal resistance to the outside.
Lol…if it takes several minutes then it’s not instantaneous.
You seem to have problems with reading comprehension. What does “within seconds the air is above room temperature” mean?
Warming means an increase in temperature, not the final value.
Then spell it out. Use really simple words and be condescending. Talk to me like I’m academically challenged student. Maybe it will help?
It means that the air is above room temperature within seconds. Did I pass the test?
I don’t know what else to tell you. Your oven’s response to the activation of the burner isn’t instant. It’s going to take time for the energy balance to get restored and the inside to achieve its new steady-state. It’s no different conceptually for any other system including that of the climate system.
The air INSIDE THE OVEN is above room temperature within seconds. The equilibrium temperature in the oven is the RESULT of warming, NOT the warming itself.
Is that clear now?
That’s some grade A gaslighting right there. This is what I’m trying to tell you. The response isn’t instant. It takes some time to play out. The climate system isn’t any different in this regard. When you put a radiative force on the system the response doesn’t play out instantly even though the introduction of the force may be instant.
From Geophysical Research Letters 2021:
Changes in atmospheric composition, such as increasing greenhouse gases, cause an initial radiative imbalance to the climate system, quantified as the instantaneous radiative forcing. This fundamental metric has not been directly observed globally and previous estimates have come from models. In part, this is because current space-based instruments cannot distinguish the instantaneous radiative forcing from the climate’s radiative response. We apply radiative kernels to satellite observations to disentangle these components and find all-sky instantaneous radiative forcing has increased 0.53 ± 0.11 W/m2 from 2003 to …..
First…the citation is [Kramer et al. 2021].
Second…this publication does not say that warming stops when CO2 increasing.
Third…is this the “credo” you were talking about?
Where did I say that warming stops when CO2 is increasing? The evidence from ice cores is clear that T and CO2 are tightly and causally correlated over time. The problem for you is that the causation is the wrong way round.
You said, “According to the Climate Change credo, warming should be instantaneous and not lag CO2.” That’s what I responded to and especially the part about it not lagging.
It’s not a problem for me because I accept the consilience of evidence that T can cause changes and CO2 and that CO2 can cause changes in T.
And besides ice cores don’t tell us that CO2 allows lags T. Sometimes it leads like was the case of the PETM and other ETMx events.
Pure sophistry.
Can you give me another example of a natural phenomenon in which cause and effect can interchange? I sure can’t think of one.
If CO2 causes T to rise and T causes CO2 to rise, why does this not result in thermal runaway?
How do you know that the rise in CO2 was the cause of the PETM and not its effect?
Strange. It’s common enough that you should have been able to think of something almost instantly. Right off the top of my head…blood glucose-insulin dynamics. Changes in glucose lead to changes in insulin. Changes in insulin lead to changes in glucose. Perhaps more applicable and analogous is temperature-combustion dynamics. Combustion causes an increase in temperature. An increase in temperature causes an increase in combustion. Those are just some examples off the top of my head. There are countless others we could discuss.
Because with most bidirectional causality phenomenon their are limits to the feedback. You may have heard these factors being referred to as damping, buffering, saturation, limiting, braking, homeostatis, etc. For T and CO2 specifically we have the Komabayashi–Ingersoll limit and the finite of stock of carbon. Basically a runaway greenhouse effect isn’t possible on Earth like it was for Venus because of these limiting factors.
Because it preceded the rise in T. And since cause precedes effect and because there is an identifiable physical causative mechanism we know that CO2 was the cause in that case.
Let’s take your example of combustion shall we? This is an example of positive feedback leading to thermal runaway. The rise in temperature is the effect of combustion. Combustion is the cause of the rise in temperature. Not analogous to this case.
CO2 levels were much higher than today during the Huronian glaciations.
The high surface temperature on Venus is merely the lapse rate (pressure 90 bar). Nothing to do with a runaway greenhouse effect.
Don’t forget that the opposite is true as well. Combustion is an effect of a rise in temperature. Temperature is a cause of combustion. The analog is spot on since we can swap CO2 and combustion and the statement is still correct.
And the Sun was ~15% dimmer. That is equivalent to about a -50 W.m-2 difference at TOA. There is no amount of CO2 that could compensate for that. There must have been another factor in play. CH4 is a great hypothesis that can explain Huronian Glaciation via Great Oxidation Event.
Have you considered that the pressure is a result of the high temperature? BTW…that reminds me of another obvious example of bidirectional causality. PV = nRT. An increase in T can cause an increase in P or an increase in P can cause an increase in T. It just depends on which one changed first.
Have you considered that the pressure is a result of the high temperature?
Yes, and it has nothing to do with it. The temperature in the atmosphere of Jupiter at the 90 bar depth is over 500K. Simply compressing a gas adiabatically heats it.
Have you considered that the pressure is a result of the high temperature? BTW…that reminds me of another obvious example of bidirectional causality. PV = nRT. An increase in T can cause an increase in P or an increase in P can cause an increase in T. It just depends on which one changed first.
There is no analogy between a simple, well-understood functional relationship like the Ideal Gas Law and the incomparably more complex Earth’s climate.
What evidence falsifies the hypothesis that Venus’ temperature changed first?
For the same reason the bottom of the Grand Canyon is much warmer than the top.
I don’t have to show any evidence to falsify that hypothesis. The onus is on YOU to show evidence that falsifies the hypothesis that Venus’ high temperature is merely the result of adiabatic compression.
You do if you want to convince people that CO2 did not play a role Venus’ T.
Yep. If I want to convince people that an increase in P was not the cause of Venus’ T then I should I present evidence contrary to that hypothesis.
The hypothesis that Venus’s surface temperature is merely the result of adiabatic compression fails because it violates the 1LOT. Adiabatic compression only adds heat while work is actively being done to compress the gas W = -integral[P dv]. Venus’s atmosphere has been in hydrostatic equilibrium for billions of years. At steady state, a 735 K surface radiates 16000 W.m-2, but Venus absorbs only 150 W.m-2 of sunlight. Without greenhouse trapping of infrared radiation, that ‘compression heat’ would have bled into space in weeks if not days.
We also have an empirical line of evidence from within the solar system as well. Titan. It’s pressure is 1.5 bars yet the temperature is only 93 K. If pressure and pressure alone set temperature then we would expect Titan to be significantly warmer. The point…compression does more to determine the final density than it does temperature because it does not supply a continuous source of wattage to balance the radiative escape.
Actually, the pressure is a result of mass and gravity. The pressure at any point in the atmosphere is a result of the weight of the air above, i.e., mass and acceleration of gravity over an area
Using gas laws to evaluate a single variable requires holding the other variables constant. The gas laws are state equations. For instance, PV=nRT. PV are tied together. You can find the value PV=?, but you can’t determine P or V without knowing the other.
Is your position that Venus’ gravity increased?
Did I say that? Don’t put words down that I did did not say.
I said the pressure is a result of mass and gravity. At any point in the atmosphere the pressure is determined by the mass above the point, gravity and the area analyzed. IOW, P = F/A = (mg)/A. It is a little more complicated because gravity varies with height, but that is the basis.
Just for grins, what does the idea gas law say the base temperature of the earth’s surface would be at STP. It will surprise you. Tell us WHY it isn’t at that temperature.
Your use of the Gas Laws as an example of cause and effect interchanging is specious. Imagine a cylinder containing a gas at a certain pressure and temperature. Compress the gas to half its volume and the pressure doubles (if isothermal). Is the cause of the increase in pressure the volume being halved, or the external force doing the work?
If you can present me with an example of a cylinder of gas at equilibrium spontaneusly undergoing a change of volume without an external force or change in temperature I will gladly accept defeat.
The cause is the work being done. The IGL is just a state equation. It doesn’t tell use which term changed first; only that a change in one term must be paired with a change in another.
First…that’s not possile.
Second…that touches on my challenge to you. In the context of Venus how can P increase causing a change in T while keeping T high in a steady-state over billions of years without 1) work being on the atmosphere and 2) trapping heat at the surface?
Third…Let me get this straight. You are saying that you’re criteria for acceptance that the opposite where a change in T can cause a change in P is to falsify the IGL, but you’ll happily accept that a change in P can cause a change in T under the same law. Yes/No?
There is no such thing as ” trapping heat”. What you mean is radiative equilibrium.
Why do the atmospheres of Uranus and Neptune also warm with pressure? After all, they consist mostly of hydrogen and helium, neither of which absorbs IR. Would Venus be much colder if the atmosphere was helium?
You have not explained why the temperature at the bottom of the Grand Canyon is so much higher than at the top. Do you think this is due to the Greenhouse Effect?
Third…Let me get this straight. You are saying that you’re criteria for acceptance that the opposite where a change in T can cause a change in P is to falsify the IGL, but you’ll happily accept that a change in P can cause a change in T under the same law. Yes/No?
I can’t believe you’re this obtuse. P, V and T are dependent on one another according to the Gas Laws. They cannot be varied independently of one another. However, as I stated above, one is not the CAUSE of the other two, as you seem to think. In my example, a change in P, V or T of a volume of gas requires an external agency, which is the CAUSE.
Ah…there it is…the rejection of the 1LOT. If I cannot convince you that the 1LOT is true and that energy/heat can be trapped in a body via ΔE = Ein – Eout when Eout < Ein (or ΔU = Q-W in traditional nomenclature) then I’m probably not going to be able to convince you of anything. Trapping heat such that ΔE > 0 (or ΔU > 0) is indisputable and unequivocal a consequence of the 1LOT whether you accept it or not. Don’t ever let it be said that I failed to vigorously and vehemently defend the 1LOT and the inevitably of trapping heat when Ein > Eout.
Semantics. If I add heat to a gas in a vessel in an effort to increase T then an increase in P must follow. If I instead accelerate that same vessel in effort to mimic an increase in gravity and increase P on one end then an increase in T must follow in accordance with the IGL. One is isochoric heating where T leads/causes P because particles with higher kinetic energy collide more frequently and vigorously. The other is isentropic/adiabatic compression where P leads/causes T because particles that collide more frequently and vigorously have increased kinetic energy. I do appreciate that you understand that the root of the casual chain (or external agency as you call it) is what my question I posed to you was really getting at.
So which do you think is more likely to have occurred on Venus: an external agency to influence P through isentropic/adiabatic compression or to influence T through isochoric heating? And if you think isentropic/adiabatic compression was more likely then how do you explain the maintenance of the extreme radiative imbalance at the surface with Fout = 16000 W.m-2 given Fin = 150 W.m-2 without some kind of energy trapping effect?
The issue is not “ΔE = Ein – Eout” The issue is can a radiative gas absorb energy and store it.
Here is a quote from Planck’s Theory of heat radiation.
Notice the bolded part, especially, “absorption without emission, is impossible in nature”. This goes along with Kirchoff’s law that absorpivity = emissivity. Basically, it means radiative molecules cannot store energy for any length of time.
You need to provide the process by which radiatively active CO2 can store energy. There are no non-radiative molecules like N2 or O2 to thermalize as on earth.
The big issue is pressure broadening of the absorption bands of CO2 and sulfuric acid clouds. Also remember that absorbed energy can be partioned into translational motion which raises temperature. I am no expert on Venus, but I know it is so different from earth that comparisons are not valid.
What would the surface temperature of Venus if the atmosphere were replaced by helium? Do you really think the temperature differential between the bottom and the top of the Grand Canyon is due to the greenhouse effect?
It would be significantly cooler and that’s even with the likely reduction or even complete disappearance of clouds because the H2O, H2SO4, SO2, etc. would precipitate out. This is because Helium is monoatomic which has no vibrational mode to absorb the terrestrial radiation. Even if transient He2 pairs form they would be mostly inert with respect to the terrestrial radiation anyway. Basically, there would be no mechanism to trap heat such that ΔE > 0 so the surface temperature would be much closer to its blackbody temperature. One particularly interesting note…with all He atmosphere and a solar day that is 117 Earth days there would be large difference in temperature between day and night.
I don’t think that. I’ve never said. I’ve never insinuated that. You and you alone own that argument. and as always I tell people…don’t expect me to defend your arguments especially when they are absurd.
You are not describing the cause and effect here. Blood glucose triggers the production of insulin which then reduces blood glucose. A lowering of blood glucose then triggers a reduction of insulin.
The cause here is blood glucose in both cases. The production of insulin the result.
Absurd. Diabetics inject insulin specifically to lower glucose. Serious question…is your knee-jerk reaction always to argue with everything I say even when it is obviously, unequivocally, and indisputably correct?
Of course they do. The cause is a rise in blood glucose. The effect is lower blood sugar. You forget the problem with low blood sugar. It can cause the need to raise blood sugar. Again the cause is blood sugar and the result is a rise in blood sugar.
You obviously have no experience with diabetics. The new monitors and pumps constantly monitor blood sugar and the amount of insulin required to maintain the proper level. One of my grandmothers died 60 years ago from complications of diabetes. She took 3 insulin shots every day whether they were needed or not. There was no way to monitor it at home. She bounced from way too much and not enough. Thankfully, things are much better today.
First…I’m truly and genuinely sorry your grandmother died of diabetes. That sucks.
Second…I stand by what I said. Changes in glucose cause changes in insulin and vice-versa. It should have been a simple and intuitive example of bidirectional causality. I hope for the sake of diabetics you aren’t telling them that injecting insulin has no effect.
“is your knee-jerk reaction always to argue with everything I say even when it is obviously, unequivocally, and indisputably correct?”
We’ll take his latest response as a yes!
Wow, bdgwx, you’re quite effective. No wonder you have so many stalkers…
Sometimes I feel like I’m living in the Twilight Zone when participating here. Look at Grawmethecat’s response. He’s now gaslighting me as if I didn’t understand that insulin causes blood glucose to decline and calling me a cretin even though 1) he couldn’t “think of one” example of bidirectional causality nevermind the glucose-insulin example and 2) I’m the one who first mentioned this example in the first place. What a strange world WUWT can be sometimes.
The injection of insulin is the cause of the lowering of blood glucose, you utter cretin!
You are quoting from the CAGW Bible with no experimental evidence or even a functional relationship that has been verified. Don’t be an acolyte of a religion, be a scientist looking at physical experiments that verify a funtional relationship.
Correct. And it is also the warmest summer (JJA) in the USCRN data set!
Anyone can check this for themselves. Watts even links to the data!
Do any of you self-described ‘skeptics’ ever actually check anything for yourselves?
I check my locale. It was nowhere near the warmest summer here. Therefore the claim is bogus. You could say it was the warmest in some parts of the US, even large parts, but not the entire contiguous US.
The claim isn’t that every part of CONUS had it’s warmest summer on record, so the claim isn’t bogus, because that’s not the claim.
What exactly is the claim?
Your graph appears to be a graph of smoothed 3-month values. Such smoothing can alter the actual picture. Anthony’s shows month by month I believe. That is hard to argue with. One high month can make the 3 month average appear to be large. Why do you want to smooth averages anyway? Quite honestly, that is akin to data mining so you can find something to propagandize with.
How would you go about representing average US summer temperatures anomalies if not by averaging June, July and August anomalies?
Would you go for random months, like October February and December?
Summer is June July and August in the US, right? Always has been. Nick didn’t invent that rule.
How would you set about averaging annual temperature anomalies other than averaging the monthly anomalies over the course of a year? What would you go for, house prices?
Summer has always been about June 21st to September 21st, Einstein.
The report came from NOAA and they are a Meteorological organisation.
FYI: Meteorological summer is June, July and August.
So take up your specious dig with AW.
That’s astronomical summer. Met summer in the NH has always been, by convention, June, July and August.
It even says as much in the article, but you didn’t object to that, for some reason.
Yes I do find the redefinition of “summer” to be interesting. September is more of a summer month than June, with about three weeks out of four as opposed to one week out of four.
Meteorologists average over calendar months and so doing it from the 21st to the 21st for seasons is a tad inconvenient.
“Meteorologists define summer as June, July, and August (June 1 to August 31) because using whole, consistent three-month blocks makes it much easier to collect, compare, and analyze climate and weather statistics. [1, 2]
The lengths of individual months is not constant and varies by 10%, good choice.
Just what a good scientist would say.
Let’s just use devices that don’t have decimals, that will make it easier to find the Higgs Boson, we’ll just need to make more measurements.
We’ll just design the brakes on this plane assuming all runways are 10,000 feet long. It will make it easier.
Do you know how stupid this sounds?
Sounds sensible instead of changing the start and finish date from year to year. For example the summer solstice was on 20th June for some of the last ten years not the 21st.
Gorman says:
’One high month can make the 3 month average appear to be large.’”
This is the logic we have to contend with.
By implication it seems he is saying that all 3 summer months have to have been a record in order for the whole summer to have been.
Thanks for putting words in my mouth. It shows the lack of education in debate that you have. You would automatically lose when doing that regardless of the quality of your information.
I did not say that. I said one month can make an average higher. With two normal months and one high one, the mean can make it appear they are all high.
I will state again, smoothing is almost always done without calculating a standard deviation of the combination. NOAA is no different, they do not provide that info in these graphs.
A real statistician would want to know the statistical descriptors that go along with a smoothed trend. Obviously, you do not care.
“How would you go about representing average US summer temperatures anomalies if not by averaging June, July and August anomalies?”
I wouldn’t, because it’s nonsense.
How about 3 different trend lines, one for each month, either on 3 separate graphs or all on the same graph?
Better yet, 3 months is about 90 data points. That will fit easily on a graph and will show how the temperature varied throughout. Twenty different lines on a graph will give a much better picture where the current year stands. You only need to put the other 19 years in a more transparent background so one can see what the difference is.
I might see what CoPilot can do for a Python script.
Averages hide data! It is as simple as that.
The graph is exactly of what is discussed in this WUWT article. The average temperature for each summer. It is just the statistic shown in the head post USA map.
Taking this info without examining the underlying data is what NOAA and warmists hope the public does. A real statistician would want to know the appropriate statistics for the smoothed data. Why are you not trumpeting that?
“Why are you not trumpeting that?”
Why isn’t AW “trumpeting that”?
That isn’t an answer to my question. You don’t have an answer do you. I am not surprised.
There were three consecutive high months in USCRN; hence them being the warmest summer months in that record.
June was the coolest of the three, at 0.83C warmer than the average for June; but still 7th warmest in USCRN.
July and August both set new monthly warmest records in USCRN: 1.44 and 1.51 C respectively.
Now, since numerous links are provided to the data source, you could easily have checked this for yourself, but for some reason you chose not to.
I did. That does not refute my argument. Smoothing hides data and appropriate statistics are never shown. Why don’t you address those problems instead.
We have to address (or ignore) this hobby-horse of yours in most threads.
Try to live in the real world.
The statistics are what you see.
There are no “statistics” to describe the weather.
Thousands of averaged anomaly data points.
Which cancels out random instrument calibration errors.
(likely as many +ve as -ve).
The rest cannot be determined and thus objected to by a reasonable person.
The ol’ trendologists’ crutch: “Everything is random, Gaussian, and cancels!”
So if I lay 10000 bricks that are 8″±0.5″ end to end, all measurement uncertainty cancels.
Or, if I survey a new road across Kansas, about 450 miles, and each mile has an uncertainty of 1°, all the uncertainty cancels and I come out right at the bridge entrance?
You have no clue about uncertainty. You cannot judge what is correct and what isn’t. I’ll bet you can’t define what an input quantity is.
I have yet to see any verification of this.
What you have just quoted is an old holdover from “error analysis”. Even that did not allow +ve from one measurand cancel with a -ve from another measurand. The logic doesn’t hold let alone the physical reality. The +ve and – veare part of the measurement of a given measurand. The +ve and – ve from another measurand can’t reduce the uncertainty in the other.
If there are two readings 30±0.5 and another 31±0.5 you have intervals of 29.5 – 30.5 and 30.5 – 31.5. Those intervals do not overlap. They cannot cancel. If you had studied measurement uncertainty you would know that.
Uncertainties (±0.5) add, always. If you don’t believe me, find an equation in JCGM 100:2008 where uncertainties are subtracted.
The rest cannot be determined and thus objected to by a reasonable person.
In other words, no answer.
There are so many ways to misrepresent and mischaracterize raw observed data, I don’t know how any of the pronouncements can be trusted. “Adjustments” certainly allow cherry-picking and bias, and it seems they are all in one direction only – hotter.
The Urban Heat Island effect is real – why can’t affected stations be relocated? Couldn’t there be two temperature data sets, one solely consisting of UHI stations and the other not? Then we could more easily see the effect of urbanization which must be quite large.
“The Urban Heat Island effect is real – why can’t affected stations be relocated?”
It is – but USCRN shows that ClimDiv stations are being over compensated for in that, at least for max temps in the summer months.
Whilst min temps are about equal.
That’s what USCRN was put in place to do. It’s a “reference” network (The ‘R’ in USCRN stands for ‘Reference’).
And guess what? The pristine data are warming faster than the adjusted data.
If you read Anthony’s post carefully you’ll see that he doesn’t deny this.
Yes, I know
Sorry, meant to reply to NCL.
Why would you want to relocate them? The warming UHI causes is real and should be included in nClimDiv.
We sort of have that already. nClimDiv includes all stations including urban ones. USCRN only includes rural stations.
USCRN shows more warming than nClimDiv. This means the homogenization algorithm in nClimDiv is still biased too low.
Lately, our local meteorologists are showing the number of 100F or more days experienced today and in past years, and this year is not even close to a record year. The years 1934 and 1936 are at the top of every list.
James Hansen said 1934 was 0.5C warmer than 1998, which makes it warmer than 2016, too, and of equal warmth to the 2024 anamoly.
NOAA and NASA still searching for the hottest year evah! If they can’t find one, then they just make it up in their computers.
I am in the Kansas City area. The last time our official temperature hit 100 degrees was in Sept 2023. It doesn’t look like it will make it this year either. And most records were set in the 1930s.
The 1930ies were the dustbowl times in your country iirc( and around that timeframe they almost cancelled the Winter Olympics in Aspen? as there was no snow).
So it’s highly likely that it was hotter during that period.
Nowadays 10% the size of the 1930ies dustbowl would be sold as the worst catastrophy in human history.
Let’s not forget another change that has taken place over the last 30 years, substantial reduction of SO2 emissions. Satellite data has shown earths albedo has been reduced by getting rid of these cloud forming aerosols and this has just as big an influence on increased short wave solar heating that CO2 has on reduction of long wave thermal radiation.
I read some time ago that variation of only ~ 4% in assumptions for ‘clouds’ influence in the models produced as much change in projected temps outcomes as atmospheric CO2 content growth did.
No actually 4% cloud cover reduction would have as big an effect as the PURELY HYPOTHETICAL effect of DOUBLING atmospheric CO2.
And the CO2 “effect” assumes all other things held equal, in reality never demonstrated empirically.
Correlation does not mean causation. Deep breath, correlation does not establish causation, Deep breath, correlation …
If a tiny number of powerful variables governed the planetary cooling system then the whole mystery would have been solved last century.
As an ameatur astronomer, I can say pretty confidently that from July to last night, the nights have been oppressively hot.
And that is why I have had a fire in my wood stove for the past two weeks … What? .. Oh, never mind.
Did I read somewhere that one of the ski mounts In Oregon had 3″ of snow a couple of weeks ago?
Between Thursday, September 3, and Monday, September 7, 2026, Mt. Bachelor picked up roughly 4″ of snow at its higher elevations.
But where? Not everywhere. Nights here on Whidbey Island for ALL of August have been at most in the 60s, some in the 50s. And daytime temps rarely got out of the 70s. It was nowhere near the warmest summer.
If you are going to lean on that NOAA data, maybe they should update the months after May? What are they sitting on — something inconvenient? It’s been a hot late summer. “Hottest evah” is just a bunch of marketing nonsense. (Coming from Trump’s NOAA I see.)
Oh, I see, the USCNR chart in the article is through August. But the one on the main page, on the right hand sidebar, THAT has not been updated. Sorry. Yes, through August, one month spiked a bit but July-Aug pretty much in recent range.
So what if it was the hottest? Did the next hottest ones have major adverse effects on population growth, life expectancies, agricultural output, food supplies, GDP growth, and overall population and economic well-being? There may have been some regional disruptions in a few of the above, but the US and almost every other country survived quite well. It’s only the career alarmists that insist on blowing these annual fluctuations out of proportion. The rest of the planet just takes them in stride.
Wonder why Watts even bothered to bring it up?
Very nice Anthony. We need lots more reporting like this.
Suggestion for all countries, including the US.
Check your fundamental daily surface air temperature data base.
For many countries, these fundamental temperatures are about all that there is available to construct past weather/climate over the past 100 to 150 years.
The fundamental Australian data base, the start point for all versions, can be downloaded from our Bureau of Meteorology BOM web site Climate Data Online, CDO. BOM web sites claim this is “raw, unadjusted” and much as written down by the original observers.
Colleague Tom Berger and I used forensic mathematical statistics on the 112 stations selected by BOM to be adjusted into several versions named ACORN-SAT. These adjusted sets are double dipped because the fundamental data are also adjusted.
Link: https://www.geoffstuff.com/V14_fullBOM.xlsx
An example: The important Sydney Observatory station had 4 examples where a calendar month of data had been copied and pasted to another year, 40 years apart in one case. Nature does not do calendar months. This is not just an occasional patch by the original observers. Almost every one of the 112 selected stations has irregularities in the forensics. Nobody seems to have looked at this data quality and reported on it.
It is possible that these data sets are still being adjusted today by BOM software dating back to around 2007. More questions have been asked.
We have got one major Australian newspaper interested, we have several Federal politicians preparing to question BOM under oath.
Geoff S
They did. The pristine USCRN sites had their warmest summer on record in 2026 and were warmer than the adjusted US ClimDiv data.
Looks like the adjustments are having a cooling effect, if anything.
The link does not work, but nobody reported this.
Did anyone bother to look?
Try this:
https://www.geoffstuff.com/V14_fullBOM.pdf
Geoff S
I read from your post in another thread. It points to very bad algorithms to change data and possible manual manipulation on top of that. So sad that bureaucrats feel the need to falsify data in order to justify an irrational belief. On might expect that from religious fanatics but so-called scientists, no!
Apart from the glaring fact that June, July and August 2026 are the warmest June July and August in the USCRN record.
At +1.26 above the 1991-2020 average, summer 2026 was the warmest on record by a country mile. The next warmest JJA in USCRN was +0.99C in 2021.
USCRN was also warmer than the adjusted ClimDiv data in 2026, which averaged +1.15C.
So if USCRN is the ‘pristine’ data set, and it is setting warmer temperatures that the adjusted one, what does that tell you?
“ NOAA simply makes up temperature measurements for a huge number of closed stations based on averaging from surrounding stations, to maintain record continuity”
Instead of fabricating data from missing sites, why not simply drop all the data from these sites. That completely cancels the fabricated data uncertainty. They need to adult-up and live with what they do have.
With this logic, my first cat is now 68 years old because I refuse to admit she died. WOW.
They do have the USCRN data, which not only confirms their ClimDiv data, but in fact suggests that the adjustments they are making to ClimDiv may be introducing a cooling bias.
Your mistake is assuming it CONFIRMS adjusted data. That is a circular argument if you don’t recognize one.
Of course it confirms!
Confirms that there is no UHI contamination that is not adjusted out of the Climdiv temp series.
And as both I, TFN and bdgwx have said (many times in this thread) there even appears to be a cold bias introduced into Climdiv as a result.
If ClimDev has been given a cold bias, then why are current temperatures touted as being the warmest ever?
Australia’s national broadcaster, the ABC, told viewers of its primetime news bulletin that, and I quote, “August was the warmest on record for our planet”.
https://twitter.com/BrianBellia/status/2098654215484985840
Anthony pins the tail on the donkey, and all the usual Fake Data proponents are aghast.
The *pristine* USCRN shows that the US summer was warmer (by 0.4F) than the ClimDiv data for max temps and that for min temps they were both the same within 10ths of a deg F (If you bother to go to the NOAA link and investigate).
So that shows AW pinned “the tail on the donkey” over UHI still affecting ClimDiv does it?
NB: He says …. “One plausible explanation is the urban heat island effect (UHI).”
No, if anything it shows that the UHI effect compensation on ClimDiv data is introducing a cold bias (as TFN has also pointed out).
Aghast.
None of this article makes any sense.
Anthony Watts complains about a record summer (Jun-Jul-Aug) in the NOAA US ClimDiv data; the data that are adjusted by NOAA to account for poor siting, etc.
He says NOAA are ignoring the “most important” temperature record, which turns out to be USCRN, the temperature data AW describes as “… America’s gold standard surface temperature network“.
But when you look at the USCRN data (and he even provides a link to it, to be fair), you find that its US temperatures were even warmer than those reported by the ClimDiv data for summer 2026!
AW seems to be saying: ‘Ignore the ClimDiv data, look instead at the USCRN data, which are even warmer than the ClimDiv data!’
Is there a world in which you debunk a new record warmest temperature by pointing to a data set that produced an even warmer one?
Apparently there is, and it’s called ‘WUWT’. Leave your common sense behind!
Here is the problem in case you are blind. Adjusting ClimDiv to match USCRN removes data that are correct. UHI is real. It should be reported as real, not adjusted away. The way to fix this is not adjustments but to tell people that live in UHI areas that they are suffering more than rural people.
Adjusting UHI out of the global data set actually destroys what the globe is doing. Doesn’t that upset you? How can you examine radiation values from temperatures that have been adjusted. It is a built in mechanism for showing that CO2 “traps” heat.
You’re completely missing the point here, incredibly.
The USCRN stations are sited in locations that do not have the UHI effect. Yet they are warming at as fast a rate as those that do; slightly faster, in fact.
USCRN supports the US ClimDiv data fully. Anthony Watts is saying that we should ignore the ClimDiv record in favour of the USCRN data, which are warming at a faster rate than ClimDiv and were warmer on average during the record summer of 2026 than ClimDiv was.
How does that make any sort of sense?
Let me remind you that CRN is probably not a good view of an average temperature across the U.S. Only 38 states are represented. There are many stations in the south like Alabama, Georgia, and Texas. Maine, Montana, Wyoming, and Idaho have none. These are the more northern states with lower temperatures. Is it any wonder the temps might show higher values than CONUS in 1930 or other dates?
Typical numbers is numbers. Throw something together and if is shows what you want, use it. That is called confirmation bias.
USCRN shows more warming than nClimDiv.
Averaging disparate temps will do that.
What is ” that” to which you refer?
I see that I am in the much above average zone. For sure we had 36C every day along with drought for about six weeks . I have seen 40C in the past sometimes for a week.
However the nights were cool. I was able to maintain comfort in the house without using my A/C at all this year. I most years there is a period of hot nights. Not this summer.
I did design my house to reduce summer heat gain.
Based on that I could say that the overall temperature was not overly high.
Here is a question for the warmists among us. You know who you are.
I just had an argument with some about “spatial averaging”. Is USCRN properly designed for correct spatial averaging? Small area states like Rhode Island and New Hampshire have two CRN station, while Pennsylvania, Iowa, Minnesota, and Michigan have only one. I count only 38 states having a CRN station. States like Colorado – 6, Alabama – 5, Texas – 5, and Georgia – 4.
They seem to be fairly uniformly distributed in the lower 48.
 ?utm_source=en.wikipedia.org&utm_campaign=imageinfo&utm_content=original
When I go through the 2026 CRN database I get.
Alabama – 19
California – 7
Colorado – 6
Nebraska – 4
Oklahoma – 4
Texas – 8
Total 43 states, 130 stations
In 2006, there were 38 states, 87 stations.
The number of stations has changed drastically throughout the period. I wonder if the south is overrepresented. AL+OK+TX = 31 which is about a quarter of the total.
Just for grins, here are the Alabama stations.
CRNH0203-2026-AL_Brewton_3_NNE.txt2026-09-17 00:181517436
CRNH0203-2026-AL_Clanton_2_NE.txt2026-09-17 00:181517436
CRNH0203-2026-AL_Courtland_2_WSW.txt2026-09-17 00:181517436
CRNH0203-2026-AL_Cullman_3_ENE.txt2026-09-17 00:181517436
CRNH0203-2026-AL_Fairhope_3_NE.txt2026-09-17 00:181517436
CRNH0203-2026-AL_Gadsden_19_N.txt2026-09-17 00:181517436
CRNH0203-2026-AL_Gainesville_2_NE.txt2026-09-17 00:181517436
CRNH0203-2026-AL_Greensboro_2_WNW.txt2026-09-17 00:181517436
CRNH0203-2026-AL_Highland_Home_2_S.txt2026-09-17 00:181517436
CRNH0203-2026-AL_Muscle_Shoals_2_N.txt2026-09-17 00:181517436
CRNH0203-2026-AL_Northport_2_S.txt2026-09-17 00:181517436
CRNH0203-2026-AL_Russellville_4_SSE.txt2026-09-16 21:191516704
CRNH0203-2026-AL_Scottsboro_2_NE.txt2026-09-17 00:181517436
CRNH0203-2026-AL_Selma_13_WNW.txt2026-09-17 00:181517436
CRNH0203-2026-AL_Selma_6_SSE.txt2026-09-17 00:181517436
CRNH0203-2026-AL_Talladega_10_NNE.txt2026-09-17 00:181517436
CRNH0203-2026-AL_Thomasville_2_S.txt2026-09-17 00:181517436
CRNH0203-2026-AL_Troy_2_W.txt2026-09-17 00:181517436
CRNH0203-2026-AL_Valley_Head_1_SSW.txt2026-09-17 00:181517436
And, Texas
CRNH0203-2026-TX_Austin_33_NW.txt2026-09-17 00:181517436
CRNH0203-2026-TX_Bronte_11_NNE.txt2026-09-17 00:181517436
CRNH0203-2026-TX_Edinburg_17_NNE.txt2026-09-16 23:181517436
CRNH0203-2026-TX_Monahans_6_ENE.txt2026-09-17 00:181517436
CRNH0203-2026-TX_Muleshoe_19_S.txt2026-09-17 00:181517680
CRNH0203-2026-TX_Palestine_6_WNW.txt2026-09-17 00:181517680
CRNH0203-2026-TX_Panther_Junction_2_N.txt2026-09-17 00:181517436
CRNH0203-2026-TX_Port_Aransas_32_NNE.txt2026-09-17 00:181517436
To compliment your post:
https://www.ncei.noaa.gov/access/crn/current-observations?group=crn