The UAH Satellite Temperature Record With Volcanic Noise Outliers Filtered Out
A guest post by Steven Goddard
I’ve often wondered what the UAH global temperature record would look like if the cooling effects of the eruptions of El Chichón in April, 1982 and Mount Pinatubo in June, 1991 were removed. Large volcanic eruptions shoot fine ash up to very high altitudes, which makes the upper atmosphere less transparent, allowing less sunlight (SW radiation) to reach the lower atmosphere. This has a noticeable cooling effect on the lower atmosphere and the earth’s surface which can last for years, as can be seen in the figures below. Note how the lower troposphere temperatures were depressed during periods when the atmospheric transmission was also depressed.
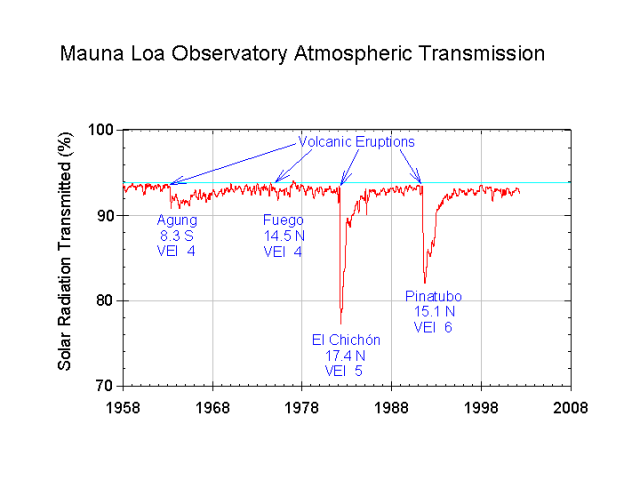
http://upload.wikimedia.org/wikipedia/commons/9/9c/Mauna_Loa_atmospheric_transmission.png
Next let’s look at the UAH satellite record:
http://www.woodfortrees.org/plot/uah/from:1978
Volcanic events are not related to man’s activities, and should not be included when calculating anthropogenic global warming trends.
My experiment was simple enough. I took the UAH monthly data and nulled out the periods of low atmospheric transmission (April 1982-December 1985) and (June 1991-December 1994.) In other words I set those months to zero anomaly. This is a reasonable approach, because zero anomaly is what UAH considers to be the mean temperature for the period. Using Google Spreadsheet’s linest() function, I then calculated the trend. With the volcanoes removed, the global warming trend dropped from 1.3 degrees per century to 1.0 degrees per century.
A far cry from the 6+ degrees at the high end of the IPCC scenarios.
What also becomes apparent from this graph is that recent lower troposphere temperatures have dropped back to near the 1978-1997 baseline. 2008 monthly temperatures averaged slightly lower than 1980 temperatures.
John Christy and I have written a paper that contains some of the answers raised in this thread. Go to
The name of that volcano is “El Chichón” and not “El Chicon”. Please change the title of the post.
REPLY: Fixed, thanks, Anthony
Very nice analysis and graphing. If I am not mistaken, the impact of removal of vulcanism would vary depending on what functions are used in curve fitting and how you pin endpoints. And while you are playing with outliers (my mother always warned me not to), what happens if you remove and patch over the 1998 Super-El Nino as well? Some in the climate change community would argue that events of this order of magnitude are “weather noise”, and if that is the case one might be completely justified in simply replacing them with the trend.
hswiseman,
Good question about the 1998 El Nino. I intentionally avoided that in the article because I didn’t want that to become a point of contention, but the answer to your question is that the trend drops to 0.87C/century if 1998 is removed.
I should defer to David Douglass here, but his link doesn’t seem to be present.
Great post Stephen.
You should try plotting the NIN3.4 SOI Index behind your UAH without volcanic outlyers to show the ENSO strength over the whole satellite record. As you are no doubt aware, both these volcanic periods included El-Ninos. As I recall, the 1982-83 El-Nino was very strong, bigger than that in 1997-98 in terms of its ENSO values and we certainly felt it in Australia with a severe drought. If we accept the proposition that El Ninos lead to globally-warmer temperatures, it seems reasonable to consider that the El Chichon volcanoe masked a temperature spike perhaps larger than that in 1997-98.
From my state of blissful ignorance of all things scientific, I see a logical problem in simply wiping-out the down-and-up temperature phases occurring after a volcanic eruption.
To do so presumes that our cars, farting cows and other modern wickednesses have had no effect on the extent of the down phase. If the down was less severe than it would have been had I not thrown an extra polar bear on the fire, my wicked activities must have had a continuing effect. If that is right, to draw a straight line between the start of the down and the corresponding point of the up would remove an upward force from the trend. Or so it seems to me.
Don’t worry, I’m still on your side, I just don’t find this particular analysis particularly compelling, sorry.
I look forward to having my idiocy exposed, but I don’t care because I voted for the winner.
I am of the view that volcanic eruptions are over rated when it comes to climate forcing. The majority of debris is washed out in the first year and any remaining SO2 doesnt hang around long (ice core records show only a 3 year record of SO2 for Tambora). The major impact on the Wiki chart above in 82 & 91 shows a 1 & 2 year disruption which is substantially less time than the blocked out null area’s on Steven’s chart. The UAH graph shows minor downward trend in 82 and perhaps nothing in 91. I know there is ENSO effects in the background, but how can we be sure exactly what drives minor ups and downs in the record with so many factors in play.
Here’s an interesting link on the subject:
http://www.cru.uea.ac.uk/cru/projects/soap/pubs/papers/wagner_ClimDyn2005.pdf
I don’t know if it’s accurate or not; it seems to want to sweep the entire Dalton Minimum temperature record under the vulcanism rug, but it’s an interesting paper.
I remember flying across from Taiwan to the U.S. not long after the eruption and the plane had to climb to maximum altitude to get over the layer from the eruption. The sky was noticeably brown all the way across the pacific from Taipei to San Francisco.
Here in Pendleton we get cloudless rain from topsoil dust blowing in from the high plains to the West of us. I assume the dust seeds water vapor into water droplets and falls as cloudless rain. Volcano ash would produce similar results but on a grander scale and it would last longer. It is possible that ash could stay in the atmosphere for many months and possibly a few years depending on the size of the eruption, continuing to seed water vapor and I suppose acting as a heat shield thus causing cooling. I would also assume that the affects would be regional, but maybe not global, since ash would not be well-mixed in the atmosphere. Mt St. Helen ash circled the globe more than once, riding on the jet stream. It washed out without much fanfare.
FatBigot — “From my state of blissful ignorance of all things scientific, I see a logical problem in simply wiping-out the down-and-up temperature phases occurring after a volcanic eruption.”
I think you may have missed the purpose of the exercise. Here’s a quick thought experiment: you have a sensor measuring something over time and there’s a glitch in the data at two points 30 minutes apart — a handful of points way up the first time, and a handful slightly down the second. You don’t need to throw out the data. Why? Because after experimenting a bit you realise that the glitches occured when a light switch was flipped.
So… what do you do? You remove the glitch points from the data to see if there’s some sort of trend in the data WITHOUT the glitches.
This is done all the time in real world data collection; sensors will often return data that needs to be averaged somewhat. And sometimes the readings are wierd enough that you declare data from point A to point B is simply an unusable outlier.
What I’m saying here is that there’s precedence for what Goddard did and that what he did is useful. He’s treating the volcanic data just as you would a glitch and then looking at what’s left to see what trend there may be without it.
Is this helpful? If not I’ll shut up.
I find it interesting that volcanoes preceded both warming steps.
Considering SO2 is a cloud nucleation compound is it possible that SO2 volcanoes could strip the Stratosphere of water vapor via precipitation, resulting in subsequent cooling of the stratosphere due to reduced greenhouse/shortwave absorption? (a boom and bust effect)
considering the obvious inverse correlation between stratospheric temp and tropospheric temp, it could it be possible that SO2 volcanoes have a long term warming effect. My guess is the stratosphere regulates convective precipitation, hence humidity and clouds. ie, the stratospheric temp sets the humidity thermostat, and enso forces under negative feedback against the buffering effect of evaporation/precipitation cycle.
By the same logic the climate change community will come back and justify the removal of the MWP and the LIA. If you can remove natural events, then so can they. Over geologic time periods and the natural cooling & warming natural cycles, those events are irrelevant and won’t change anything in the balance of things. One can’t just remove data because this exercise can always be justified… on both sides of the coin.
O.T. http://news.bbc.co.uk/2/hi/science/nature/7827040.stm
“The head of the World Meteorological Organisation has said that global warming does not mean the end of snow.
Secretary-General Michel Jarraud, stressed that Europe’s current harsh winter could not hide the fact of a rise in global temperatures.
He added that this would lead to snow and cold winters becoming more infrequent, but they would not disappear. “
Maybe some confusion could be caused here by Steven’s use of a warming figure in degrees per century. Removing the two volcanos wouldn’t make much difference to the trend since 1900, though it clearly affects the trend since 1979 when satellite records began. What it does do is ‘flatten the curve’ during the last decades of the C20th, and along with the dodgy postwar SST ‘bucket adjustment’ and the positive PDO, we can now understand the exaggerated trend which has led to the over-parameterisation of CO2 by the computer-scientist-turned-climatologist.
Even if MSU temps records seems more reliable than surface stations, there are still problems with temps mesurements :
Paris, last week : -9°C.
850 hpa temp above Paris : 0°C
In french this is called “inversion thermique”. Which was strenghtened with the albedo – snow on the ground.
Next winters could be very cold at the very surface on land, Low. Trop. MSU system would not always be able to “see” it.
Sorry for my awful english-writing.
So, while in the short term eliminating the temperature troughs introduced by volcanic eruptions, other natural drivers such as PDO/ENSO with their associated positive phase peaks remain. I would assume that in another thirty years or so, after these drivers run through their negative phase the result should be an even lower trend line of less than one degree per century.
Complicating all this will be what the long term impact of a quieter sun will be. We do live in interesting times.
“Volcanic events are not related to man’s activities, and should not be included when calculating anthropogenic global warming trends.”
Pardon, but volcanic events are clearly natural, occur on somewhat regular basis and form an integral part of the climate system. Hence any “global warming trend” must include volcanoes. The idea of, at this stage of knowledge, calculate the anthropogenic contribution of the trend is a deluge. At most we can frame it by noting that all major as of yet identified drivers have been positive during this period and hence climate sensitivity is on the low side. I do agree however that the absense of a major volcanoe eruption has contributed to a positive trend over the last 17 years.
RobJM (22:36:41) :
I find it interesting that volcanoes preceded both warming steps.
This statement caught my eye so I went back and read Steven Goddard’s assessment –
I took the UAH monthly data and nulled out the periods of low atmospheric transmission (April 1982-December 1985) and (June 1991-December 1994.) In other words I set those months to zero anomaly. This is a reasonable approach, because zero anomaly is what UAH considers to be the mean temperature for the period. Using Google Spreadsheet’s linest() function, I then calculated the trend.
I am presuming your data are anomalies. If that is the case then the preceding data would have the lower ie ‘volcano’ effect, built in. Was the data after the volcanoes modified eg averaged without the V effect?
What would the picture look like without these extra anomalies?
Excuse my ignorance if this is BS 🙂
BTW congrats Anthony and all involved a wonderful forum/blog.
Why would the global warming trend dropped from 1.3 degrees per century to 1.0 degrees per century, when you REMOVED the effect of volcanoes, which by definition block sunlight (and reduce warming)?
The obvious answer is that your “set to zero anomaly approach” is wrong, because it is blocking out the warming that surrounds the (brief) cooling effect of the volcanoes. First you should only block out 1-2 years of data. Second you should draw a straight line between the start & end of your “block out” – perhaps using the average temperature a year before & a year after to reduce any “cherry picking” bias. Alternatively, it would make far more sense to estimate how much volcanoes reduced global temperure, and then add that on to the temperatures.
I’m afraid that this “article” is an embarrassment to Anthony Watt’s blog, and AGW sceptics in general.
Emmanuel ROBERT (00:15:10) :
Next winters could be very cold at the very surface on land, Low. Trop. MSU system would not always be able to “see” it.
Hmmm. Good points.
Sorry for my awful english-writing.
Your English is fine. I have relatives in Texas that have far worse English. (Ah say, thet thar is faa gooder English then Franky done spoke last yare …)
English is now an international language. No one owns it and no one controls it. It will continue to evolve toward a global patois. There is no equal of Le Academy Frances for the simple reason that no one would know what dialect to declare ‘approved’. How a Scottsman and a Texan communicate is beyond me!
So, IMHO, your English is no different from any other normal dialect of English (and much easier to understand than many.) No Worries, Mate! And no need for apologies. Tout va bien, n’est-ce pas?
(I never could get all the ending vowels right in French… so I’ll stop now.)
Ray (22:52:58) :
By the same logic the climate change community will come back and justify the removal of the MWP and the LIA.
What MWP & LIA?? The World has been uniformly cold for at least the last 1000 years!
Haven’t you people heard of the hockey stick? /sarc off
Dave.
“He’s treating the volcanic data just as you would a glitch and then looking at what’s left to see what trend there may be without it.”
Is this similar to 1960’s Olympic scoring when you throw out the high and low score and average the rest? For you yougins, this was because the judges from East Germany and Russia always scored American competitors low and their own countrymen high. The American judges would do the same to them.
Dave E and Ray
Of course they will come back and say that without the volcanos the temp rise would have been greater. I’m afraid I’m with Chris H on this one Steven.
Chris H.
“Why would the global warming trend dropped from 1.3 degrees per century to 1.0 degrees per century, when you REMOVED the effect of volcanoes, which by definition block sunlight (and reduce warming)?”
If you’ve followed the this website for any amount of time, you’ll remember an article about cooling the past to warm the present. By removing the past cooling, the past is warmer, there by flattening the trend to 1.0 degrees per century from the 1.3 degrees.