Greg Goodman writes in to WUWT tips and notes:
Arctic sea ice minimum – this years 19/20th Sept at 4.594 million sq/km

Source: http://nsidc.org/arcticseaicenews/charctic-interactive-sea-ice-graph/
Not surprising that MSM has gone schtum about the remarkable persistence of their favorite “canary” not being dead yet.
This year’s min is greater then 2007 when AR4 was getting major push in MSM and Al Gore was trying to BS us all with his climate disinformation.
2018.2017,2015 and 2011 are indistinguishable.
2018>2016>2007>>2012.
The alleged ‘death spiral’ and ‘runaway melting’ has been essentially not going anywhere for over a decade now. Why isn’t this great climate news being told to the world?
More in the WUWT sea ice page.
I’ll be honest, the Arctic minimum has become so passe in the era of ever shrill pronouncements about “ice free Arctic”, “Arctic death spiral” etc, I forgot all about it. As a metric for global warming, it certainly hasn’t lived up to predictions from 10 years ago., much less recent ones, such as this one from Peter Wadhams – Anthony
DMI sea ice thickness/volume agrees:
It’s even better than business as usual.
actually its a good metric there is none.
I second that!
It hasn’t shown warming but that is only a disappointment if you do science ordering your results in advance.
Hard to think of a better physically integrating measurement of global climate status, up there with treelines.
Well, ice volume would be a better “integrating measurement ” but that has only been measured properly for a few years. Area/extent gives some indication but is does not have a fixed relation to volume. Having said that ice area is useful in it’s own right since many of the processes which affect the energy budget are surface effects: albedo, outgoing IR losses, conductive losses, evaporation etc. They are probably more important than ice volume in understanding how things work.
I showed a couple of years back that there seems to have been a change in the gradual drift of the ice minimum in 2007, from getting later in the year, to happening earlier. But it requires proper filtering of weather ‘noise’ to reveal it.
https://judithcurry.com/2016/09/18/is-the-arctic-sea-ice-spiral-of-death-dead/
Roger Pielke Sr. even suggested it was worth publishing
https://judithcurry.com/2016/09/18/is-the-arctic-sea-ice-spiral-of-death-dead/#comment-812179
It is ‘passe’ because they make hysterical claims year after year, say it is “the canary in the coal mine of global warming” until the facts no longer fit the agenda. Then they go all quiet about it and focus on Antarctica, or the winter ice max …. or some new climate canary. This leaves the public with the perception that it is still in catastrophic decline.
How many people know that Arctic ice extent is no different now than it was in 2007 when all the screaming the imminent “ice free Arctic” started?
Thanks for posting this.
How was your 2008 different?
How was your 2011 different?
How was your 2015 different?
Arctic ice extent is of no relevance to anyone but dilettantes.
I was just thinking about this yesterday. I’d not heard a peep and had completely forgotten about ice’s demise, so went to look at the resource page here to see if things were just gone. I guess I should just assume all isn’t a disaster since its not in the news now.
Shame we’re down a satellite.
it’s still over 5 Wadhams in extent.
Tom, it took a moment, but that’s a great metric.
Cheers,
Bob
I thought a Wadham was a psychologists scale for measuring hysteria, not ice area.
+50
Arctic temperature stopped rising, the global warming is over, get ready for the NH cooling.
It appears to be true. Over the last decade it’s hard to say there has been any trend in ice coverage, plus or minus. Last winter was warm until the end of February and it’s been pretty average since then. We’ll see what this winter brings. link
Having said the above, the winter temperature north of 80 varies wildly over the whole record.
It’s more accurate to say that Arctic temperature has been regionally variable, with both above- and below-average temperatures.
Virtually ALL of it below freezing the whole time, even when we get huge warm days, it is still well below freezing.
In the middle of the Arctic night in winter, when there is no sunshine at all, the water underneath the ice (upon which the ice floats) at the north pole is not below freezing.
Sure it is. Freezing is 32F, 0C.
Polar ocean water freezes at 28.8F, or -1.8C, or “below freezing” in the common vernacular.
https://nsidc.org/cryosphere/seaice/characteristics/brine_salinity.html
At that temperature, the rate of melting is balanced with the rate of refreezing.
“the water underneath the ice at the north pole is not below freezing.”
That will always be true until the entire Earth’s oceans are frozen to the bottom. A pretty obvious and pointless statement.
According to DMI Arctic temperatures for about a decade have generally run above their 1958-2002 mean during the winter and at or slightly below during the summer. Of course the winter temps even when well above the mean are well below freezing.
.
“…have generally run above their 1958-2002 mean…”
Well, until you put proper error margins on the measurements. Then none of it is statistically changed. What do you think the accuracy of measurements in the 60’s for the Arctic is? 70’s?
As long as i’ve been reading WUWT (which is over 10 years) i’ve been seeing people say that.
LIA didn’t start overnight, it took nearly a century for summer temperatures to establish a definite and unquestionable downward trend.
https://encrypted-tbn0.gstatic.com/images?q=tbn%3AANd9GcQWnqOODjdPb6h1mqPHS8EafAwo9PqscfKsIzXtFGPjhs_6dnYm
http://arcticnorthwestpassage.blogspot.com
This website provides really interesting info from folks actually in the Arctic.
I especially like the Coast Guard info. Very critical for yachts and other boats that may not have an icebreaker leading the way… Apparantly the NW passage is now closed for the season.
Too bad some captains do not take it to heart.
Apparently 1 yacht successfully made it through the Northwest Passage this summer. The passage was officially shut down in last few days by Canadian authorities. Al Gore’s sail to the North Pole will have to wait yet another year. Polar bears are celebrating the annual return of their sea ice hunting grounds. All is well (unless you’re an alarmist).
Dave,
I would think that “all is well” would be good news to many alarmists. There is the assumption that alarmists are driven by the need to be right, rather than genuine fear about the future. That’s just as bad as calling skeptics, “deniers,” with the implication that they will deny the evidence just to be right. I think both statements are true in some cases, but I don’t think it’s correct to generalize.
People are always clamoring for debate. Debate is when people try to prove their own point. The result is that people just become more defensive about their own views regardless of evidence. Wouldn’t it be more productive to have discussions, so that we can learn from one another? (I haven’t been a good example, though my views have changed as a result of discussion here.)
Kristi,
I think it goes beyond just wanting to be right and fearing for the future. The more vociferous alarmists would be devastated if man’s CO2 emissions turned out to be benign because they would need to find another disaster in the making to leverage their political agendas. Skeptics are not primarily about political agendas unless one considers maintaining the status quo a political agenda.
To a dyed in the wool Green, finding out that CO2 was benign and the world wasn’t warming would be as devastating as a member of the Ku Klux Klan finding out that his daughter’s life had just been saved by a ‘gentleman of colour’.
… and that she had subsequently fallen in love and slept with him.
… and that her period was a bit late !
…And his 23 and me DNA showed he had 12.5% African ancestry.
Kristi. Maintaining the status quo,is a political position. Generally termed ‘conservative’.
Your point about debate is interesting. I have never seen it that way but you are correct.
Debate comes from the french word “debattre” which itself comes from “battre” meaning to battle. So , yes, it is more about having a fight than a productive discussion.
No wonder alarmists won’t debate.
In a debate, you both try to prove your point and to disprove your opponents point.
The whole purpose is to convince an audience.
That you think it is impossible to learn from a debate just goes to show how well indoctrinated you have been.
Kristi writes
They have?
Kristi,
I couldn’t agree more on the need for debate. Sadly it’s very rare for real debate in the media. I’m pretty sure that sceptics want debate far more than believers. When there is a proper debate and then one pulls out, it always seems to be the believer who pulls out. I wonder why?
I also strongly agree with your statement about “deniers”. Calling people who don’t agree on the science “climate change deniers” is doubly wrong: not only is it designed to be offensive, it is a complete lie. In fact a major sceptical argument is that the climate is always changing and that the current global warming is well within natural variation.
However, I don’t agree with your other point. For a start, I would think pretty well everyone – believers and sceptics included – are driven by the need to be right. It’s only human. But there’s more. Many believers are greens who don’t like our modern industrial society, despite its vast benefits. Climate change alarmism is a perfect tool for these people. Other tools are the ozone hole and, more recently, ocean plastic. For these people the real catastrophe would be if there were no global warming.
One very nasty driving force behind this is a hatred of humanity. David Attenborough is a perfect example. He has stated that mankind is a plague, and many other environmentalists – with a few notable exceptions such as Willis, Jim Steele and Patrick Moore – agree with him. Sadly I think my brother also thinks mankind is a plague – but he is a Guardian reader.
I utterly loathe this hatred of humanity, which I’m sure no one in this discussion shares. I’m proud to be human, despite all the imperfections. For every Hitler and Stalin there’s a Newton and Einstein. And one of mankind’s greatest achievements is to reverse a dangerous trend over millions of years by making the planet greener due to our CO2 emissions.
Chris
Chris Wright says:
Calling people who don’t agree on the science “climate change deniers” is doubly wrong: not only is it designed to be offensive
It’s not just offensive, it’s a deliberate, calculated bullying technique. It’s a power-play — we can make wrong, even absurd accusations against you, and there’s nothing you can do about it. School-yard bullies do it — “you’re a motherf****er” — and they’re betting you don’t have the courage to challenge them. You see it now in the judge Cavanaugh affair going on right now — you (or someone) abused me (sometime — not sure when) at (not-sure where) some party. It’s a power-challenge — we dare you to try to resist us. Try it, and we’ll show you who’s boss…..
Kristi
Good to hear that alarm for “alarmists” can be conditional.
Just as skepticism by skeptics should also be conditional.
On the science – going where it leads.
Or a seal.
Or a seal 🙂
Do we have numbers yet on Greenland ice mass balance, for the 2017-2018 glaciological year? Did it gain ice this year, like it did last year?
Big time gain. The question is, how long before DMI deletes the 2017-2018 line from their graph like they did with 2016-2017 (but leaves 2011-2012).
https://www.dmi.dk/en/groenland/maalinger/greenland-ice-sheet-surface-mass-budget/
The key thing is that the decline through this season’s melt was remarkably little.
Look up the DMI site.
Northern Hemisphere snow and ice cover remained above its standard deviation band through the 2017 melt season.
And this one that has ended.
Unless you’re going on a protest cruise to get stuck in the ice you say is going away, who really cares how much ice there is ? The guys who pull a sled with provisions 500 miles to the north pole, now that’s interesting. They eat 18, 000 calories or more per day and lose weight!!
Exactly, JimG1. What purpose does so much excessive ice serve, and to whom?
Decades ago I used to enjoy going totally medieval with an ice-axe on large icicles found in remote Scottish gullies. They disappear anyway in spring, and come back next year.
Even then there were a couple of dimwits in the party who thought I was doing something naughty to mother nature.
Agree w/JimG1 & Michael Hart. Little is less interesting than something as changeable as sea-ice. Don’t like how much sea-ice there is right now? Just wait alittle while.
About 50% of the Sea Ice Outlook predictions from August for September mean are below the September minimum.
Climate science at its finest …
https://www.arcus.org/sipn/sea-ice-outlook/2018/august
Yes you have about 50 predictions with a median of 4.57 (quartiles 4.3 and 4.9), with a week to go this month, it is likely to be lower than last year’s value of 4.80 so that seems a reasonable outcome.
MSM are still talking about a low ice Arctic, resulting polar bear deaths (they don’t die from natural causes), “catastrophic” heatwaves, a focus on any unlucky Ship of Fools, and the “first evah” commercial voyage through the Northeast passage, thanks to global warming, nothing at all to do with icebreakers and modern navigational aids.
Polar bears die from getting shot when they try to snack off tourists.
I’m sure that it will pass a minimum very soon, and may have bone so.. But it isn’t conclusive in that graph.
People who support the AGW theory should never use the word conclusive.
JimG1,
Why limit that to supporters of AGW?
Kristi, I find your attempt at bringing folks to a scientific way of thinking, a middle ground so to speak, refreshing if not fool hardy.
Latest historic minimum seems to be 9/22, maybe 9/23 so doesn’t look likely the minimum will go any lower.
Eqinox was the 23rd. Sun is now below the horizon at the N. Pole.
Edge of the Arctic Sea Ice is much further south: About 78-79 degrees north latitude at today’s date and sea ice areas.
Sea ice is near-continuous from there to the pole.
Nick,
The latest date for summer minimum Arctic sea ice in the past 12 years was September 21 in 2010, in which a late, brief remelt occurred. September 17 and 18 are the most common low point dates. The mean for the past 30 years is the 18th.
So, while a lower low is still possible this year, it’s a pretty remote possibility on September 23.
This year, if the melt be over, is the sixth highest of the past 12 years, which have seen three low years, ie 2007, 2012 and 2016, in which August cyclones struck (twice in ’16), and three high years, ie 2009, 2013 and 2014. Last year was highest of the six middling years.
Last year was also the first time since the dedicated satellite era began in 1979 in which a new, lower low was not made within five years. While not conclusive, it appears that Arctic summer sea ice extent turned the corner in the record low year of 2012, and is now growing in its ~60-year natural cycle of waning and waxing, having fallen from 1979 to 2012 (1977 was probably the highest, then the PDO flipped to its warm mode).
When the 30-year baseline moves to 1991-2020, the increase will be more obvious. But the trough is already evident. The past six years have averaged higher than the prior six years, ie 2007-2012. The trend is about flat since 2007. Freak storms might bring a low below 2012, but that’s not very likely.
“The latest date for summer minimum Arctic sea ice…”
Yes. But you shouldn’t announce it until you see it.
We have seen (a very small) increase: Minimum on the 19, followed by ever-increasing sea ice extents on the 20, 21, 22. Not a large increase of course, but an increase nonetheless.
I’m not sure where you get those numbers. I tabulate the results here and plot them here. For NSIDC (as plotted above) it fell by 61 (1000 sq km) on 20th, by 15 on 21st, and rose by 3 on 22nd. JAXA reduced 27 on 20th, 16 on 21st and rose 28 on 22nd. Not a convincing turning of the corner.
Thanks for your rendition of the death spiral Nick. Helpful to see that it is not longer a spiral.
Estimations of ice extent seem to vary quite widely with the NSIDC graphs being the least wobbly due to it being a trailing 5day runny mean.
In the article I linked at the top, I found that you need a 14 day gaussian filter before you get single, unique change of direction around the minima for all years in the data.
All the arguments about exactly which day of the year was the minimum is pretty silly and is dominated by weather not climate. My article showed a fundamental change in direction in 2007, ironically the year most of the planet become aware of the issue.
I should be able to do the same calculation for this year in early November. We will see at that point whether this year is notably bucking that trend. It look like it may well do.
How does a leap year figure in this discussion?
@Churning: insignificant quantisation noise IMO.
There was a small blip downwards for the 23rd.
And today (looking at the 23 Sept reported Arctic Sea Ice Extents) we confirm that 23 Sept is back down to the same minimum as 19 Sept. Oh well. Warned you that the Arctic does not follow mann’s rules, nor mann’s assumptions.
Churning September 24, 2018 at 8:57 am
NOAA numbers the days of the year. They don’t really factor in the extra day at all, since it only means the upturn would occur a numbered day later than in a normal year, say on Day 263 rather than 262.
So, it looks now like there was a double bottom, the second one being the 23rd. If we stay above 4.594 million from here on out, that should be the official turn-around date.
Is there a definition for “see it”?
According to today’s climate science, unless you “see it” in the output of a computer model, it hasn’t really happened.
Nick, “But you shouldn’t announce it until you see it.”
Like the date when children will no longer know what snow is?
Or the date when the North Pole is ice free?
Or when rising waters start to cover the Statue of Liberty?
Or when a group of Pacific Islands is submerged?
Or when the oceans turn acid?
And so ad infinitum …
Geoff.
But it is okay to say how massively the planet will warm in 100 years ?
Today, 23 Sept, marks the fourth day after the lowest NSIDC record. The “gain” however since the low point is very, very small – so the Arctic could still surprise everyone and turn down again.
However, 2018 Arctic sea ice extents remains greater than (or equal to) 8 of the past 12 year’s daily September sea ice extents: Since 2006, only 2008, 2013, and 2014 are demonstrably greater than 2018 over the first three weeks of September’s low point. This makes my earlier point: There is absoutely NO evidence that the long-term trend of Arctic sea ice extent is a simple straight-line extrapolated into some distance future 0.0!
Rather, the entire 39 year curve since valid measurements began in summer 1978 is the typical climate oscillation between a broad Arctic sea ice high in 1982-1984, followed by an accelerating decline between 1985 and 2006, then a broad low point from 2007 to 2018 that we are just now beginning to rebound from.
The current sea ice area is still two standard deviations below the 1981-2010 average. That makes 9 of the past 12 minimums ALL two standard deviations below the 30 year average.
..
This evidence that the long-term trend of Arctic sea ice extent is in decline.
…
That is unless Mr. RACook, you don’t understand the meaning of “two standard deviations.”
Keith,
In the third decade of the waning phase of the natural ~60-year trough to trough or peak to peak Arctic sea ice cycle, that’s just what one should expect to see.
But the trough appears to have bottomed out in 2012, such that we now seem to be six years into the waxing phase of the cycle.
When the new 30-year baseline begins in 2021, ice in those years should be well into its 2 SD range. Before then, we might even get back into the old normal, as happened in 2009, 2013 and 2014. The latter two years benefited from all the heat lost from the large area of open water in 2012. So I’m not predicting 2019 and 2020 comparable to 2013 and 2014, but it’s possible.
In any case, the trend since the record low year of 2012 is up, and flat since 2007, so it’s justifiable to say that the trend in Arctic sea ice from 1979-2012 seems to have reversed.
Please bear in mind too that the trend in Antarctic sea ice from 1979-2014 was growth, so CO2 can be ruled out as a cause of Arctic sea ice decline. The PDO flip of 1977 seems a likelier explanation, with the NAO as well.
No one is debating that arctic ice extent has been lower in the last few years. The debate is will the decline continue or will it begin to rise or just stay flat. The AGW proponents, who maintain that CO2 is the climate thermostat, predict it will continue to decline. Currently, that is not happening. Thus, it suggests that rising CO2 does not produce necessarily a decline in arctic ice extent. If arctic ice extent begins to rise, then the CO2 connection to arctic ice extent will be called into serious doubt.
Tillman says: “In the third decade of the waning phase of the natural ~60-year trough to trough or peak to peak Arctic sea ice cycle”
…
Sorry Tillman, we don’t have 60 years worth of satellite data, so you cannot determine if a 60 year cycle exists. Please don’t claim otherwise, least you try to “splice” non-satellite data to the existing measurments.
Keith Sketchley September 23, 2018 at 1:42 pm
We don’t need 60 years of satellite data to know that Arctic sea ice fluctuates in a 60 year cycle, linked to the Pacific and Atlantic oscillations.
We have historical documents, archaeology, sediment records, other proxies and maps to go on. We know for instance that Arctic sea ice waned in the 1920s and ’30s, as in the 1990s and 2000s. The Northern Sea Route was open in the 1930s and during WWII, as it is now. Then in the ’50s, ’60s and ’70s, it was usually closed, which is why the USSR built nuclear icebreakers.
Keith, rational people don’t assume that the world started 30 years ago.
Has arctic ice declined from the highest point in the last 100 years?
Yes
So what?
Keith, rational people realize that satellite observations did not start the day we put up a satellite capable of continuous measurement.
Rational people also realize that satellites aren’t the only means by which information regarding the arctic can be gathered.
Tillman says: “We have historical documents, archaeology, sediment records, other proxies and maps to go on.” I guess you didn’t read what I said, so, I’ll repeat it: “least you try to “splice” non-satellite data to the existing measurments.”
..
All those other “records” cannot be compared to satellite data.
…
MarkW says: “satellites aren’t the only means by which information”….which of course is true, but you cannot compare apples to oranges. Non-satellite data is not comparable to the coverage we get with polar orbit birds. You are making the same mistake Tillman is making.
..
You guys are seriously funny, because you complain about Mann’s hockey stick grafting the modern day instrument record to the tree ring data. You’re doing the same thing he did.
Doing a graph using two different sources of data is honest, if and only if one shows the join, and let the other source continue on. In the case of arctic ice, we have several satellite sources, spotty from the early 1960’s, better in the early 1970’s, and fairly continuous from 1978. We also have much less adequate data on sea ice extent from ship and aircraft reports.
What Mann did that was disingenuous was combine two sources, and neither show the join, or reveal the earlier source data diverged after the join.
Wrong Halla, Satellite data can’t be “joined” to data sets that don’t have the same coverage, or the same sampling intervals. PS…Mann described in intricate detail what he did.
But using 1979 as the start date, which is probably the high point in ice coverage for the century, is quite deceptive.
What I meant was graphing the various sources so they are directly comparable, and noting the separate sources, and keeping the graphed lines separate. There was no line on Mann’s hockey stick noting that the tree ring proxies diverged during the later “blade” portion, especially as it indicated a decline.
Keith Sketchley September 23, 2018 at 6:38 pm
There is no splicing involved. We’re not drawing a graph. We’re comparing where the sea ice edge was in different places at different times.
Satellite observations is one way of discovering where the edge is, but it’s inferior to flying over the ice or following its edge in a ship. Early satellite observations had to be checked on the actual ice. The satellites couldn’t tell a meltwater pond on the ice from open sea. Their analytic software estimates where there is 15% ice coverage. It’s inexact, but has been improved by “ground” truth investigations.
There is no reason not to compare historical maps of sea ice extent with satellite observations. The maps clearly show that areas open now were open in the 1930s, for example, which were closed in the early ’70s.
Past sea ice cycles are evident in marine cores and other paleoproxies. It’s absurd to imagine that sea ice didn’t wax and wane before 1979. Scientists know that it did. What has happened since 1979 is not the least bit out of the ordinary.
Climate covers 4.5 billion years. Its change has been from an ocean of molten lava covering Earth to an ocean of ice, and everything in between.
For most of the Holocene, Arctic sea ice has been lower than now.
Tillman says: “There is no splicing involved. We’re not drawing a graph”
…
If you don’t do that, how on earth do you know that Arctic ice extent follows a 60 year cycle?
…
You’re making my point for me. We don’t have 60 years worth of data to be able to discern a “cycle.”
Keith Sketchley September 23, 2018 at 6:56 pm
Maps do have the same coverage, in that they are of the whole Arctic. The North Pole wasn’t continuously sampled throughout the 20th century, but the sea ice edge was, and in prior centuries as well for much of the Arctic.
So of course we can compare the past with the present. My prediction is that, based upon millennia (at least) of history, Arctic sea ice will wax in coming decades. Is yours, based upon extrapolation from the past three decades alone, that it will wane indefinitely into the future, until the Arctic Ocean is ice free in summer?
Keith Sketchley September 23, 2018 at 7:01 pm
No, you’re not getting my point, which is that we have centuries of useful, relevant observations with which to compare satellite observations.
As noted, we know that Arctic sea ice extent was roughly the same in the early 20th century as now. Different data sets of the same phenomena are compared all the time.
Tillman thinks “maps have the same coverage.”
..
They don’t, because a satellite returns every 90 minutes on it’s subsequent orbit. The coverage between it’s dataq collection and your “maps” isn’t anywhere near the same. That is why you cannot SPLICE non-satellite data with satellite data. The sampling interval and coverage makes the data sets incomparable.
You might have reading comprehension problems. Tillman noted precisely the opposite.
Keith Sketchley September 23, 2018 at 7:09 pm
Maps and satellites cover the same area, ie the Arctic Ocean and neighboring seas.
As I noted, the interior of the sea ice is not as well sampled before the satellite era, but what matters is the ice edge. The satellite data have been analyzed to show the 30-year average boundary of 15% ice. Sea ice maps did the same thing.
Thus the coverages are comparable. It has been known for at least a century that Arctic sea ice waxes and wanes cyclically. You don’t need satellites to observe this fact. Just surface and aerial observations for centuries, and paleo proxy data from before sailing ships making observations visited the Arctic.
We also have oral traditions of Arctic peoples for the time before European exploration and exploitation of resources there.
Tom Halla September 23, 2018 at 7:13 pm
Yes, I’d have thought the distinction between splicing and comparing to be obvious.
When you compare the same stretch of Arctic coastline in 1909, 1919, 1929, 1939, 1949, 1959, 1969, 1979, 1989, 1999 and 2009 in the various data sets available, a pattern emerges. This pattern can be confirmed by comparison with observations from previous centuries, which might not be as complete, but still are valid for comparative purposes.
Keith Sketchley,
I glad we afforded you with some merriment and that you found our attempts to educate you “seriously funny.” The feeling is mutual, as I find your seriousness funny.
Hopefully others have explained to you what was wrong with Mann’s splicing of proxies with measured data. His errors were exposed long ago.
Proxies are not measured data, but are very useful when it comes to refuting claims that the extents of sea-ice in the past were greater than they actually were. For example, the simple fact a wind-powered sailing ship took a certain route is proof there was open water along such a route, for even an inch of sea-ice could stop such ships.
You seem to fail to recognize how long contributors to this site have been studying the subject of past sea-ice extents, nor how many proxies are available. This is sad, for you have no idea how much you are missing. The amazing adventures of sailing ships in the arctic is a world unto itself, full of adventure, madness, greed, foolishness, and amazing tales of grit and survival. It is quite by accident that those past sailors teach us where the open water lay, and where the drifting sea-ice lay.
And that only suggests the southern edge of the ice. Satellites teach us there can be areas of open water to the north that sailors could not have reached. Many graphs of pre-satellite sea-ice extent are created using the assumption such areas of open water are a new thing, and infill the arctic with solid sea-ice from coast to coast, when there there is no reason to be certain this was the case. When such graphs employ this assumption for the time before 1979 we have photographic proof they assume incorrectly, for patches of open water are shown by photographs from submarines, airplanes, bases on “ice islands” on the surface, and even from the earlier satellites, including the earliest Nimbus Satellite pictures that go back to the 1960’s.
The above picture was posted on this site over four years ago, on September 4, 2014, and drew 90 comments. It is only one of hundreds of posts that have appeared on WUWT in the past 12 years, covering sea-ice in amazing detail.
The proxies discussed have included driftwood from Siberian trees found on North American shores, archaeological digs from 4000-year-old sites in Northern Greenland where no one lives now, cores from icecaps, lake bottoms, tundra and the seabed, and wave-washed arctic beaches preserved by isosatatic rebound, to mention a few.
I repeat, you do not know what you are missing. You face a choice: Some find bliss in learning, but, for others, ignorance is bliss.
John Tillman September 23, 2018 at 5:10 pm
We have historical documents, archaeology, sediment records, other proxies and maps to go on. We know for instance that Arctic sea ice waned in the 1920s and ’30s, as in the 1990s and 2000s.
Actually we know that Wrangell Island was mostly inaccessible due to sea ice in the 20’s, so on the pacific side sea ice waxed not waned.
Tom Halla September 23, 2018 at 7:07 pm
What I meant was graphing the various sources so they are directly comparable, and noting the separate sources, and keeping the graphed lines separate. There was no line on Mann’s hockey stick noting that the tree ring proxies diverged during the later “blade” portion, especially as it indicated a decline.
Mann showed the proxy data and the measured temperature as separate graphs, one solid lines and the other as dashed lines and clearly described as such. The ‘decline’ was nothing to do with Mann it was related to Briffa’s tree ring data referred to by Phil Jones.
Keith, rational people don’t have to lie about what others have said.
The big complaint about Mann’s hockey stick is that he is using proxies that have nothing to do with temperature. The other is sticking a high frequency temperature chart onto a low frequency proxy chart and then declaring that you have proven that a high frequency rise is proven to be unprecedented.
If you want to argue honestly, you can learn a lot a here.
If you just want to spout tired dogma and propaganda you will just prove that you have no interest in actually learning.
Phil,
The sea-ice has both waxed and waned north of Russia. I think it was waxing in the 1920’s but waning in the 1930’s. As I recall the Russian northest passage was open in the late 1930’s.
Regarding Wangel Island, pay close attention to dates when you consider how ice-bound it is. The ice can be piled up on its coasts right into June, and then swept away by September.
Here’s some Wrangle Island Trivia: It was ice-bound in 1879, when the USS Jeanette got trapped in ice and drifted by, in sight of its shores. By 1881 it was ice-free and two ships searching for the Jeanette, the USS Rogers and the USRC Corwin, were at seperate times able to land on Wrangel. The Corwin landed in mid August, and included the naturalist John Muir, who wrote about Wrangel Island in some detail in “Cruise Of The Corwin.”
The ice was there in 1879 and not there in 1881. The ice comes, and the ice goes. It waxes and it wanes. This proves both Alarmists and Skeptics are both correct. Yippie! We can all be friends, and cats can get along with dogs.
Keith Sketchley
Only if you assume that the 1980-2010 Arctic sea ice extents average daily value is a valid metric.
What evidence do you have that the 1980-2010, 1990-2020, 1985-2015 – or any other 30 year average for Arctic sea ice average daily extents is a constant? Your claim is valid ONLY if that 30 year daily average is actually correct. (Now, I do understand that “climate science” defines climate as a 30 year average. But then again, the official “climate science” has made very few other claims that are correct either.
NO other climate value remains constant over time – most are now known to be oscillating at different periodicities with different 30 – 70 year cycles.
Phil. September 24, 2018 at 7:38 am
In much of the Arctic, ice was waxing noticeably:
https://realclimatescience.com/2017/02/more-arctic-ice-than-1922/
As you may know, the famous 1922 article on disappearing Arctic sea ice and seals, and appearing southern fish species, was also featured on WUWT some years ago.
Actually “valid” satellite measurements began in 1973 but the 1979 peak arctic ice provided a more dramatic picture so it was convenient to hide the incline prior to 1979. See the 1990 IPCC FAR.
Robert,
There are also intermittent satellite observations from the ’60s.
Nimbus 5 (1973) was the first satellite with a passive microwave radiometer that could “see through” clouds, to measure ice extent.
This is from IPCC First Assessment Report, pp.224-225 (I added the red circles); data starts in 1973 (Nimbus 5):
http://sealevel.info/ipcc_far_pp224-225_sea_ice2_1979circled.png
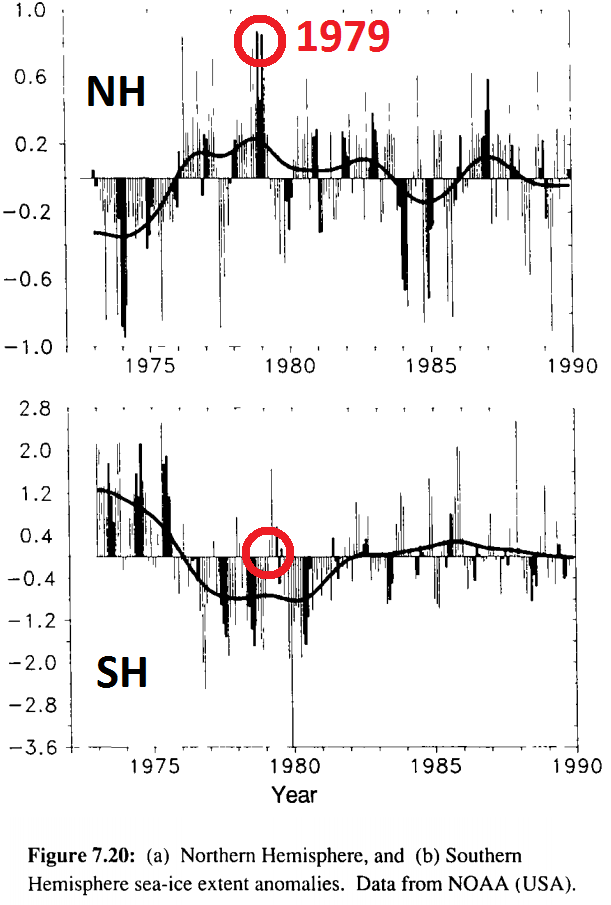
Starting with the Third Assessment Report, the IPCC’s Reports start their sea ice graphs with 1979 (Nimbus 7).
Now, as it happens, the Nimbus 7 multi-channel passive microwave radiometer was superior to the Nimbus 5 single-channel instrument, so I assume that if you asked the IPCC authors why they ceased showing pre-1979 data that’s what they would tell you. But it is awfully convenient for supporting the CAGW narrative.
John,
What “trough”? I don’t see any trough. I see inter-annual variation, similar to what was seen in the late ’80s-mid ’90s, after which there was a definite trend downwards. If the downward trend were reversing, why would the last three years have less sea ice than the two years before that?
The trend is not “flat” since 2007. There is no “trend” there. Too much variability and too few data to say anything meaningful about a trend.
Interesting the things people see in graphs, and the predictions they make.
Maybe it’s a Pause / Hiatus / Plateau?! (Ducks.)
Yes, if Kristi took out the ‘ inter-annual variation’ he would be left with a flat record from 2007 to 2018. So I suppose he will have to go for ‘ inter-decadal variation’ .
Kristi,
It’s plain as day.
Arctic sea ice has made a triple bottom, with the third higher than the lowest. That’s classic bottoming behavior in market analysis and in climatic cycles.
As in previous cycles, Arctic sea ice fell for two decades, and now has flattened out. It has quit declining. As noted, it hasn’t made a new, lower low for six years now. The odds of that happening were it still waning are slim. From 1979 to 2012, the longest minimal extent ever went without a lower low was five years.
If Arctic sea ice was a stock, now would be a good time to buy. 😉
Greg,
A technical trader would have bought in 2007, sold in 2009, bought even more in 2012, sold in 2013 or ’14, then bought again in 2016, perhaps to hold, a triple bottom being solidly made, the opposite of a head and shoulders sell signal.
Trough?
For 12 years of the 38 year satellite record, there has not only NO DECLINE in Arctic Sea Ice minimums through the month of September, but an increase in sea ice extents minimum.
Further, for the first 6 years of the 38 year record, the Arctic Sea Ice extents shows no decline either – though at a demonstrably higher average daily measurement than 2007-2018.
When first part of your measured data shows no decline (the sea ice was at the peak of its cycle in 1982-1983), and the last 1/3 of your data shows a steady state of the measured data (2007-2018 across the low point of its cycle) , you cannot pretend there has been a steady-state, linear decline.
Is there a physical reason why we should expect Arctic ice minimum at the Autumnal Equinox?
Simply put, it is (sort of) a coincidence. But realistically, Dr Judith Curry noted in her 1998 SHEBA year-long on-ice experiment that she found skim ice formed overnight on melt ponds around the camp as early as 12 August. Each night thereafter, the skim ice re-formed thicker, but melted out each afternoon.
Thus you know absolutely that on 12 August the amount of energy lost overnight to the cold sky was greater than the solar energy absorbed each day.
More generally, the inflection point each mid-summer in sea ice area (and extents) occurs when the rate of decline (melting) reaches its maximum and begins to decrease. The minimum point in September is reached when the rate of “area melted out each day” = “area newly frozen each day”. So “new ice” is freezing all during that middle period between mid-August and mid-Sept each year, it’s just that slightly less ice melts each day. And, at some point between the ever-increasing darkness of mid-August and the permanent darkness of the Arctic winter, the two (melting and storm loss and freezing) equal out.
Since the edge of the Arctic sea ice in mid-Sept is about latitude 78-79 north, there is always a little bit of light until mid-October on the sea ice. Light. But not much heat energy.
The autumn equinox has real and fast acting energy balance implications for the high latitudes. TheMagicMolecule™ simply can’t overcome a rapidly changing diurnal energy shortfall.
Joel
Plus 10.
The equinox changes the pressure balance between the hemispheres and circulation patterns. The current sustained Arctic SIE low, look at El nino 3.4, just had minor peak coinciding and now falling ? etc, etc.
Very little above 60N affects Arctic SIE.
Regards
Arctic sea ice is behaving exactly as one would expect.
The AMO is hovering near its maximum and has been for about a decade.. no more recovery from the late 1970s peak.
North Atlantic is cooling, AMO is starting to dip down
Heading into a growth spiral over the next couple of decades.
Nick
What’s the point of your comment?
You are turning into Mosh, drive by pointless comments.
Nick,
Yesterday, according to NSDIC, Arctic sea ice did indeed remelt a tiny bit, but only tied its Sept 19 low, not yet beating it. We’ll see what happened in the north today. If the rethaw has continued, then we might have a new record late minimum date.
Well not much in the headings is correct
Minimum for the year is 4457252
Only last 2 readings suggests an up upturn 22nd/23rd sept
What is odd this year is how extended the melt is – 9 days beyond the average.
Ghalf,
The Japanese data differ a little from the US, but yes, the upturn is unusually late.
Edit turn to turned in the title
I’m with Nick on this. Should edit “has” to “about to”. Would want to see ice extent increase before claiming it has turned the corner.
Kind of nit picky though. Clearly the apocalypse has been postponed.
What does “increase” mean to you, given that it has increased in small amounts since 9/18 for three straight days?
I was only going by the chart where it appears to have reached its minimum but the slight increases are not apparent. I didn’t see tabular data.
FYI – If you click through to the interactive graph hovering over the graph shows individual values for each day.
16, 4.616:
17, 4.601:
18, 4.596:
19, 4.594:
20, 4.598:
21, 4.600:
22, 4.601:
23, 4.594:
24, 4.595
So, so far in the dataset used in the header we have a very flat trajectory with a double minimum, 4.594 on the 19th and 23rd.
[Changed list to table format. .mod]
[Changed list to table format. .mod]
Thanks.
climatebeagle
The correct answer to your question, and that implied by other comments, is that the sea ice can be said to have increased in extent when the null hypothesis (not that it has decreased, but rather, that is has not increased) can be stated with an acceptable degree of certainty: for example 95% confidence, or 99%, or 99.9%. [Gavin Schmidt’s accepting a confidence of 38% for a temperature record is unacceptable in my world.]
How this calculation is done is straight out of the textbook on uncertainty. It is not up for debate how to do it, it is only debatable how much confidence one wishes to sustain the claim that “it has turned”.
Suppose there is 95% confidence that the measurement supports a claim sea ice coverage has started to increase. This does not rule out the possibility that it might decrease again the coming week. So what? That will always be true – anything might happen, however we are not trying to forecast what might happen, we are reporting the measurement, its uncertainty, and an expression of confidence that it has increased. It might increase in July, for a while. That doesn’t rule out that it might decrease again, which would be an observation.
This reporting is a “mechanical” process – not dependent on the observer nor their opinions. It is a set of measurements, the inherent uncertainty of those measurements, and the mathematical processing using well-known formulae to produce an output. The output speaks for itself and is not dependent on the opinion of the technician processing the results.
Nick and Rich,
Arctic sea ice grew yesterday and the day before (although not by much), so it appears actually to have turned the corner. If it were to start melting again, that would produce a record late minimum date.
So it’s not about to turn the corner. It appears as if it indeed has done so, barring a most unusual event. Should that happen, though, at worst it would move this year to 7th rather than sixth highest since 2007.
Yes ok. As I said it’s a nit pick either way. We don’t have an ice-free Arctic six years after the record low extent. It should have been a vast orange grove by now if you had believed Al Gore.
I do my best to credit Nick when he seems to get something right. That has led me astray 🙂
Ahhh … another irrational AGW annual claim of impending disaster refuted by reality!
Only last night, on TVNZ Sunday programme, there was an item on polar bears being a danger to the residents of Churchill. Due to global warming, the sea ice had melted and the poor bears could not get to their favourite menu of seal meat. No mention of above-average ice area, huge increase in the number of polar bears, and removal of hunting permits. Government sponsored lies yet again from a state broadcasting “service”.
And all the bears appeared remarkably plump and healthy!
Winter is approaching.
EOSDIS Arcticview 22Sep18
Norway, Iceland, Greenland & Canada 22Sep18
Windy.com Current Situation
Saharan dust leaving west Africa 09-22Sep18 and closing down the Cape Verde hurricane factory (for now).
Winter in coming
So much for the Goracle predictions once again .
How can this dip shit even show his face in public .
Is there a good visualization of wind conditions to associate with the extent data?
Suggest Ventusky:
https://www.ventusky.com/?p=20;-87;1&l=wind-10m
The Alarmists really needed for the Arctic sea ice to continue to decline, for two reasons. First, melting ice is visual, and for the simple-minded and brainwashed Greenie hordes, melting ice is “proof” of global warming. But if they bothered to do even just a smidgen of research, they would know that ice melts for a number of reasons, and Arctic ice has ebbed and flowed plenty the last century. Second, there are the polar bears, which they latched onto as an icon, supposedly “threatened” by the “melting ice”. So we had things like the Plane Stupid ad showing polar bears raining from the sky, the idea being that, every time you went on a plane, you were essentially “murdering” polar bears. Oh, but what has happened? They’ve given up on the Polar Bear angle. Didn’t really pan out for them. Too bad, so sad. They’ve tried latching onto other animals, like seals, with not much success. We are watching the death of a movement which has infested governments, out for a money grab, and power. Mother Nature, it seems, doesn’t care a whit about man’s foolish ideas. In fact, I think I hear her laughing right now. Stupid Man, thinking that he can control climate.
Russia has over 40 ice breakers. The Canadian Coastguard has 8 with 4 more planned & the Royal Canadian Navy is planning to acquire up to 8 Harry DeWolf-class offshore patrol vessels (Polar Class 5 “slushbreakers”).
The Venta Maersk left Busan, South Korea on 28th August, passed through the Bering Strait, turned left & travelled along the Siberian coast. A nuclear powered ice breaker accompanied the Danish container ship through the East Siberian Sea. Both ships entered the Laptev Sea, whereupon the icebreaker headed for Murmansk. On 22nd September, the Venta Maresk docked in Bremerhaven & departed this morning towards St. Petersburg. The Northern Sea route makes good financial sense, but voyaging west to east via the North East Passage is just not viable at any time of the year.
https://www.marinetraffic.com/en/ais/home/shipid:5568438/zoom:10
The Northern Sea route makes good financial sense, but voyaging west to east via the North East Passage is just not viable at any time of the year.
Do you mean North West Passage here?
Sorry.
http://masie_web.apps.nsidc.org/pub/DATASETS/NOAA/G02186/plots/4km/r09_Canadian_Archipelago_ts_4km.png
I looked at the 2015 article that was referenced and noticed the claim that arctic ice regulates global temperature by reflecting sunlight whereas open sea would absorb more solar energy.
That doesn’t make sense to me. The amount of incident radiation has to be very small at the north pole even at the height of summer. Radiative loss to space must be significantly greater than solar gain. The amount of cooling from open seawater would seem to be greater than from an ice surface due to convection in the water. Cooled water sinks so the surface temperature doesn’t drop much. Ice will cool and not sink. Radiative cooling is a function of the 4th power of temperature, so heat loss from colder ice will be less than heat loss from warmer surface water. Despite lower albedo I doubt that the energy balance changes much, and may be overwhelmed by additional radiative cooling. In effect, ice will insulate the ocean preventing heat loss from the ocean more than its higher albedo prevents warming from a very weak insolation.
I would think that rather than being a positive feedback accelerating melting, open ocean water would radiate heat away faster, providing a negative feedback countering melting.
Am I off base on this?
Rich Davis – I don’t know for sure whether you’re “off base”, but here are some ideas (and please check my numbers because some are from memory):
– In mid N summer, the sun is at lat 23, the Arctic circle is at lat 66, so the sun is at angle 43. That’s the same as say Marseilles at equinox. Plenty of sun.
– Ice reflects virtually all sunshine. The sea much less. So it does reduce the amount of energy entering.
– All sustances radiate, and sea ice in the Arctic is not at a very different temperature in Kelvin to open sea surface, even at the 4th power. So sea ice doesn’t reduce outward radiation by much.
– So far, it looks like you are indeed “off base”. But I haven’t addressed evaporation, and that is surely reduced by sea ice. And that might change the equation – a bit?? a lot??
– in summary: I don’t know, but I suspect that sea ice really does reduce Earth’s energy intake.
Ice albedo is more like 0.6, which is not even close to reflecting virtually all sunshine, but that’s a nitpick on my part. I am not questioning that ice absorbs less solar energy than the open ocean. I am saying that the energy flux at the poles is always a large net loss of heat. I’m suspecting that the solar flux is much less than the radiative loss, even taking into account 10x higher absorption. Regardless of the surface conditions, any solar gain merely reduces the amount of heat loss to space. The majority of the heat lost to space comes from the ocean currents, originally absorbed at low latitudes.
It’s very clear that a melting glacier at a lower latitude will have a positive feedback from albedo, for example when there was ice over present-day New York City. That’s a very different scenario.
Also, the Arctic Circle (66.5N) at the summer solstice is a much different thing from 90N virtually all year long. I guess that sunlight comes in at a 23.5-degree angle on the summer solstice and is at a lower angle all other days (and of course there is no insolation at all for 6 months). So agree to disagree on the effect from June through August or around the edges of the Arctic Circle. How about the situation from September to March? Which will radiate more heat, ice or open ocean?
Common mistake at latitude 66 midsumer sun is 90-66+23 deg high. It is 47.
I owe you (everybody!) a more complete explanation, but – simply put – there is NO Arctic sea ice at latitude 66 north. Through the entire “summer” all of the Arctic sea can be fitted into a circular “beanie cap” centered on the north pole. (The true center varies every year, but is displaced about 500 km southwest towards the north Alaskan coast. The open water is closest to the pole towards Iceland to the southeast.)
At sea ice maximum, there are only 4 limited areas of arctic sea ice further south: These are all concentrated around latitude 60 north. These four areas (Sea of Okhotsk, Bering Sea, Hudson Bay, and Gulf of St Lawrence) combine to a very small area compared to the central Arctic sea ice above the Arctic Ocean itself. Further, by 1 July, all have melted away to less than 1% of their maximum areas!
At maximum sea ice area in late March, the Arctic sea ice area extends no further south than 71 north latitude, retreating through the summer to a minimum sea ice area of 4.0 Mkm^2 in mid-September. At 4.0 Mkm^2 at sea ice minimum, the southern edge of the Arctic sea ice average 78 north latitude.
By today’s late-September sea ice minimum, even the southern edge of the sea ice receives less than 200 watts-hours. Total.
Now, during the middle of the summer, yes! The open Arctic Ocean does receive measureable additional solar radiation if the sea ice has melted out. However, in mid-July the actual Arctic sea ice albedo is much less than 0.60. 0.45 was measured by Dr Curry in the SHEBA experiments in 1998 – it is almost certainly far dirtier than that now.
The much-hyped Arctic Death Spiral is opposite: Over the course of an entire year, more heat is lost from the newly open Arctic Ocean than is absorbed through the fleeting days of summer. Less sea ice = A cooler Arctic Ocean.
RA,
In the Sea of Okhotsk, ice can reach as far south as Latitude 45 N in winter, but of course that’s not technically “Arctic”.
Well, that “definition” of “Arctic” is exactly why we really need to consider the Central (Arctic Ocean) sea ice separately from that little bit of “Arctic Sea Ice” further south. I grouped the four regional sea ice measurements together: The Sea of Okhotsk sea ice does briefly “touch” the east coast of Sakahalin Island and the north coast of Japan’s Hokkaido Island in Feb and March each year, but this small area of 75,000-90,000 km^2 of sea ice has 90% melted away by the first weeks of April.
In any case, compared to the total Okhotsk sea ice area of 850,000, these brief weeks of sea ice in Feb-March are less than 10% of the region’s maximum. The majority of the Sea of Okhotsk sea ice is up across the north half of the total Sea of Othotsk – so the average sea ice is up at 59-60 north.
The four sea ice regions (Sea of Othotsk, Bering Sea, Hudson Bay, and Gulf of St Lawrence (its small area is at 50 north) are included in the NSIDC’s “arctic sea ice” daily measurements. You have to manually get each day’s regional sea ice spreadsheet to track the southern sea ice separately. These four regions receive very, very different sunlight totals each year from the greater Arctic Ocean sea ice mass. After 1 July, there is virtually no sea ice in these four regions, so they do not affect the summer totals nor the fall minimum sea ice extent.
The four sea ice regions (Sea of Othotsk, Bering Sea, Hudson Bay, and Gulf of St Lawrence (its small area is at 50 north) are included in the NSIDC’s “arctic sea ice” daily measurements. You have to manually get each day’s regional sea ice spreadsheet to track the southern sea ice separately. These four regions receive very, very different sunlight totals each year from the greater Arctic Ocean sea ice mass. After 1 July, there is virtually no sea ice in these four regions, so they do not affect the summer totals nor the fall minimum sea ice extent.
The Bering Sea was abnormally low this winter, being gone by May. As well the normal deep cold water, the ‘cool pool’, in the north Bering had gone this year. If this persists this winter it may mark a ‘sea change’ may have occurred in the flow from the Pacific. The slowness to turn the corner could be due to accumulating warmer water there.
Phil.
Not true.
In fact, for the first time ever, the Bering Sea did NOT melt out completely this year.
(More precisely)
– For the third year in a row (2016, 2017, 2018) the Bering Sea did not melt out completely in August.
– For the first year ever, the Bering Sea did not melt out completely in Sept – though we do have a few days left for “0.0” to be recorded. The Bering Sea, Sea of Okhotsk and Hudson Bay are all now slightly above their previous minimum values, and may continue to increase. Be aware of course, that there is very little sea ice in both Sea of Okhotsk and Bering Sea down at latitude 60, but EVERY previous year before 2016, 2017, and 2018 did have 0.0 measurements.
Note that the NSIDC erased the August 2016 and 2017 measurements for the Bering Sea Ice and Sea of Okhotsk on some day between 13 July and 23 July, replacing the previous values with 0.0 values. That same “update” ADDED sea ice area to the previous values recorded for the period 1 Jan to 15 June, SUBTRACTED sea ice area from the previous values for dates between 15 June and 01 Oct, and ADDED sea ice area for dates 01 Oct to 312 Dec for both years. Daily differences were NOT consistant, were NOT applied on all days, and did NOT follow any consistent pattern.
Other than making sure that the previous August and September sea ice area measurements did get re-written as 0.0.
The NSIDC did not issue any notice nor provide any explanation for their actions, which happened after we wrote up the “first ever” summer sea ice residuals for 2016 and 2017 Sea of Okhotsk, Gulf of St Lawrence and Hudson Bay here at WUWT the first week in July.
Not true.
In fact, for the first time ever, the Bering Sea did NOT melt out completely this year.
Nice nitpicking but false.
Bering sea has been melted out since May, what you are referring to is errors caused by the treatment of the land/sea boundaries. On the 23rd of this month NSIDC showed 125 km^2 area in the Bering sea, the grid resolution for which is 25×25 km so that is one fifth of a grid.
Maximum area coverage reaches 1 million km^2 in the winter but as I pointed out it was very low last winter, only ~0.3 km^2. Your argument at best is: “But, but there’s 0.1% left over here”, which we know isn’t really ice anyway!
Check out all the ice on this part of the Bering sea coast earlier this month!
https://www.hl-cruises.com/ships/expeditions/ms-bremen/webcam-ships-position?webcam=20180909
So those “errors in the land sea boundaries” caused an increase of 2300 to 5000 square kilometers in the historical sea ice area records of the Barrett’s Sea, Bering Sea, Sea of Okhotsk, and Hudson Bay sea ice measurements between January and June of 2016 AND 2017, but NOT of any sea ice measurements in those areas for any month in 2010, 2011, 2012, 2013, 2014, 2015 nor 2018.
Those same “errors in the land sea boundaries” caused varying decrease of 1000 to 100 square kilometers in the historical sea ice area records of the Barrett’s Sea, Bering Sea, Sea of Okhotsk, and Hudson Bay sea ice measurements ONLY in August and September of 2016 AND 2017, but NOT of any sea ice measurements in those areas for any month in 2010, 2011, 2012, 2013, 2014, 2015 nor 2018.
Those same “errors in the land sea boundaries” caused varying increases of 1000 to 4000 square kilometers in the historical sea ice area records of the Barrett’s Sea, Bering Sea, Sea of Okhotsk, and Hudson Bay sea ice measurements between October 1 and December 31 2016 AND 2017, but NOT of any sea ice measurements in those same areas for any month in 2010, 2011, 2012, 2013, 2014, 2015 nor 2018.
Gee. Remarkably variable sea/land boundaries we’ve got up there.
To repeat, there were valid records of sea ice area (not extents, but the extents Tab of the NSIDC spreadsheets are comparable) for these areas through the entire 2016 and 2017 summer-fall melt period. Until they were erased by NSIDC after we reported on them at WUWT.
As soon as we reported that “The Bering Sea and Sea of Okhotsk and Gulf of St Lawrence set all time high sea ice area records for August and September 2016 and 2017”, the NSIDC erased those records, and re-wrote them to 0.0 .
So those “errors in the land sea boundaries” caused an increase of 2300 to 5000 square kilometers in the historical sea ice area records of the Barrett’s Sea, Bering Sea, Sea of Okhotsk, and Hudson Bay sea ice measurements between January and June of 2016 AND 2017, but NOT of any sea ice measurements in those areas for any month in 2010, 2011, 2012, 2013, 2014, 2015 nor 2018.
Yes, you should really learn something about the subject before pontificating about it. Here’s part of NSIDC’s explanation on the subject. Note that the satellites and processing change periodically too.
“One reason that ice extent images may have errors is that the satellite derived images in our Daily Image Update are near-real time and have not yet undergone rigorous quality control to correct for conflicting information that is especially likely along coastlines. Areas near land may show some ice coverage where there is not any because the sensor’s resolution is not fine enough to distinguish ice from land when a pixel overlaps the coast. …………We correct these problems in the final sea ice products, which replace the near-real-time data in about six months to a year.”
Mike Jonas
No, not true.
The emissivity of sea ice and the emmisivity of open ocean water are nearly identical. However, the sea ice is radiating to space (or the clouds above the Arctic, depending on your theory) at the surface air temperature. (Minus a film coefficient loss, which will vary with wind speed and relative humidity). So, the arctic sea ice will radiate at surface temperatures varying from-31 deg C (Jan-Feb) to -10 (late spring in April) to +4 deg C (June and July) to -10 (August-Sept) to -31 (Oct-Nov-Dec) . The open Arctic ocean is radiating ALL YEAR at +2 to +4 deg C.
The much higher open ocean temperature DOES greatly increase heat loss from the open water.
Evaporation losses are much less – normally only 20-40 watts/m^2. But there are essentially no evaporation losses from the sea ice, and 365×20 watts/M62 = a lot over the entire year.
Convection losses are much higher from the open ocean than from an equal area covered by the sea ice.
RA,
I don’t know what the average T of the Arctic Ocean is, but at least parts of it must sometimes get colder than +2.0 °C, ie close to the −1.8 °C (28.8 °F) needed for sea ice to form, since saltwater freezes at a lower T than the “freezing” of fresh water at 0.0 °C (32.0 °F).
No, not exactly true. The Arctic Ocean water temperature UNDER the sea ice is slightly under -2 deg C and it IS freezing/thawing as you mention on contact with the bottom of the sea ice.
Keep in mind the surface melt ponds on top of the sea ice are NOT at the Arctic Ocean temperatures UNDER the sea ice; nor are the millions of sq kilometers of the open Arctic Ocean at the same temperature and salinity as the first 1-2 meter of meltwater and freezing sea water right next to the edge of the sea ice.
(Energy is lost from the “warm” salt water as it freezes, moves through a complex mixed zone with varying salinities and temperatures, then is conducted up through the sea ice to
the surface of the sea ice, then through the air film layer to the air.
But in the open air, the surface of the water is varies between 2 and 4 deg C.
RA,
I thought that the Labrador Current was below 32 degrees F for much of its length.
True. (That chart shows the lowest temperature as 0, doesn’t it?)
But salt water at the usual pressure and salinity of the Arctic Ocean near sea ice freezes at ~ -2 degrees C. The “open ocean” exposed by “melted sea ice” is not in that area, but is right near the edges of the entire sea ice mass. And, for heat energy loss to the atmosphere, we can only consider the sea surface. Lower deep currents are irrelevant to heat loss to atmosphere each night.
Maybe the cold areas are sea T under ice:
http://www.seos-project.eu/modules/oceancurrents/images/c03_occamsst.jpg
RACookPE1978 September 25, 2018 at 3:55 pm
It looks to me as if the color below the zero indicates below the freezing point of fresh water.
But of course you’re right that most open Arctic water is above 32 degrees C. It seems strange to Arctic visitors that the water can be so much warmer than the air.
John Tillman
Well, best concept is to understand that ANY of the “open water” across the entire Arctic Ocean is ALWAYS losing heat to the air above it, and then to the infinite cold of space, but some particular areas just haven’t lost “enough heat energy” to freeze. Yet. The entire exchange starts with the cold water far below the surface, mixed and moved up to the near-surface, then blown and moved with the currents directly near and under the sea ice. Always, remember thermodynamics: The MOST heat energy is always lost from the “warmest surface” (T_Surface ^ 4 for LW radiation), the surface that can evaporate, the surface that can exchange heat by convection and by mass movement across its thickness (by wind movement and by natural convection), and with the thinnest insulation thickness and the highest film coefficient. In other words, open water ALWAYS loses more heat than a ice-covered surface.
Then the last bit is the very complex exchange of “regular salinity salt water”, “high salinity” salt water, and “no salinity” salt water (and the various frozen ice mixtures mentioned above from CryoSphere references.)
RACookPE1978 September 25, 2018 at 4:18 pm
According to consensus “climate science”, it’s not complex. More CO2 makes the air warmer, so more ice melts. Just ask the eminent oceanographer and atmospheric scientist Prince Albert Gore, who says, “What else could it be (causing Arctic sea ice decline)?”
Older sea ice has ejected enough salt to make (barely) potable water.
Yes, exactly. Thank you RA.
Let me try a different tack to summarize what I have been trying to express. I’m talking about homeostasis.
The temperature in the Arctic is fundamentally controlled by the very limited amount of insolation. In summer it is warm enough that ice melts to some extent. But in winter, the temperature is too cold to avoid refreezing. You can think of it as an equilibrium temperature for a given insolation, dynamically affected by perturbations of high or low temperature weather events or patterns.
If a warming perturbation melts excess ice vs the extent corresponding to equilibrium, then the system has powerful driving force toward refreezing. Likewise, if an unusually cold event were to freeze ice in areas where the equilibrium temperature is too high to sustain sea ice, the system has powerful driving force toward melting.
In both cases, the feedback drives faster toward equilibrium the further you are from equilibrium. Excess melting does not generate a positive feedback causing even more melting. Excess freezing does not generate a negative feedback causing an ice age.
I was trying to point out the radiative heat loss that drives the rapid refreezing of open ocean in any area where excess melting has occurred due to a warm perturbation, and dispute the claim that decreased albedo would cause melting to go into a death spiral.
As the Arctic water gets warmer in the summer, the number of freezing days during the winter may decrease (like the last two years) which in turn results in thinner ice which can be melted the next year.
https://sites.google.com/site/cryospherecomputing/fdd
Thinking about this further, water near its freezing point does not sink, it has a lower density approching that of ice. However, it will not be cooled below its freezing point until it has solidified. The ice surface, on the other hand, can cool to whatever the air temperature is (possibly 40-50K cooler). As the water freezes, all that latent heat of fusion has to go into the air and will radiate to space at a significantly higher temperature than the ice surface.
Certainly when there is little to no insolation from the autumnal to vernal equinoxes this must be true. Less so further south and during summer.
Rich Davis
“As the water freezes, all that latent heat of fusion has to go into the air and will radiate to space at a significantly higher temperature than the ice surface. ”
I think this is not correct. My understanding is that it is radiated into space at the temperature of freezing water. The energy is lost when water is at the freezing point, the IR photons are radiated at (or below) the freezing point and at no time is the radiation at an energy level above that of the freezing point of water. The water is freezing because it is losing energy at the temperature it has at the time.
Water does not warm as it freezes so the photons cannot reflect a higher temperature. Neither does it cool as it boils. An IR photon does not have a temperature, it has an energy level. The surface has a temperature, and if it is below the freezing point, water will turn into ice crystals.
The comment above about very cold water floating on less cold water is correct: as water approaches the freezing point, the molecules start forming worm-like chains which will line up to make crystals at the freezing point, increasing its volume considerably (about 10%).
I see where my wording was confusing. The ice surface that I referred to is the already-frozen ice surface that would be there if the sea ice had not melted during the summer. That ice can be cooled down to air temperature, which can be very much colder than freezing seawater. I was not referring to the ice surface forming in the seawater. When I said significantly warmer, I meant the upwelling IR would be at the freezing point of seawater, which is potentially 40K warmer than the air temperature coming off the ice sheet, and probably on average at least 10K warmer. That delta raised to the 4th power is my point.
May I ask – what’s so special about the 1981-2010 median?
It’s always shown in these arctic ice charts. Why not use a moving average?
Yes, a moving average would generate a better metric.
But. You do need an actual cycle to generate a valid moving average.
The “powers-that-be” in the sea ice community use that “old” 1980-2010 sea ice average daily value because it fits their preferred “30 year = climate data”. Without a simple linear decrease projected into 0.0 in some near future, would they have any evidence of any “Global Warming Crisis”?
But if you look at the Arctic sea ice as a cyclical value of 60 year amplitude, then you see a high value for 10 years as we crossed the 1982-1983 peak, 20 years of decreasing average values, then 12 years of near-static sea ice averages from 2007-2018. It is that low point of the cycle we are crawling out up from right now.
And, indeed, the 2018 values during the whole month of Sept are larger than 2/3 of the recent sea ice averages in Sept. Just as the 1982-1983 highs are greater than the 1978, 1979, 1980, 1981 sea ice values each day.
But we must wait for a few more days before we can figure out what the actual Sept averages for 2018 will be.
You cannot look at the Arctic sea ice as a cyclical value of 60 year amplitude, because we don’t have 60 years worth of satellite data to verify such a cycle.
David Dirkse
True, we do not have 60 years of satellite sea ice measurements.
False. No, we cannot be sure of the exact amplitude of the oscillation, nor do we know enough to declare a “certain period”. Heck, we have been observing sunspots since the 1600’s – and cannot make a firm sunspot cycle prediction either!
But.
We DO have enough information to “theorize” a 60 year Arctic Sea Ice cycle fitting all observed data: A slowly rising peak in 1982-1983. A slow decline from 1983-1984, accelerating through the mid-1990’s to early 2002. Then a slow decrease, a trough from 2007-2016, and now a slow increase from the flat period of 2007-2012: We see increases each year from 2015-2016-2017-2018.
This much information is not enough to establish the length of the cycle, just barely enough to theorize the amplitude of the 60 year cycle. But it absolutely proves the simple straight-extrapolation of sea ice decline (proportional to CO2 increases) is dead wrong.
Also both climate science and the msm have assumed that changes in sea ice are caused by agw and that therefore they can be moderated by cutting emissions.
Without the evidence for that relationship.
https://tambonthongchai.com/2018/08/04/does-global-warming-drive-changes-in-arctic-sea-ice/
No evidence ? Hey you fit a straight line to both sets of data then claim 100% correlation. Works with any dataset you chose to look at. That is fitting a linear trend is the corner stone of climatology.
You have a monotonically increasing variable , so if you can reduce everything else to a monotonic change you have spurious correlation you can use to spurious assert causation.
You guys really do not seem up to speed on how climatology works.
Javier commented a couple of years ago that there was a trend toward later Arctic ice minima.
Does this year’s minimum continue this trend?
Phil,
The 30-year average is the 17th. (I think I said 18th above.) This year’s low appears to have occurred on the 20th.
Which means what?
Looking at the chart, the lowest ice extent in 2012 also had one of the earliest minima.
We might expect later min SIE to correlate with lower SIE, based on the idea that warmer ocean currents melt more ice and take longer to freeze. But then what explains the early minimum SIE in 2012 compared to this year and last?
I guess it’s wind patterns and the definition of ice extent being at least 15%, rather than looking where ice is continuous or at least 85%. Winds can drive the area of at-least-15% ice to be wide or can bunch the ice up in a smaller area. The same amount of melting would be reported very differently.
The 15% ice metric may be important for safe navigation but probably not for assessing warming or cooling trends?
Rich,
There were Arctic cyclones in 2007, 2012 and 2016, so the WX in those years wasn’t normal.
I wasn’t necessarily supporting Javier’s observation, just pointing out the dates in response to Phil’s question. I haven’t averaged and compared dates for the first decade of this century and our present decade.
Javier’s statement would be confirmed if, as per my reply today to Nick above, occurs, that if the ice keeps melting today, there might be a record late minimum date.
But why is the 15% ice number relevant when wind patterns will dramatically affect the SIE for the same amount of melting? Does data exist for continuous ice coverage area or for other % coverages closer to 100%? I would think that the trend on that would be far more valid than looking at how far icebergs are being blown around.
Is there something wrong with this thinking? I certainly understand that 15% ice coverage is relevant to navigation and is likely the reason why it was chosen as a metric, but my argument is that as a metric related to warming or cooling, it’s flawed. Curious to know if you disagree with that and if so, why.
Rich,
I don’t know if 15% was chosen for an objective reason, or is arbitrary. In any case, it has long been the standard and I’m personally OK with it, as long as the observations are reported honestly and well made.
It would be hard to say what constitutes “continuous” sea ice within the grid used, since there are always shifting leads and polynyas of various sizes and time durations.
Arbitrarily, it might be defined as 85% for the interval of observations.
You might send an email to NSIDC or call them up.
John Tillman, replying to Phil
From NSIDC spreadsheets,
 in Mkm^2
Day     5-Day   Daily
        Extents Extents
1	4.992	4.900
2	4.963	4.903
3	4.928	4.837
4	4.896	4.869
5	4.863	4.804
6	4.845	4.810
7	4.818	4.771
8	4.796	4.727
9	4.763	4.701
10	4.727	4.628
11	4.690   4.625
12	4.664	4.639
13	4.655	4.682
14	4.644	4.647
15	4.631	4.560
16	4.616	4.553
17	4.601	4.563
18	4.596	4.657
19	4.594	4.640
20	4.598	4.579
21	4.600	4.564
22	4.601	4.567
23	4.594	4.623
24	4.595	4.640
From their data as of 25 Sept (the NSIDC data measurements released for 24 Sept), I’d say it’s still too early to declare we have passed the Arctic Sea Ice minimum yet.
Ref: All daily (single day and five-day trailing average) extent values in one file, updated daily (Sea_Ice_Index_Daily_Extent_G02135_v3.0.xlsx)
Antarctic sea ice extent has been in the normal range most of the season, but just had a dip and recovery, I assume it must have been stormy to change that fast, piled up and then relaxed again? Looks like the max. extent will end up very similar to last year. It’s such a vast area that any perceived deficit is really just nibbles.
Low point is about 4.5 Wadhams
I just compared that to the area of the contiguous US.. Its just less than 60%
That seems like a rather large amount of sea ice.
Mr. Grim,
Wobbles like that are pretty common during Antarctic sea ice extent topping behavior.
It will still probably be a lower than average year, but no biggie. It’s just WX and recovery from the freak events following the 2016 super El Nino.
The important point is that Antarctic sea ice gained from 1979 to 2014, so CO2 can’t be the cause of the natural decline in Arctic sea ice from 1979 to 2012.
I should have said slightly lower than average, but probably still in the normal range. Next few days will tell the tale.
Well it’s been outside the lower boundary of the interdecile range for most of the last year and the recent rise has taken it up to the edge of that range. If it matches last year that would be a tie for the lowest on the NSIDC record.
But, Antarctic Sea Ice had been rising for the period 1992 through August 2015.
Antarctic Sea Ice set an all-time record high in June 2014 with an positive anomaly of +2.16 Mkm^2 of “excess” sea ice – An anomaly larger than the entire lad area of Greenland!
Now, the University of Illinois Cryosphere did recently retire out its sea ice research staff, at which time the Antarctic sea ice went into a precipitate decline by 1.5 Mkm^2 for 2016, 2017, and 2018. (Mere coincidence certainly.)
Phil,
Yesterday’s Antarctic sea ice extent in NSDIC was higher than the maximum for 2002 and 1986 (among the years I checked). It might end up higher than last year, too. It’s close.
Freak WX events in 2016 crashed Antarctic ice, from which it’s recovering, despite the aftereffects of those incidents, plus the super El Nino of that year. After its spectacular growth in 2014, a fall back was probably in the cards in any case.