Guest reanalysis by David Middleton
Analysis
California’s climate moon shot
Jeff Spross
August 31, 2018
California may be done waiting for everyone else to get their act together on climate change.
Earlier this week, by a vote of 44 to 33, the state Assembly passed a bill that would require California to get 100 percent of its electricity from renewables by 2045. An equivalent measure already passed the state Senate. A whopping 72 percent of Californians support the measure. All that’s left is for Gov. Jerry Brown (D) to sign the bill. And he’s expected to do so.
You only have to look at the news to see why. The biggest wildfire in state history has been burning for over a month, scorching some 400,000 acres, killing one firefighter, and clogging cities and towns with smoke. Meanwhile, sea level rise threatens the state’s prosperous coastal communities even as skyrocketing temperatures dry up farmland in the Central Valley.
So assuming Brown signs the bill, can California actually pull it off?
“It’s mostly a question of willpower,” Mark Jacobson, a professor of civil and environmental engineering at Stanford University, told Scientific American last year. “From a technological, economic point of view it’s possible to do it.”
Jacobson is one of the lead authors of a 2014 paper that laid out an entire roadmap for how California could do just this.
[…]
The whole planet needs to decarbonize between 2050 and 2070. California has 39 million people and an economy that would be the fifth biggest on Earth if it was its own country. It isn’t the world. But if California can pull this off, it would be one heck of a demonstration project.
How does this qualify as “analysis”?
Unsubstantiated claims that California’s wildfire season and the drying of the Central Valley were the work of climate change, rather than the State’s mismanagement of forests, wild-lands and water resources doesn’t strike me as “analysis.” The claim that “sea level rise threatens the state’s prosperous coastal communities” is preposterous. And the assertion that “the whole planet needs to decarbonize between 2050 and 2070” is simply bat schist crazy.
The closest thing to analysis is the citation of a “Unicorns are real” paper that was thoroughly destroyed and debunked. Destroyed and debunked so thoroughly, that the author tried to sue the debunkers.
Although, the characterization of California’s folly as a “Moon shot” is rather apt… Only because we haven’t returned to the Moon, relegating the Apollo Program to the status of a demonstration project in the eyes of many, if not most, people.
Why would anyone refer to Jeff Spross or The Week for “analysis” of energy policy?
Where to start? The Publication and author
The Week Magazine
The Week bills itself as “All you need to know about everything that matters”…


The Week is generally described as having a center-left bias. However, to their credit, they do occasionally publish articles and opinion pieces from a more conservative perspective. So, it is possible that The Week is a cut above The Nation, The Huffington Post, The Grauniad, Scientific American, etc. as it pertains to articles of at least a quasi-scientific nature… But not exactly a primary source for energy policy analysis… And certainly not even close to all I need to know about everything that matters… It’s more like “All you need to know about everything that matters” to social justice warriors with an occasional mild rebuttal.
Jeff Spross, the author
Jeff Spross
BUSINESS AND ECONOMICS CORRESPONDENTJeff Spross is the economics and business correspondent at TheWeek.com. He was previously a reporter at ThinkProgress.
On his LinkedIn page, he describes himself as “Media Jack-of-All-Trades,” with significant experience in blogging and video production. He has a BS in Radio/TV/Film from The University of Texas at Austin. The lack of any qualifications whatsoever in anything to do with energy and/or climate science doesn’t necessarily mean he’s wrong… But it leaves me lacking any reason to be interested in his opinions on energy policy… beyond ridiculing them.
Analysis and reanalysis
Reanalysis: “the act or an instance of analyzing (something) again : repeated or renewed analysis”.
The Spross Analysis
California decarbonization by 2045.
Earlier this week, by a vote of 44 to 33, the state Assembly passed a bill that would require California to get 100 percent of its electricity from renewables by 2045. An equivalent measure already passed the state Senate. A whopping 72 percent of Californians support the measure. All that’s left is for Gov. Jerry Brown (D) to sign the bill. And he’s expected to do so.
Reanalysis
So what?
A whopping 72 percent of Californians would probably support measures that repealed entropy and protected California from the ravages of plate tectonics. People can vote for Unicorns too.
For the sake of argument… Let’s assume California successfully decarbonizes its electricity generation by 2045… It won’t have any affect on California’s climatic woes, real or imagined. 95% of the electricity in these United States and District of Columbia isn’t generated in California.
| Total Net Electricity Generation, May 2018 | |||
| Rank | State | Thousand MWh | % of US Total |
| 1 | TX | 41,697 | 12% |
| 2 | FL | 20,493 | 6% |
| 3 | PA | 16,243 | 5% |
| 4 | CA | 15,566 | 5% |
| 5 | IL | 14,978 | 4% |
| 6 | AL | 12,243 | 4% |
| 7 | WA | 11,346 | 3% |
| 8 | NC | 11,183 | 3% |
| 9 | GA | 10,856 | 3% |
| 10 | NY | 10,538 | 3% |
The Spross Analysis
Wildfire prevention through decarbonization…
You only have to look at the news to see why. The biggest wildfire in state history has been burning for over a month, scorching some 400,000 acres, killing one firefighter, and clogging cities and towns with smoke.
Reanalysis
This is simply laughable.
Note the pattern:


While, the NIFC states that “prior to 1983, sources of these figures are not known, or cannot be confirmed, and were not derived from the current situation reporting process. As a result the figures prior to 1983 should not be compared to later data” and there is a clear seam in the number of fires time series, the acreage burned is not so subject to reporting errors, is a smooth time series and is very consistent with the data from Oregon.
It appears that CO2 might just be a good fire extinguisher.

The Spross Analysis
“Sea level rise threatens the state’s prosperous coastal communities”
Reanalysis
Words fail me… So I’ll use pictures.


The Spross Analysis
“Skyrocketing temperatures dry up farmland in the Central Valley”
Reanalysis
He’s referring to “The Valley That Hope Forgot.”
We have droughts in Texas too. We build dams and other water infrastructure. The issue is water resource management. Texas and California drought patterns have similar relationships to the ENSO. Texas deals with its droughts; while California doesn’t. The primary difference is that Texas relies more heavily on supply side solutions.
Meteorological drought conditions are the acute cause of water shortages. Government is the chronic cause of the water shortages. 35 years of idiotic governance have resulted California’s inability to deal with cyclical drought conditions. They have allowed environmental nonsense to block the expansion of their water infrastructure to keep pace with population and development.
Southern California and the Central Valley have always needed additional water storage and delivery capacity.
The 10 largest reservoirs in California, linchpins of the water system for 38 million people and the nation’s largest farm economy, were all built between 1927 and 1979. Shasta Lake, the massive inland sea on the Sacramento River near Redding, was finished in 1945. Oroville, the tallest dam in the United States, at 770-feet high on the Feather River in Butte County, was started under Gov. Pat Brown’s building boom in 1961 and finished in 1968.
The last huge reservoir built in California was New Melones, on the Stanislaus River in Calaveras County. Since the Army Corps of Engineers cut the ribbon on it in 1979, California has grown by 15 million people, the equivalent of adding everyone now living in Washington, Oregon and Nevada to the Golden State.
Much of the Great State of Texas has also always needed additional water storage and delivery capacity.
Texas surface reservoirs are at 72% capacity, despite persistent drought issues…

Texas has steadily increased its surface reservoir capacity over the past 80 years…

During the previous ENSO-related drought prone period, Texas quadrupled its surface reservoir storage capacity…

Texas is meeting the current ENSO-related drought prone period by building more water infrastructure, including 26 new major surface reservoirs…
In the 2012 State Water Plan, 26 new major reservoirs are recommended to meet water needs in several regions (Figure 7.1). A major reservoir is defined as one having 5,000 or more acre-feet of conservation storage. These new reservoirs would produce 1.5 million acre-feet per year in 2060 if all are built, representing 16.7 percent of the total volume of all recommended strategies for 2060 combined (Figure 7.2). Not surprisingly, the majority of these projects would be located east of the Interstate Highway-35 corridor where rainfall and resulting runoff are more plentiful than in the western portion of the state.
The Spross Analysis
“One heck of a demonstration project”.
The whole planet needs to decarbonize between 2050 and 2070. California has 39 million people and an economy that would be the fifth biggest on Earth if it was its own country. It isn’t the world. But if California can pull this off, it would be one heck of a demonstration project.
Reanalysis
If the “whole planet needs to decarbonize between 2050 and 2070,” the decarbonization of 5% of US electricity generation by 2045 won’t be “one heck of a demonstration project.” It would be a barely noticeable demonstration project.
In the meantime, Texans will continue to see increased oil and gas production, increased electricity generation (from all sources that work) and the build out of more water infrastructure (initially funded with oil & gas revenue).
| Texas vs California | TX | CA | TX/CA |
| Electricity Generation, May 2018 (1,000 MWh) | 41,697 | 15,556 | 2.7 |
| Wind Generation Capacity, 2016 (MW) | 21,450 | 5,561 | 3.9 |
| Crude Oil Production, May 2018 (1,000 bbl/month) | 131,541 | 14,391 | 9.1 |
| Natural Gas Production, 2016 (mmcf/year) | 7,203,012 | 205,024 | 35.1 |
So, if California pulls off one heck of a a barely noticeable demonstration project, it won’t make any difference anywhere outside the wallets of Californians. And, quite frankly, this is how the “whole planet” looks from here:

David Middleton is a petroleum geologist and has been a naturalized Texan since 1981.
Biggest problem I see…is doubling your population…and not doubling the infrastructure to support it…
…they can give over 1 million “undocumented children of God” drivers license…but can’t even supply them with water, etc
…all of this is just one big circlejerk any way….China, Russia, India…keep going for over 100….have no intention of backing off
No, Jerry’s answer to finite resources supplying infinite immigration is to FORCE all Californian’s (except the Hollywooden and Silicon elites) to live like the 3rd-world immigrants did in their countries of origin. Dirt poor. Thirsty. And cold/hot.
The benefits of socialism… /SARC
Has to be…..common sense says the more people working…the more money brought in from taxes…the more money government has for all these socialist programs…a win win
..yet they go out of their way to kill it
Latitude, one of the most significant problems is government spending on socialist programs and not infrastructure all the while promoting growth. I had a retiring moderate Democrat tell me that was one of the biggest reasons he was retiring.
They even get to live in a box on the side of the road, just like their country of origin. Box sweet Box,
And three families per house
In the Silicon Valley … 8-unrelated people in single family residential neighborhoods. Openly and defiantly flaunting every zoning code … but the leftist government bureaucrats allow it. Because … because … ?? You tell me …
“flouting” not “flaunting.” People flout laws (i.e., violate them), but they flaunt things they’re proud of (flaunt = show off, demonstrate with pride, etc.). I would love to flaunt my gun collection, but my $25 Daisy hardly seems enough.
If these idiots would talk about “low carbon” ather than renewable sources of power, they could well acheive their (pointless) goals without bankrupting the state – molten salt nuclear reactors could easily do the trick and cost about a zillion times less than renewable junk power.
*Any* nuclear reactors would do the trick. Heck, natural gas would reduce CO2 emissions faster than wind & solar.
Yes, but the same kind of fabricated fear that demonizes CO2 has also been applied to nuclear energy. Fear is a powerful motivator and if it’s fearful enough, it doesn’t even need to be true.
Funny though, how fake fear seems to be far more powerful than real fear, for example, we really should be far more afraid of large earthquakes, super volcano explosions, extinction level impact events and future ice ages, all of which we know for certain are inevitable and far more catastrophic then even the most wildly imagined catastrophic consequences of CO2 emissions.
Dr. Goebbels’ basic principles:
– Avoid abstract ideas – appeal to emotions.
– Constantly repeat just a few ideas. Use stereotyped phrases.
– Continuously criticize your opponents.
– Pick out one special “enemy” for special vilification.
Strictly speaking, these principles belong not to Dr. Goebbels, but to his boss, The Fuehrer, who built The Third Reich on them.
….. and it was not a happy ending for Dr. Goebbels and his family (nor his boss).
Do you see any Trump in those strategies?
“it doesn’t even need to be true. ”
For all the proof of this that anyone needs, look no further than the “sea level rise” boogeyman.
Anyone can walk down to the ocean and see where it is, can look at historical photos, long standing structures, or even just the tide charts we here are all familiar with, and see that there is nothing happening with the level of the sea, AT ALL, that is new or different or worrisome or dangerous.
Anyone who looks can plainly see it is made-up nonsense…and yet the hysterics continue unabated. The situation is more grim and gruesome with every telling, even as nothing at all has changed, even a little.
This is really all you need to know to be very unhopeful that the general public is “getting it”
And all one needs to know to understand why the warmistas are so bold and unrepentant in their spiderweb of jackassery, lies, and sky-is-falling alarmist rent seeking.
I can recall reading about mass psychosis long before any present-day real life examples existed, and wondered how it could possibly be true?
If you are one of those who has been resistant to this delusion, or one of the ones who have come to your senses after initially falling for it, give yourself a pat on the back.
I expect the delusion will be unable to persist in current form for a whole lot longer, and we must all consider how we will keep those responsible from slithering away and avoiding blame for the damage they have done.
Yeah … and yet PG&E are PUNISHING ME for consuming Nat. Gas to cook my food and keep my house warm. And my house is fully insulated, has dual pane windows, a 95% efficient furnace, insulated ducts … and a NEST “learning” setback thermostat set to 65deg.F … and I don’t have AC. Yet PG&E SLAMS my modest two story 2,800sf Home into their USURIOUS third tier pricing of a GREEN energy source … because it was formed in some primordial swamp. FU PG&E FU CA PUC FU Jerry and every single global warmist eco-bureaucracy in State Govt.
Wait….what?
Formed in a swamp?
And by 2050 some of those nuclear reactors might just be coming on line. The trending of worldwide timelines for nuclear reactor siting, permitting, obtaining funding, planning and siting for radioactive waste disposal, and finally construction of nuclear power plants shows 20 or more years needed for such.
Besides, the planet will likely be 1 C cooler by then, naturally.
When the power goes off and people are dying, you can be very sure that 20 year nonsense will not be tolerated.
David,
Did Texas pass a law that all rock hammers have to have a blue handle? 🙂
Only rubber-handled Estwings. The leather grips aren’t blue…
I only use the rubber handled hammers, because one saved my life in college. A long story involving $1/pitchers of beer, a broken light socket hanging from the ceiling in the hallway of my dorm, my rock hammer and a *brilliant* idea for a Thor impersonation… 😉
Wow! You barely dodged your Darwinian demise … I’ve got a few of those stories. None of which involve a rock hammer – thank God (not Darwin).
If I had $1 for every time I dodged Darwin from 1975-2004… I’d be a gazillion-aire… But, the joke’s on Darwin… all of our “children” have four legs and are descended from wolves… 😎
Ha! Well balanced kids … spawn of Romulus and Remus
Yup!
At the end of a day checking out a property “We broke a lot of rock today”.
For those of us who went into hard-rock mining.
Bob Hoye
Ha, it’s not about ‘breaking rock’ at all, it’s about ‘making hole’!
I’m going with the Middleton Analysis. Anyone who uses dwarfs and midgets to visually-scale the vertical axis of a sea level rise graph … wins the argument.
I could have used really short Nazis… But then I would have lost due to Godwin’s Law… LOL!
There were short Germans? Among the Master race!?
The numbers from the 1920-1940s don’t pass the BS test. Assuming a burned area doesn’t burn again in the next few years, ALL of California burned during that time. Do the math.
The NFIC graph is for the entire US.
More details on the NFIC graph…
https://www.fs.fed.us/research/sustain/docs/national-reports/2003/data/documents/Indicator%2015/Indicator%2015.pdf
The relevant chapter is Fire, Historical Perspective…
https://debunkhouse.files.wordpress.com/2018/08/report-of-the-united-states-on-the_fire_historical_perspective.pdf
ReallySkeptical should really be more skeptical of others’ (his?) assumptions about wildfire frequency. Vegetation Burns – Seeds Drop – Mild Winter – Wet Spring – Renewed Vegetation – Drys Out That Summer (or next) – Burns Like Hell.
He’s really skeptical towards anything that disagrees with his religion.
He’s reallygullible period.
He could at least look up Wikipedia, the trolls favored source for “science”! If he happens to drive back by…
Here in Arizona, I’ve seen the same patch of brush grow during the winter rains, burn in late spring when it dries out, grow during the monsoon rains, and burn again in the fall. Once, the same place burned three times in the year (we had one of our “interrupted” monsoons that year, so it burned mid-summer too).
Exactly. You hit the nail on the head.
Sorry, ReallySkep. Your assumption is wrong. I lived on the border of a wilderness area in Southern Kalifornia. One year we had three fires – in the exact same canyon behind our house. Firemen set up camp in our back yard (with our blessing). I’ll admit it was shocking to us – what was to burn after the first fire… after the second fire? In fact, many large oak trees survived all three burns. Since there was a nice creek flowing year round, recovery of the brush was very quick. It was the primary fodder, igniting smaller trees. As smaller trees died from the ravages of the previous fire, they became fuel for the next one. As a natural wilderness area, management of undergrowth was not allowed.
If you look at most burn areas (there are a ‘million’ of them in Kali) you’ll see that not only are there a lot of trees standing, but some of them are still living. Plenty of fuel for another fire.
Hoping Moonbeam signs this and they follow through.
Then by 2045 what little electricity they will have will cost a fortune and be unavailable when most needed, and most Californians will be living just like the 49ers, who had none.
On the bright side, this will ensure the forests get properly thinned for firewood for cooking and heat. californians won’t mind all the resulting smoke pollution, because it is renewable pollution.
Surely a sarc tag isn’t necessary.
Californians can vote with their feet and are free to move to other states. By 2045 there may not be too many people left due to cost of living increases and shortages of what little power and water is available.
Who will fight the naturally caused fires then?
…the undocumented children of God who do the word we won’t do
We don’t want them or their screwy ideas here.
Noooooo …. if Moonbeam signs it, more of the intellectually challenged of California will move to Texas …. sporting their “Turn Texas Blue” stickers.
If moonbeam signs it, Texas needs to sign a bill to flood the Cali market with free energy to keep the lunatics in the loony state where they belong.
I’ve ALREADY stepped-up my wood fireplace burnings. My fancy NEST thermostat … dialed back to 65deg.F has “learned” all it can from my family … and we’re FREEZING in the winter and paying massive $$ Third tier PG&E energy use PUNISHMENT rates. Screwit! Prime oak is cheaper than what PG&E charges for 3rd tier natural gas.
I thought the PUC was supposed to PROTECT the CONSUMER!? When did they become Global Warmist co-conspirators?
Kenji,
The PUC started looking at ways to implement the legislatures, directives to reduce c02 levels around 2002. ,
Ref- http://energyskeptic.com/2014/roger-andrews-california-public-utilities-vote-no-on-energy-storage/
Does anyone ever consider that 400,000 acres of wildfires equals a square 25 miles on a side?
nobody that counts
About 0.4% of the land area of California, I reckon.
No place to run, no place to hide with only 99.6% of the state left.
Here in Reno, NV, it sure seems like more than 0.4%. We rarely get to see our mountains, our air smells of wood smoke. Only nice days are when the winds are from the East. Kali could do us a big favor – burn oil in power plants, not trees in the wilderness! But no – we have to put up with massive air pollution from Kalifornia – a “Green” state.
Someone ought to sue them for billions. It could be paid for with bullet train money.
640 acres = 1 sq mi… IIRC, that was the Railroad Commission’s standard gas well spacing back in the 80’s, when I worked East Texas.
I wish they’d pass a low against belly fat. I’ve really been struggling with that.
Speaking of which, when’s dinner?
[The mods, being skinny, wonder if passing a law against high belly fat would be more effective. .mod]
USDA says eat bread, pasta, cereals and grains as the base of your food pyramid. Besides belly fat, it does wonders for heart disease and diabetes.
That law will come with waivers and time extensions for those that truly need help … you don’t qualify.
(but don’t despair, your fat tax (after the appropriate administration costs) will go to those that do qualify)
Everyone gets the same buckle and belt size, call it Universal Belt Care.
Not a low law against *pork* belly fat I *do* hope.
And there in is one of the very best experiments to show how crazy ‘government’ has become.
Simply (in theory, not so much in practice) IGNORE all that Government Advice.
Do NOT eat grains – eat saturated fat instead
Do NOT eat vegetables – eat animals instead (esp the bits normally thrown away like livers, kidneys & blood)
Now the difficult bit – Do NOT consume the ‘recommended’ amount of alcohol – consume none at all.
You yourself will not notice much happening but something will happen at 6 months+..
someone will say something..(complimentary & entirely out-of-the-blue) blue -haha
some event will happen – possibly and quite certainly your pants will succumb to gravity without the aid of a belt…BUT….AND you will laugh/make a joke rather than dying of embarrassment as you would have 6 months prior)
…it’s THEN you will realise just what’s happened.
You’ve woken up from what was a very deep sleep and you will suddenly ‘see’ you are surrounded by sleep walking zombies.
Others, the non drinking fat-eaters like you will stand out from the crowd as dazzling stars in a very gloomy sky (this is ‘First Impressions’ at work)
Do NOT take my word for it, nor *anyone* else’s and there are no links to click. Anyway, what use are links, the interweb is rapidly filling with junk, spam and flat-out fakery. Even before we get onto facebork and Windows 10
Quote NASA- ‘In God we trust, all others bring data’
Bring your own data.
So what’s stopping you, do you not trust even yourself – yet you trust doctors & scientists?
Does that alone not tell you ‘something’ is very badly wrong out there?
Not sure why there were negative votes on this comment. Government has been recommending a specific diet, and has been quite surprised that in ensuing years obesity rises. Biochemists keep providing evidence that Government recommended diets are bad for the body (usually the liver).
Maybe it’s the tea-totaler element. I’ll admit I enjoy alcohol – in moderation, i.e., less than the Government recommendation. High fructose foods and drinks are shown by bio-chemists to be as hard on the liver as over indulgence in alcohol. In fact, the impact to the liver are almost indistinguishable.
Another reason to be careful of studies involving rats/mice. They are not the same as we are. Even gorillas are not the same as we are, and they are much more closely related. Yet they thrive on carbs, as their livers are evolved to handle a nearly all carb diet. Ours are not.
I suppose that Caifornian energy policy will contact reality at some stage. The only question is will it happen before civil unrest?
Great illustration on sea level rise, using little people for scale. Nice snark.
I like it. Little people are overlooked too often. There’s Wizard of Oz, Game of Thrones, and that’s pretty much it. More height diversity!!
How many times have we heard that CA would have the 5th highest GDP if it left the U.S.?
First, if it left the U.S., its GDP would probably decline by a significant amount from loss of U.S. spending there. Nevertheless, just take GDP data from Statistica. It has the CA GDP at 2386 billion USD for 2017.
It has U.S., China, Japan, Germany, France, UK and India all higher that 2400 billion USD for 2017. By my reckoning, CA would be 8th on the list for GDP, although not significantly different from India’s 2439 billion USD.
So you are arguing that Cal is 8th rather than 5th? Okay.
wonder what Brexit is going to do with the UK…
Once the drag of EU taxes and regulations is removed, the economy should start improving rapidly.
George III , writing in his diary : ” I wonder what those pesky colonials are going to do without the British Empire”
I’ve seen many analyses that show if you take into account the high cost of living in Kalifornia, they would be much lower. Taxes, home prices, cost of state regulations, etc.
Hope is eternal: “SB 100 sets California on a path to 100% renewable energy by 2045, cleaning up our air and creating good jobs in the process. The bill creates thousands of high-quality jobs while also reducing the pollution that warms the planet and harms California’s children and families.” http://focus.senate.ca.gov/sb100
Hmmmmm . . . didn’t I hear almost the same words and phrasings used years ago for Gov. “Moonbeam” Brown’s high speed rail project???
They can start cleaning up the air by taking care of their God damn forests! They’re polluting neighboring states!
“Earlier this week, by a vote of 44 to 33, the state Assembly passed a bill that would require California to get 100 percent of its electricity from renewables by 2045 . . . All that’s left is for Gov. Jerry Brown (D) to sign the bill. And he’s expected to do so.”
This sounds so much like Pharaoh in the movie “The Ten Commandments”: “So let it be written, so let it be done!”
I have just one simple question that nobody appears to be asking: What happens if the “requirement” is not met?
Does failing to get 100% electricity from renewable sources before 2046 mean that everyone in California will have to pay a penalty (i.e., tax), and if so how much? Or will a monetary penalty be assessed only against TAXPAYERS (who in 2045 will likely comprise less than 30% of the state’s residents, they way things are currently going).
Let’s consider sending the top 50% of all electricity users to jail for 5 years for failing to meet the legislated mandate. Yeah, that’ll do the trick. Or maybe those top 50 percent of electricity consumers are just to be permanently banished from the state?
Maybe the penalty should be more severe, like forfeiture of all personal property to the state. Or maybe giving up each family’s firstborn child or children.
However, California does have a glimmer of hope . . . once the voters truly understand the horrendous cost impact of moving to 100% renewable-sourced electricity in less than 20 years (right now it is only 53% of the way there), the voters can resort to the state ballot initiative process to kill this idiotic legislation and its associated “requirement”, and in so doing give the middle finger to the state’s government and bureaucracy. So let it be written, so let it be undone.
Well, in the UP of Mich, there is an argument for living off the grid with solar. Cal can’t be that bad.
https://www.mtu.edu/news/stories/2016/may/leaving-electrical-grid-upper-peninsula.html
With co-gen. Like a typical lib, ignoring half the facts (being generous) you don’t like.
RS, a hint for you: in terms of State legislation, California is not only worse than you imagine, it is worse than you ever can imagine.
There is an argument for living off the grid with solar IF: you are someplace only in the summer (no solar power when there’s five feet of snow on the panels) where no AC is needed, so your power needs are just for lights, hot water, refrigerator, and stove. AND you have batteries to accommodate nights and cloudy days. AND you have a NG electric generator when the batteries aren’t enough, or you get a summer cold-snap.
Really, RS, is that the best you can do?
Have you been to the UP? I have. They are already semi-independent of the grid. Many use fuel oil for heat (large, above ground tanks in the yard), and Ben Franklin wood/coal burning stoves, not just electricity supplied by a grid that could fail. It gets wickedly cold and snowy in the winter. Relying on solar/battery/NG generator would be suicidal. If not kept warm, the batteries would fail. Heavy snows render solar useless, even when the days become sunny again. So your NG gen better be able to handle the full load for long periods (and pray it doesn’t get so cold that the NG liquifies). So just what have you accomplished? You need fossil fuel to survive winter whatever you do.
“What happens if the “requirement” is not met? “”
There is no “if”.
It not only will not happen, it cannot happen.
Also, note…the bill says that all of the electricity they use must be sourced from renewables, but they have 10% f the population and only produce 5% of the electricity.
Unless they have a per capita usage of half what the rest of the US uses, the obvious implication is they get at least half of their power from out of state, which by their own law will not be usable unless it is 100% renewable (whatever the word even means: I wonder if they define it in the bill?).
Again, to be clear…it is impossible…cannot be done.
The Sun does not shine and the wind does not blow as and where needed…ever, let alone all the time.
There is zero indication or reason to believe that grid-scale long term storage of sufficient power to keep an entire state from going black, will ever be possible.
Ever.
Period.
The hilarious part is while CA bankrups the state and its citizens to reduce co2, much of the Chinese co2 and pollution, including whatever comes out of all those new coal fired plants, many times ends up in CA eventually.
Um, all of the CO2 goes into the air and goes everywhere, and not “many times”, but all of the time.
There is only one atmosphere.
How could Menicholas get a minus? What about his statement is arguable? (It was minus 1 before I voted.)
I’m sure those voting down anticipate CA passing legislation that bans foreign atmospheric CO2 from entering the state.
I agree with the analysis about the minimal effect on world CO2 production if CA does accomplish its goal ((which is doubtful).
But concerning sea rise, I point out that analysis shows that past sea level responds to temperature changes. The globe has warmed more lately and sea level in both LA and San Diego (graphs above) have risen 10-20 centimeters since 1998, or a rate of ~10-20 mm/yr, which is considerably larger than global sea rise rates.
What? 10-20 mm/yr? Where did you get that?
Look at the graphs. Copy them and expand vertically to see decadal-long changes in sea rise rate over the past century. Many tidal gauge graphs show such variations.
So what. Look at the long term trend with short term fluctuations averaged out. A short term change of 1/2 inch means nothing.
“The globe has warmed more lately and sea level in both LA and San Diego (graphs above) have risen 10-20 centimeters since 1998, or a rate of ~10-20 mm/yr, which is considerably larger than global sea rise rates.”
Well, you might want to look into land subsidence as the underlying cause of that discrepancy in LA & SD SLR versus global SLR.
“Satellite altimetry has shown that global mean sea level has been rising at a rate of ~3 ± 0.4 mm/y since 1993. Using the altimeter record coupled with careful consideration of interannual and decadal variability as well as potential instrument errors, we show that this rate is accelerating at 0.084 ± 0.025 mm/y2.” — Abstract of “Climate-change–driven accelerated sea-level rise detected in the altimeter era” by R. S. Nerem, B. D. Beckley, et. al., PNAS February 27, 2018. 115 (9) 2022-2025; published ahead of print February 12, 2018.
You see, both Los Angeles and San Diego are in the subduction zone of the Pacific plate as it moves under the North American plate (boundary currently defined most by the San Andreas fault). As a result, land on the fault’s western side is subsiding with respect to the geodetic ocean level, and if not accounted for the relative motion would (erroneously) appear as an anomalous increase in the rate of sea-level rise.
For some time GPS and other satellite data are used to determine vertical land changes in the area around a tidal gauge in order to make corrections. So, presumably, land movement has been taken out of these and other data. And vertical land movements does not quickly change its rate.
Actually, much of the variations in tidal gauge data is caused by local variations in sea level caused by e.g., currents, tides, temperature, etc. Vertical land motion don’t make the sudden reversals seen in e.g. the CA gauges.
Wherever one lives, it is the local sea level change that is of interest, not so much what occurs elsewhere.
As for the ~3 mm/yr satellite sea rise rate, large compilations of tidal data (hundreds) show a similar rise rate increasing around 1990.
Determining vertical land changes via satellite has certainly not been done for the entire length of the record, and I would NOT expect it to be used for these graphs — the very point of measuring the local sea level rise is so that you know what the *relative* sea level rise is for that location, the only rise that actually matters.
Starting from 1998 to measure a local rise seems odd — why 1998? Given that 1998 appears to be at a sharp dip from immediately previous high levels, it seems oddly chosen to show a maximum rise. In general, there’s no reason to prefer a shorter trend over a longer trend when the recent data is still consistent with the longer trend — and it still is. The long-term trend has plenty of rises and dips in it, and in the last couple years it declined sharply.
Saying the world has “warmed more lately” to support a 1998 trend start date won’t fly, as the global temperature anomaly trend was higher from 78-98 than 98-18. Remember the pause?
But the really big problem is that a 10-20 cm rise in the last twenty years (that would be 5-10 mm/yr, not 10-20 mm/yr) is still trivial to adopt to. Neither Los Angeles nor San Diego has had to do anything to adapt to a sea level rise that is dwarfed by the daily tidal variations. The idea that wealthy coastal communities are “threatened” by a rise in sea levels that is both small and slow is ludicrous — as if with decades to prepare they are incapable of either raising low-level land adjacent to the ocean and/or preparing dikes or sea walls to keep the sea out. *Sudden* rises in ocean levels threaten coastal communities anywhere a Tsunami is possible. Any rise measured in mm/yr does not.
Tide gauges are not adjusted for isostacy.
donb, please look again at the SLR graphs given in the above article and compare them to your statement that I quoted in my above response.
The SLR graph for San Francisco gives a linear slope fit of 1.96 mm/yr for the period of 1898 to present; the SLR linear fit for Los Angeles is 0.98 mm/yr for 1923 to present; and the SLR linear fit for San Diego is 2.17 mm/yr for 1905 to present. None of these are within 25% of the 3 mm/yr global SLR measured using satellite altimetry since 1993. There is no apparent “shift” in SLR rate revealed by any of the linear fits to the data, and there is nothing in the data using a rolling 20-year average basis to support the claim of 5-10 mm/year SLR in any of these regions.
To the extent there was a clear cooling trend in global temperatures from 1941 through 1975 (30 years span), and a pause/hiatus in global warming from about 2001 through 2014 (14 years span), none of the SLR plots appear to show evidence that the Pacific ocean had a SLR reaction—even a delayed reaction—to these global temperature variations.
And other than land subsidence variation (actually, we now should be looking for dry land uplift to explain tidal gage readings BELOW the 3 mm/yr absolute SLR global average), how does one account for the large, *consistent* difference in SLR linear rate between Los Angeles and San Diego (0.98 mm/yr versus 2.17 mm/yr, respectively) with only about 110 miles straight line distance separating the Pacific coasts off both cities?
Follow-up: great information on satellite (InSAR) measurements of dry land uplift/subsidence mapping can be found at https://pubs.usgs.gov/fs/fs06903/
I found one image that really shocked me: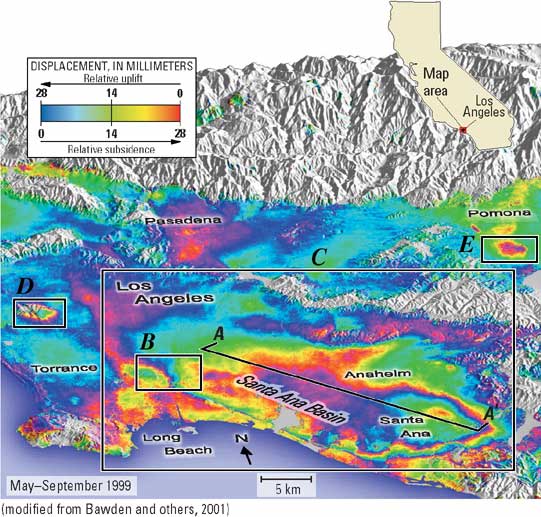
This color coded elevation-change image of the southwestern Los Angeles basin is based on data from May-September 1999 (5 months, if inclusive) and indicates a RELATIVE surface elevation change of about 30 mm taking place during this time over a distance of less than 10 km, from the costal community of Torrance to the costal city of Long Beach.
From website text at the first URL: “Ground-water pumping and artificial recharge are producing as much as 60 mm (millimeter) of seasonal uplift and subsidence with 20 mm of net basin subsidence (April 1998–May 1999).”
So much for donb’s assertion “And vertical land movements does not quickly change its rate.” [sic]
So, it appears that much caution is needed in “reading” anything into tidal gage measurements that are referenced to a local land elevation datum and that are NOT corrected for vertical ground movement.
Gordon,
I agree that long-term (century) data of some tidal gauges show an overall linear trend. But that trend in many (not all) consists of short (decadal) segments, many of which show sudden reversals of slope. That cannot be land movement, whether you think land movement has been removed or not.
Further compilations of large numbers of tidal records over the past century show up and down motions of the rise rate that very much resemble global temperature — up 1910-1940, down 1940-1970, up 1970-2000. Not surprisingly, the ocean level is responding to surface temperature, and much of which originates in the sea surface.
Many tidal gauge records, including large compilation, show and increase in rise rate beginning about 1990, and the rise rate since then resembles the satellite data since mid-90s.
The “seasonal cycle” referred to by Menicholas below are the winter-summer cycles. Ocean currents also have regional, longer term cycles.
Why else would many tidal gauges give such variations in sea rise rates, including from tectonically stable regions?
Yes, there are gauge locations where sea level is falling or rising from local land changes or sediment compaction or fluid withdrawal. Many are obvious and avoided in data compilations. All sea level data also are corrected by 0.3 mm/yr for rising of ocean basin floor during past glaciation and its falling since the Holocene — both because of the weight of ocean water.
Consider the science as it is, not as you wish it to be.
I should add that for those living at a certain coastal location, it is what sea level is doing THERE now and what it may do in future, regardless of what sea level does somewhere else or globally.
“Actually, much of the variations in tidal gauge data is caused by local variations in sea level caused by e.g., currents, tides, temperature, etc. ”
No, wrong.
Even if you start out knowing nothing, all you have to do is take a careful look at the graphs to know this is false.
Right on every one of them it states that the values used to create the time series are “Monthly mean sea level with average seasonal cycle removed”.
No point in getting into the tortured grammar used here, but hey, what the heck: “…variations in tidal gauge data is caused by local variations in sea level…”
It is far closer to the truth to simply point out that you have no idea what the hell you are talking about.
Here is an extensive review paper on the subject (open literature), which gives references to other papers. Read for yourself what is done.
https://agupubs.onlinelibrary.wiley.com/doi/epdf/10.1002/2015RG000502
I presume those who commented “not” on my comment, has their own stated evidence that vertical land movement corrections are not made to sea level, or were you just blowing wind?
donb, epic graph reading fail. San Diego gauge shows ~25 cm in 118 years, equating to ~2 mm/yr.
“…A whopping 72 percent of Californians support the measure…”
How many will be around? Do they know the cost they will be footing…or that their children will be footing…or their grandchildren?
That cost will include lost employment as companies head for Texas. We just picked up a gun manufacturer here in WY, granted more for other stupid laws in CA.
At least that many have been convinced that free lunches do exist. You just have to get government to pay for them.
I almost hate to say this, but if 72% support the measure, then let them have it. It’s like Germany -the population supports renewable energy goals though it’s pretty obvious that it’s taking money out of their pockets.
Very true…there is no point whatsoever in trying to talk sense to any of these people, or to try and stop them.
The most sensible course of action is to insulate ourselves from the predictable effects of the policies enacted by these nincompoops.
My guess is they have no actual plan for implementation of what is required to meet the goals set forth by this law.
So the most likely thing that will happen is nothing.
We already know liberals feel no need to enforce any particular laws, so there is no reason for them not to spend their time voting on and passing what amounts to legislative virtue signaling.
And you know what? They may turn out to be right and the rest of us wrong. A lot can happen between now and 2045.
Give them enough rope and watch what happens. Problem is that they will claim it’s the fault of Bush or Trump.
You don’t actually have to be an engineer to teach engineering. Dr. Mark Jacobson is an academic. His career is devoted to pushing renewable energy. You don’t have to believe him because he doesn’t have the credibility of an actual engineer. link Academics aren’t held responsible for their work. Engineers are. Jacobson can bloviate all he wants and there’s no penalty when he’s proven wrong.
All we need is will power.
Will power and magic batteries.
Will power, magic batteries and some method to keep the sun shining at night.
For a moment, you had me worried MarkW. You see, it’s night time here, and the sun isn’t shining. Out of curiosity, I called my friend in Sydney Australia, and asked him if the sun is shining. He said it was. So MarkW, don’t worry, the sun still shines at night.
Not locally… 😎
. . . unless one happens to be at higher latitude than either the Arctic Circle or the Antarctic Circle, in which case the sun will shine for at least one full 24 hour period.
Let’s keep out facts straight.
Only one day a year? 8<)
You’ve just given me a brilliant idea. We could cover the Arctic and Antarctic with solar panels. Put them on ice, which is plentiful, during their winters and then blast the world with free electricity in the summer months.
A minuscule percentage of the power could be used to melt channels such that intrepid adventurers could kayak to both poles unimpeded.
Do I get a prize?
Well at the poles, one can look forward to 6 months of twilight/sunlight followed six months of twilight/darkness. Those long nights are a killer . . . it is relatively warmer at the Arctic and Antarctic Circles.
Only one day if you are right on the edge of the Circle. By definition.
But there is (almost) no sea ice at the Arctic Circle’s latitude! The land ice is not melting over Greenland, and has melted completely away across the Alaska-Canada-north Europe-Russia path.
Remy, I thought for once you had decided to say something intelligent.
Did your “friend” in Australia happen to have a 13,000 kilometer cross-Pacific extension cord, rated at 380,000 volts? If not, it doesn’t matter where the sun is shining elsewhere.
Is Australia supplying power to your country? If not, does it matter if the sun is shining in Australia as you type on your computer?
It gets really cold in Alaska, but the heat on Venus doesn’t seem to make much difference to the warmth of a home in Alaska.
I’m gonna try driving to work this week on will power.
They might actually get the rail line to Fresno by then, depending on the rate of increase of cost overruns to their supporters.
My sister and I have an abbreviation for all things crazy — “cra” (pronounced with a hard “c” and long “a”). Thus, people can be “cra”, … events can be “cra”. USED IN A SENTENCE: John jumped off the roof naked smoking a pipe –he’s cra.
I hereby petition that the abbreviation for California be changed from “CA” to “CRA”. Hence, for example, “Los Angeles CA” would become “Los Angele CRA”.
California is doomed. They are going down the same path as Venezuela in the same way. Like Venezuela, they are voting for this, often even enthusiastically. Remember, Venezuela was the most prosperous country in South America, and it only took 10 years of “Chavisimo” to destroy it. Their economy is destroyed, prosperity has been replaced by famine, and millions are fleeing to neighboring countries, creating a real refugee crisis. All the while the US mainstream media studiously ignores the biggest ongoing story in the western hemisphere.
This is California’s future. There will be no turning about, there will be no realization, there will be no “Road to Damascus” moment. The people are willingly doing this to themselves. Disaster ensues. When it hits, the people who caused this will have no idea what happened, or why.
The two videos with Sean Hannity were gripping. There is no disguising the sheer malevolence of the Obama White House for their part in turning off the water to the San Joaquin Valley, and laying waste to the most productive agricultural area in the world. I find is amazing that some people still say nice things about that man.
I think all alarmists should move to California and get on Jerry Brown’s CAGW Bandwagon. There are lots of windmills to be built.
. . . or tilted at, as the case may be.
David
Outstanding post
TKS
Bob Hoye
Yes, very interesting perspective comparing Texas’ approach to water shortages compared to that of California.
My take is that California needs to shoot itself in the head point-blank with the climate change cult mass suicide.
Electricity prices through the roof, as in > 30c/Kwh when the rest of the nation is below 15c/Kwh. Gas prices above $6/gal while the rest of the nation is ~$3/gal. And Increase income taxes as well… again. Increase business income taxes too. Give all it to the flat broke union retirement funds. Claim it is for climate change.
America needs to see what a Climate-Venezuela looks like.
California’s drought woes are well established. They’re getting ready to start drinking purified sewage. However Diamond Valley Reservoir was completed in Southern California in 2003.
I live ON the CA coast. All’s quite well, thank you.