In the last couple of weeks, record highs have been set around the U.S., particularly in the Los Angeles area, which I did a lengthy debunking of. Records were also set in Scotland, then denied by an errant Ice Cream truck, and also questioned in Africa. Josh is on the case to illustrate the one common denominator to all these high temperature records we’ve discussed here on WUWT.

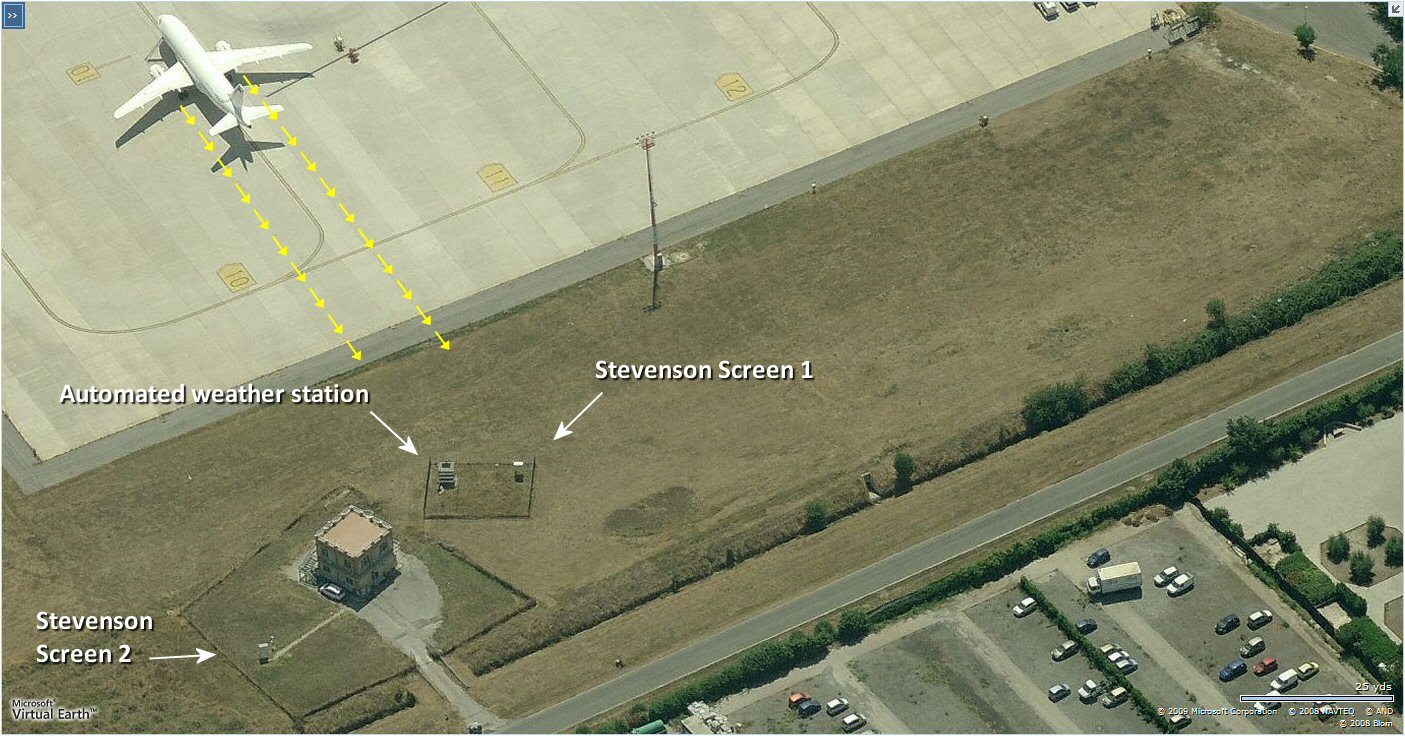
For people who don’t believe this, or think we are just “making stuff up”…here’s the official weather station at the airport in Rome, Italy. I wonder if the Pope has seen this?
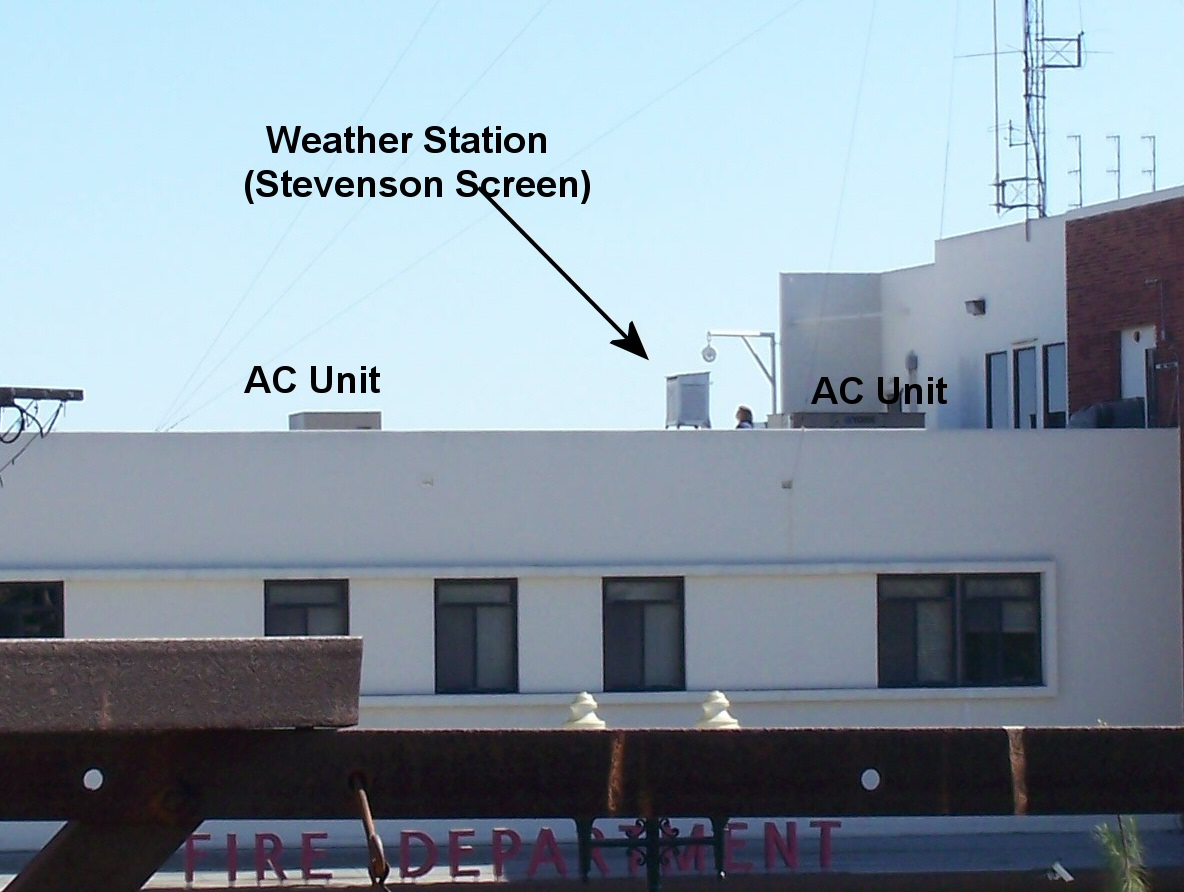
And here’s an official NOAA weather station on a rooftop in Santa Ana, CA

Just a short note to readers- Josh has done hundreds of climate related cartoons over the years, and never charged me a dime for them. He’s advanced our viewpoints via humor, and for that we owe him a debt of gratitude. I suggest you buy him lunch or a beer, by going here to his tip jar.

PayPal or credit card accepted.
Thanks, Anthony
Update 9th Aug 2018 from Josh
Many many thanks to all who have donated in the last few weeks – you have been amazingly generous and it is so encouraging to recieve any funds at all! Thank you so much,
all the best,
Josh
I watch LA news and weather report each night and with the exception of a few days, which were hot but not unusual for July (records claimed but not fact checked), and most days have actually been cooler than usual. Certainly nothing to get excited about.
Reminds me of The Storm Channel reporting.
This time of year they love to throw up a map of the US with a dozen or so places where a record high might be broken tomorrow.
The next day, not a peep about how many of those, if any, didn’t have a record high.
But their forecast served its purpose.
They just want to imprint the impression upon the viewers that, somehow, the weather is different now because of …
Reality outstrips parody?
Done and thank you Josh!
Troposperic temperatures. Nothing to see here where the greenhouse effect is supposed to occur.
The cartoon says “The Best ones don’t exist so we make up the temperatures.”
It’s been a while since that particular sore spot was visited, newer readers here may not realize that some egregiously poorly placed stations have been shut down. However, to keep the record continuous, they have been replaced with temperatures derived with data from other stations.
That and other adjustments are described at https://wattsupwiththat.com/2014/06/29/noaas-temperature-control-knob-for-the-past-the-present-and-maybe-the-future-july-1936-now-hottest-month-again/ and posts linked to from there.
Is Marysville still producing estimated data? It was closed in 2007.
“However, to keep the record continuous, they have been replaced with temperatures derived with data from other stations.”
This refers to the process of USHCN, which was replaced in 2014. The Santa Ana Fire Station Co-op was not in USHCN, and is not in GHCN.
The Ciampino Airport, pictured here, is in the historic GHCN database, but the last data included was in 1970. It is not one of the stations for which Italy submits CLIMAT forms to WMO. Data since 1970 has not been used in GISS or NOAA temperature indices.
Dang Nick, you are not cherry picking, you are nitpicking. If you are going to believe in the orthodoxy, that is your choice. People defending bad data or bad data collection methodology start from a position of weakness in trying to make their point. Long before Anthony did the review of weather sites I knew that the data for many sites was bogus. That he took the time to do the survey is what brought me to this site. In my area two stations were moved. One, close to the airport, was moved from a low lying area farther from the runways to a much higher area closer to the runways. If you didn’t know better or our local environment you would understand that it made a difference. Suddenly winter low temperatures were higher as were summer high temperatures. Yet the data set is treated like it is from exactly the same spot, using the same instruments. No one bother to compare the two prior to the move so there could be in reliable correction.
“Yet the data set is treated like it is from exactly the same spot, using the same instruments.”
Actually, the usual complaint here is that scientists adjust for such changes, if they do use the data. But the key thing here is that people take temperatures for all sorts of purposes. They aren’t generally designed for use in climate science, and some aren’t suitable for that. So the key question is, are those data used in climate science? That is why inclusion in datasets like GHCN, where they would be used, is important.
“The Global Historical Climatology Network (GHCN) is an integrated database of climate summaries from land surface stations across the globe that have been subjected to a common suite of quality assurance reviews. The data are obtained from more than 20 sources. Some data are more than 175 years old while others are less than an hour old.”
What quality assurance existed 175 years ago? LOL
@Edwin
The term for which you are seeking is “Nickpicking” 🙂
And they’re all perfectly accurate and have infinite resolution, don’t they Nick.
Nick,
Some the Ciampino Airport has been around since 1916, are you somehow suggesting that the possible corruption of temperature data is not worth documenting since the “last data included was in 1970”?
There is no indication that the current arrangement was there in 1970. Commercial jet engines were fairly new then, and the runway has likely been extended, probably several times.
The second-ever crash of a commercial jet aircraft was BOAC Flight 781 which crashed soon after departing Ciampino Airport on January 10 1954.
Nick, WHAT??? Commercial jet engines were fairly new in 1970???? Relative to what? Boeing 707 flew in 1959. 727 were flying in 1963. Business jets like Lockheed Jet Star flew in 1957 and the famous Learjet in 1963. In 1968 and 1969 alone I had flown probably ten times in 727s. Lockheed Electra, a prop jet was flying by 1957. DeHavilland Comet was flying commercially in 1952. Most of the wide bodied jets, e.g., 747, went into service in 1970 by then jet travel all over the world was well established.
According to http://www.geog.ucsb.edu/~joel/canorm.pdf , there is (was) a Coop station at Marysville – 045385 XNP MARYSVILLE 39 09 N 121 35 W 57 and a Coop station at Santa Ana – 047888 XNP SANTA ANA FIRE STATION 33 45 N 117 52 W 135.
Those are very different locations, I was referring to Marysville.
According to old USHCN data at https://data.giss.nasa.gov/cgi-bin/gistemp/find_station.cgi?d=1&ds=1&name=Marysville , the station there was
I don’t know what that ID is.
From http://www.surfacestations.org/ushcn_stationlist.htm – 39.1457700 -121.5858500 5 45385 MARYSVILLE 0.5 NNE CA 39.15 -121.60 74500003 – says USHCN ID 45385 and GHCN ID 74500003.
There’s no entry for Santa Ana, so I’ll accept that it’s a Coop station and not a USHCN/GHCN station. Why did you mention it?
So Marysville does appear to have been a USHCN and GHCN station, though as you and the GISTEMP link above note, it was “retired” in 2007. The news was reported here in https://wattsupwiththat.com/2009/06/10/an-old-friend-put-out-to-pasture-marysville-is-no-longer-a-climate-station-of-record/
However, my point was that temperature data from Marysville was still being reported in 2014. I’m glad to hear it is not making it into GHCN data, though I haven’t tried to verify that. From that 2014 post:
My apologies for saying Marysville was in USHCN. Oh wait. I said:
Excuse me while I go see who made the first mention of USHCN here.
I wonder which homogenization routine can fix poor sitings.
In my view there are none.
Prove me wrong – please.
These stations are not in any dataset which is homogenized for climate use.
AGW is over Nick.
Dear Mr. Salvatore ‘cooling is here’ Del Prete,
You continuously over the years bring up your talking point ‘warming is over’. This is stubborn, as there is no detectable change in the trend. People often say that the last El Nino bumped temperatures up, and it is now fading. Fading or not, the temperatures after faded El Nino are still a bit higher than they used to be.
Would you mind prognosticating less and observing more? Just asking.
And folks, I’m not trolling you. It is just that people who claim cooling when there is more or less linear warming over decades over more or less noisy background variation, don’t sound very sensible. It is a fun sport to try to guess future, maybe bet on it, but saying the same opinion over and over again against what we observe in UAH, GISS, RSS, etc. despite, of course, the continuous tuning they get, won’t get my thumb-up.
The AGW is not over, but it seems to be less a problem than J.E. Hansen said 30 years ago. What I suspect at the moment is, that the CO2 factor is much overestimated, and possibly some other gases have been underestimated. My gut feeling only, though.
Yes AGW is over, but it never existed in the first place . You have to look at my web-site climatebusters.org and you will see I based the cooling if certain solar conditions were to take place . I thought those solar conditions were going to take place earlier. Finally in late 2017 they started to come in and this is why I have called for year 2018 to be the transitional year for the climate .
What doe EL NINO(natural event ) have to do with AGW?
AGW is probably not over. But why does that point to the existence of CAGW?
According to the UN the world population has grown from 3.02 billion in 1960 to 7.53 billion in 2017.
Average wealth has also increasedsignificantly. More eneergy is being used gloabally. Irrespective of how this has been generated, temperatures are bound to have risen as a biproduct.
Whether such a rise is signifcant or not compared to increases in temperature from natura causes is a natter for discussion.
Solomon Green – July 14, 2018 4:26 am
And anthropogenically emitted CO2 has been increasing exponentially.
I compiled the following statistics via reliable sources, to wit:
Increases in World Population & Atmospheric CO2 by Decade
year — world popul. – % incr. — Dec CO2 ppm – % incr. — avg increase/year
1940 – 2,300,000,000 est. ___ ____ 300 ppm est.
1950 – 2,556,000,053 – 11.1% ____ 310 ppm – 3.3% —— 1.0 ppm/year
1960 – 3,039,451,023 – 18.9% ____ 316 ppm – 1.9% —— 0.6 ppm/year
1970 – 3,706,618,163 – 21.9% ____ 325 ppm – 2.8% —— 0.9 ppm/year
1980 – 4,453,831,714 – 20.1% ____ 338 ppm – 4.0% —– 1.3 ppm/year
1990 – 5,278,639,789 – 18.5% ____ 354 ppm – 4.7% —– 1.6 ppm/year
2000 – 6,082,966,429 – 15.2% ____ 369 ppm – 4.2% —– 1.5 ppm/year
2010 – 6,809,972,000 – 11.9% ____ 389 ppm – 5.4% —– 2.0 ppm/year
2017 – 7,550,262,101 – 9.80 % ____ 407 ppm – 4.4% —– 1.8 ppm/year
Source CO2 ppm: ftp://aftp.cmdl.noaa.gov/products/trends/co2/co2_mm_mlo.txt
Based on the above statistics, to wit:
Fact #1 – In 77 years – world population increased 228% – CO2 increased 35.7%
Fact #2 – Atmospheric CO2 has been steadily and consistently increasing at a rate of 1 to 2 ppm per year for the past 77 years, …… whereas human generated CO2 releases have been increasing exponentially every year for the past 77 years.
Fact #3 – Global Temperatures have been steadily and consistently increasing a few hundredths or tenths of a degree for the past 77 years, ……. whereas human created infrastructure, housing, vehicles, etc. (Heat Islands) have been increasing exponentially every year for the past 77 years.
Conclusions:
Given the above statistics, it appears to me to be quite obvious that for the past 77 years there is absolutely no direct association or correlation between:
Increases in atmospheric CO2 ppm and world population increases.
Increases in Average Global Temperature and world population increases.
Increases in Average Global Temperature and Heat Islands construction increases.
Increases in Average Global Temperature and atmospheric CO2 ppm increases.
Were they ever?
How about providing a list of data-sets which are used now? And from when.
PS These numbers all are from NOAA. They are from their lists of records highs/lows for Columbus Ohio but the lists are from different years. (Captured at the time.)
Who knows what the numbers that weren’t records used to be.
Which set of NOAA numbers are used today?
“Which set of NOAA numbers are used today?”
The NOAA has lots of numbers on its site. What you need for any of this to make sense includes:
1. Which dataset are you talking about?
2. Which station/s? Are they the same?
https://web.archive.org/web/*/http://www.erh.noaa.gov/iln/cmhrec.htm
https://web.archive.org/web/*/http://www.erh.noaa.gov/iln/cmhrec.htm
I could just put in what I copy/pasted at the time, the “raw” data for those years. (plus a few additional years)
These are NOAA numbers. Don’t you trust them?
Ask them to answer your deflections.
PS A year or so ago I made a similar comment with the links and you admitted that the numbers had been changed as I said.
Which set of numbers are the valid records for Columbus Ohio?
What was done to the non-record values?
Here’s what they say now.
https://www.weather.gov/iln/climate_records_cmh
“deflections”
These are basic matters of fact that anyone needs to know before making sense of your data.
In fact, from your link, it is a composite set of records for the Columbus area, posted on a site of the Eastern Region Headquarters of the National Weather Service. It isn’t a single location. And it comes with this warning:
“This station’s record may include data from more than one, possibly incompatible, locations. It reflects the longest available record for the Columbus Area.”
It’s quite possible that they changed the set of locations between postings. But this is a long way from climate science.
Odd.
The 2002 list has the same warning as the 2007 list yet there were no new records set.
And just how is evaluating/questioning the values going into the data used in climate science a long way from it?
Maybe you mean a long way from “climate seance”? (Ever hear of trea ring readings?)
“And just how is evaluating/questioning the values going into the data used in climate science a long way from it?”
Because you need to show that the data is actually used in climate science.
I can’t imagine that a page of daily records for a city area would have any use in climate science. But if so, then the ERM of the NWS is not the place to look.
Nick, the numbers are from NOAA via NWS. NOAA numbers are not used in “climate science”?
These changed records are pulled from the rest of the numbers that weren’t record highs or lows. How were the non-record numbers also changed?
So are you saying “climate science” ignores temperature data from cities that NOAA puts out?
The temp numbers have been changed. The changes to the record temps for my little spot on the globe is just the tip of the iceberg.
“But this is a long way from climate science.”
Most things are a long way from “Climate Science” TM
Aren’t they included in BEST? BEST was definitely used for Climate use\propaganda.
And in the Climategate emails Phil Jones admitted that much of the Southern Hemisphere temperature data was largely made up. Was this data not used for climate use\propaganda?
“Phil Jones admitted that much of the Southern Hemisphere temperature data was largely made up”
No, he didn’t.
I can’t see any indication that BEST uses Ciampino. They do have Santa Ana data, but it stops in 2013.
Most know best is not really best…
Well, lets see the figures you think are best. Have at it.
It appears that the references was not to GHCN stations, but “normal” sea surface temperatures before drifting buoys (ARGO, I assume) provided more data for this century.
It appears that data was used in climate comparisons, I’m not aware if it was used from propaganda.
From http://di2.nu/foia/foia2011/mail/2729.txt :
date: Wed Apr 15 14:29:03 2009
from: Phil Jones
subject: Re: Fwd: Re: contribution to RealClimate.org
to: Thomas Crowley
...
      Tom,
        The issue Ray alludes to is that in addition to the issue
      of many more drifters providing measurements over the last
      5-10 years, the measurements are coming in from places where
      we didn't have much ship data in the past. For much of the SH
      between 40 and 60S the normals are mostly made up as there is
      very little ship data there.
        Whatever causes the divergence in your plot it is down to
      the ocean.
        You could try doing an additional plot. Download from
      the CRU web site the series for SH land. It doesn't matter if
      is from CRUTEM3 or CRUTEM3v (the former would be better). If that
      still has the divergence, then it is the oceans causing the
      problem. What you're seeing is too rapid to be real.
      Cheers
      Phil
The full Email, a dialog with Phil Jones, Raymond Bradley, and Thomas Crowley is worth reading for additional context and information.
“but “normal” sea surface temperatures before drifting buoys (ARGO, I assume) “
Not ARGO. And it is a specific term, “normals”. Not data. The issue is that they have a whole lot of good new temperature data from drifters, but to form anomalies, by the normal convention, they need an average for the base years, probably 1961-90. These are the “normals”. The purpose of forming anomalies is to subtract out the variation due to geographic variation in the mean. It is best to subtract out the exact mean for the prescribed period, if you have it, but if you don’t, then use the best estimate that you can get.
In fact, the method that BEST and I use doesn’t require a prescribed period. You can use the mean of the data that you have, as long as you then correct for the different periods of measurement that different locations have.
In the last couple of weeks overall oceanic sea surface temperatures are down, Antarctica is having wicked cold, as well as South Africa. In the meantime the Arctic N. of 80 degrees latitude has below normal summer temperatures and to top it off year 2018 is running colder then year 2017 with the month of July to make that difference even more apparent.
As I have said for many months this is the transitional year. Say goodbye to the fake AGW.
Low solar moderated by a weakening geo magnetic field should result in overall sea surface temperatures to keep trending down, while the albedo should increase slightly.
“couple of weeks”… Yeah, and it is freaking hot here.
There’s no point in telling where the cold spots happen to be now. I believe the Arctic is not going to loose ice extent / area this year, but keep pretty stable. I’d like to bet on the next year, that would be fun.
That cartoon jet needs “DiCaprio” on it..
Anthony deserves thanks for this http://surfacestations.org/ .
If I remember correctly, he believed Hansen way back when. Then a mentor he trusted gave him a tour of a few of the sites providing the data Hansen was using.
Eyes opened. Much, much of the data was bogus before it was ever recorded.
Some think a computer program can “fix” bogus data. Or even supply valid data that a nonexistent station would have provided if it did exist.
Garbage In/Bullshit Out.
(I think I’ll be in moderation for a bit. 8- )
PS Don’t be awed by computers. They are just very fast calculators. They can add and multiply faster than we can but, if the wrong button is pushed or the “formula”, the program that processes the numbers is in error, the result is in error. (HarryReadMe)
PPS Much of the data (see http://surfacestations.org/ ) used and available today has passed through a computer and the hands of those that programmed it.
Anthony deserves thanks for this http://surfacestations.org/ .
Agree, but I wish he’d reopen the gallery so we could tidy up the few stations we never got to. I need an excuse to visit New England….
Agree. I just noticed recently that the link isn’t on the sidebar anymore.
(Or maybe I just missed it.)
A possibility is that, with the new system, the address begins “http” and not “https”?
PS It can still be found. I found them under “About” on the title bar.
Click “About” then “Publications and Projects” on the drop-down menu.
Done, Josh, and thanks! (Had to look up dollars to pounds conversion first.) 😀
To Nick Stokes – read Harry_Read_Me.txt (http://di2.nu/foia/HARRY_READ_ME-1.html) then come back with your arguments about how good the records are – ANY records whether used for GHCN /USHCN or not.
I guess they have since learned how to drop data that does not show warming. Every time the temp goes down too much, split the record 🙂 You can automate that process using an algorithm, and it is complex enough that you can fool yourself first.
That link goes to a part 1. It has a link to an index which goes to part 20!
The real index is at http://di2.nu/foia/HARRY_READ_ME-0.html
I have the raw file at http://wermenh.com/climate/HARRY_READ_ME.txt
Given how important the issue is claimed to be and the vast amount of money the area has attracted , you would think that the creation of a really first class world wide and scientifically value data collection system would have been a priority . Instead of falling back time and again onto the ‘better then nothing ‘ approach which is seen .
If the will was there just how hard would it be , so you have to question why the will is not there ?
Please pardon my psychotic, conspiracy theory: The powers that be KNEW we were in a natural warming cycle. One that was cycling up to its apex. They further KNEW cooling was imminent, in a few decades, if not years. The “Conspiracy:” 1) scream CAGW and imminent doom 2) impliment The Cure ( more big government taxation and control + less energy generation ) 3) take credit when the cooling arrived…
The issues of contamination by poorly sited stations were thoroughly dealt with in the BEST project.
There is a robust warming trend, even with poorly sited stations excluded.
I think Mosh said the more data they got, the more warming they got. Always.
I raised my eyebrow. Doesn’t sound right.
Nope. At least one remains.
BEST’s problem is that they didn’t exclude all of the classes of “poorly sited” stations.
PS But BEST, unintentionally, does show that we don’t really know the past Global Temperature.
(Did they drive their DeLorean back to check all of siting conditions way back when?)
Goodonya Josh. A little bit forwarded and done with pleasure, and with thanks, for your quality work
Well, I don’t know nearly as much as Nick about this issue, but it seems to me that the issue is pretty straight forward. There a lots of sites. Some are very good. Some not very good. Some not intended to produce data for the study of long term climate.
I find this notion of wanting to wipe from history the records from sites that may not be useful for climate study rather odd. What if you want to look at the weather conditions over time at airports? How are you going to do that if the sites aren’t recorded? What if you want to study the effects of UHI?
That’s a different issue to whether you use such a site for other purposes.
Let me point out that an airport weather station that produces good climate data is a flight safety hazard. It is intended to produce temperature, pressure and wind data for safety-critical performance calculations. These depend on conditions over the runway, not regional climate.
So what does the rear, ie start, of the runway got anything to do with the point of takeoff conditions…esp. With jet exhausts..
People don’t use the high or low temperatures at the end of the runway, nor the anomalous spike from exhaust heating, they use the current temperature of the area, i.e. the temperature that goes into air density and lift calculations.
Macha
“Approach End” is the phrase you are looking for.
“So what does the rear, ie start, of the runway got anything to do with the point of takeoff conditions”
Which end is “rear” depends entirely on the wind direction.
TTY
Good point. AWOS/ASOS WX Stations at local airports are certified by the FAA to collect “Aviation Weather” for use by the Aviation Community.
They may or may not be useful for Climate Data. That would be a decision for NOAA.
Alarmists want to wipe the stations that made records very long time ago. The more they get wiped off, the more warming we’ll get.
Yeah, but if you’re actually going to decide how things should be done, that isn’t very useful.
I mean, honestly, it’s more of a political point scoring rally call than an actual useful statement about science.
Odd? Nothing odd about it. This is how doubt-mongering works. Identify an element which seems equivocal then paint the whole thing with the same brush: so ya just can’t trust any of it. The same tactic is employed in the effort to undermine peer-review. The hypocrisy is monstrous – blatent politicization and accusing Climate Science of being politicised.
It would be odd for a doubt-monger not to be muddying the waters like this.
So on the debunking thread I tried to suggest some of those bad stations could still have a record high for that station. But I forgot about the air conditioner. In the 2-D picture it appears it’s right under the Stevenson screen. If it is, that location isn’t giving you anything related to weather, it’s basically just an on/off data logger for the A/C unit!
Science experiment.
1. Place our cell phone and a thermometer on the dash of your car, with the car facing south, on a warm (over 80 D F) day. CAUTION use a throwaway phone.! It is highly likely this will RUIN your phone.
2. Every ten minutes go back to the car and try using the cellphone.
3. At what temperature does the cell phone quit working?
Explanation, While in the Navy I Calibrated sensitive instrumentation to assure it was NBS raceable (now NIST) used to repair and calibrate other electronic equipment. This process required that the calibration lab be maintained within a narrow specified temperature, atmospheric pressure and humidity span. The actual values of each of these parameters was recorded on the calibration report, documenting the state at which they were calibrated. During an air conditioning failure the temperature in the lab was more than ten degrees above specifications. To see if this had any effect I measured the voltage of a “Reference Calibration Standard.” It was off calibration by more than 0.5 %. The same thing is happening to all of the electronic Weather Station equipment. Just because the reading is displayed with 3 or 4 decimal point digits does not mean it is Accurate to three or four decimal points, even one decimal point.
Actually, at airports, measuring the runway temperature (or close to it) is important since it affects aircraft performance — particularly for takeoff. It just shouldn’t be used to measure temps for climate analysis.
Here in Meeamee, Florida , the official 2pm daily high temperature recorded at Miami International Airport , one of the busiest in the world, is always at minimum , ten degrees warmer than the temperature reading , under a shady tree, in my back yard.
Donated for the Hot Air Arrow pointing at MM.
Given that the polar regions are covered by a scant few weather stations, I’ve always been suspect that these stations are near research camps that have a large “heat island” signature.