From the “anything hot goes” department and the Washington Post’s Capital Weather Gang comes this pronouncement of an all-time high temperature record that may be little more than wishful thinking, much like the recent all time high in Scotland that turned out to be polluted by an idling vehicle producing hot exhaust near the temperature sensor.
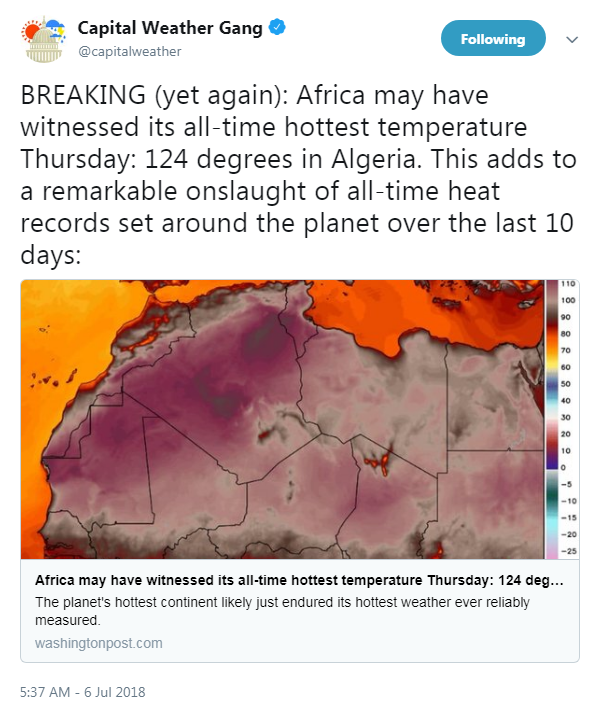
It started with this tweet Friday 07/06/18: (h/t to Mike Bastasch of the Daily Caller).
Africa may have witnessed its all-time hottest temperature Thursday: 124 degrees in Algeria
The planet’s hottest continent probably just endured its hottest weather ever reliably measured.
An Algerian city soared to 124.3 degrees (51.3 Celsius) Thursday, adding to the onslaught of records for extreme heat set around the planet during the past 10 days.
The blistering-hot temperature reading, observed in Ouargla, is probably the highest temperature ever reliably measured both in Algeria and in all of Africa. The record was first identified by weather records expert Maximiliano Herrera.
Ouargla, with a population of nearly half a million, is located in north central Algeria, roughly midway between Morocco and Tunisia.
Location of Ouargla, Algeria, indicated by red marker. (Google)
Its 124.3-degree temperature surpassed Africa’s previous highest reliable temperature measurement of 123.3 degrees (50.7 Celsius) set July 13, 1961, in Morocco.
First, the keyword here is “reliable”. More on that below.
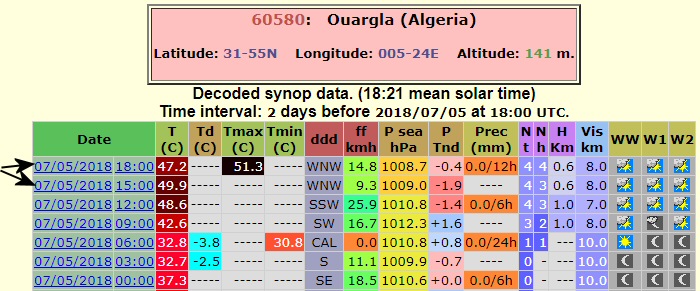
Second, the record is unverified as of this time. While the Synop data and data captured by Weather Underground both say it reached 124.3F (51.3 C) Thursday afternoon likely between 3PM and 6PM local time, it seems that even though this claimed record is being built up by WaPo as “big news” it has some real problems with it much like the rejected Scottish all-time temperature record.
Note that the 51.3C Tmax reading doesn’t show what time it occurred, but we can surmise based on surrounding data, likely sometime between 3PM and 6PM local time. Note also the winds during that period.
In the case of the Scottish record, the Met Office in the UK investigated and said:
“At first review the Motherwell record appeared plausible given the wider conditions on the day and was therefore reported as such. However for all new records we undertake further careful investigation to ensure that the measurement is robust. This investigation includes statistical analysis of the station data, evaluation against neighbouring sites, and in some cases an additional site visit to check for unexpected issues with the instrument enclosure or equipment to ensure the measurement meets our required standards.”
“Unfortunately in this particular instance we have evidence that a stationary vehicle with its engine running was parked too close to the observing enclosure and the Stevenson screen housing the thermometers during the afternoon of 28th June,” the Met Office explained.
“Although the measurement appears plausible given the weather conditions that day we cannot rule out the potential for contamination of the measurement by this non-weather-related factor,” officials wrote.
So, the issue was siting. Turns out it was an Ice Cream Truck parked nearby the station. Temperature was measured in the wrong place where an unexpected bias creeps in.
Third, The Algerian Met Office doesn’t seem interested. In the case of Ouargla you’d think the Algerian Meteorological Office HQ in Algiers would at least have a mention of “probably the highest temperature ever reliably measured both in Algeria and in all of Africa.”…but, they don’t. Either they are unaware, or don’t think it’s meteorologically/climatologically important. What I found below in #5 may be why they aren’t touting it.
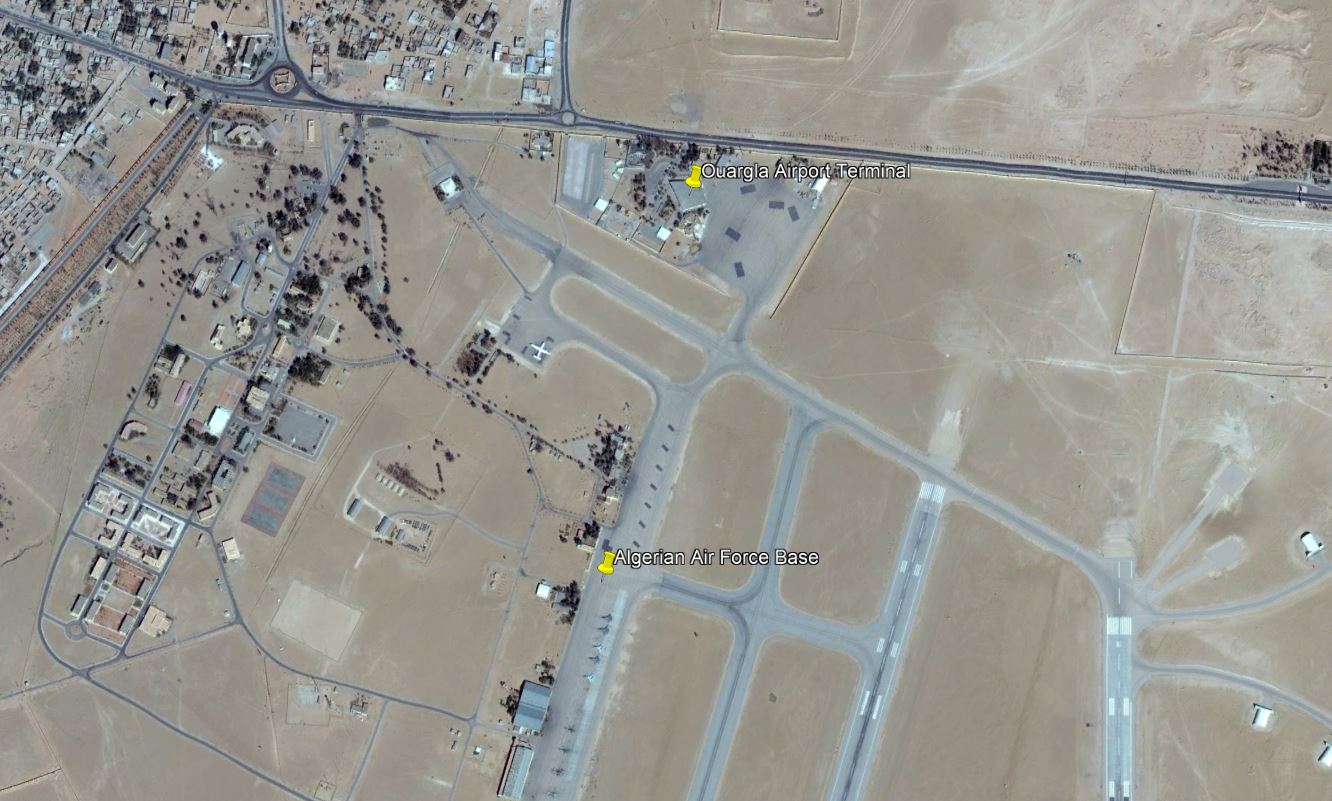
Fourth, the thermometer location is at an airport with a large military presence, right next to the tarmac. Based on hours of combing Google Earth and other sources, I have identified what I believe to be the weather station at Ouargla Airport (OGX) now known as Ain Beda airport (ICAO code DAUU). See the captioned photo from Google Earth below: (click to enlarge)
Ouargla Airport (OGX) now known as Ain Beda airport (ICAO code DAUU) Location of the terminal and Algerian Air Force Base are marked.
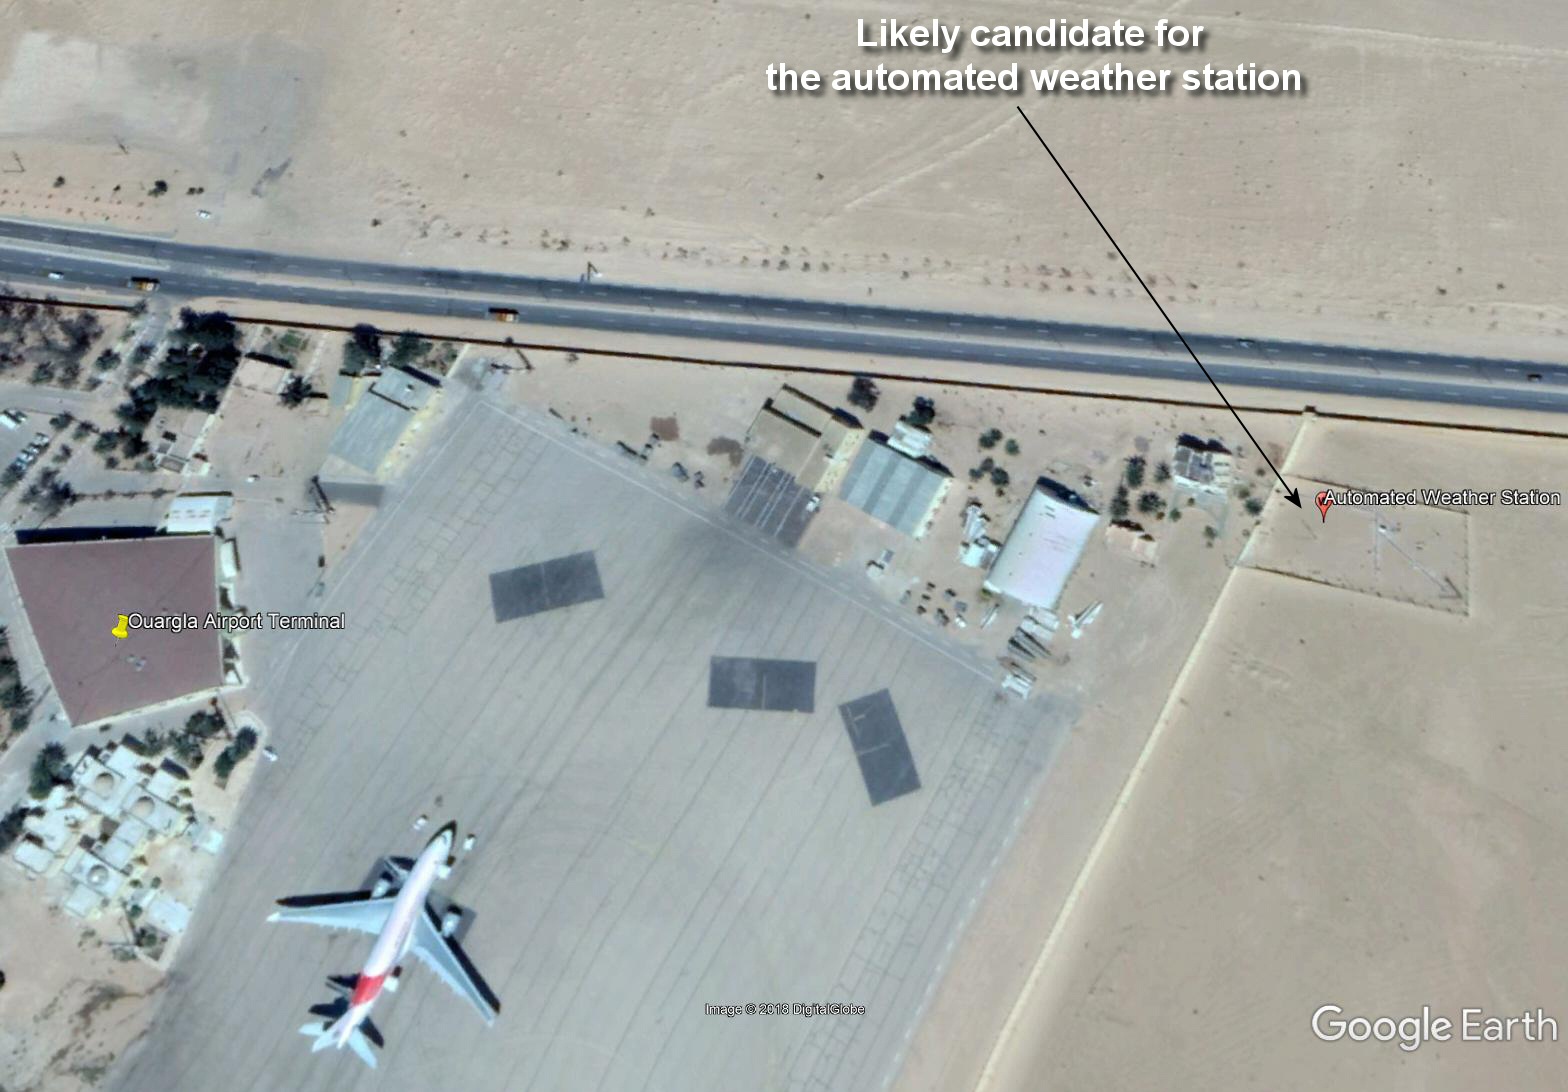
Here’s the closeup of the civilian section of the airport.
Airports are NOT good places to measure climate change or even record highs/lows. Why? they are dynamic places; jet exhaust, changing infrastructure, and constant energy use. Just look at the small area for the jet above, it has to make a 360 rotation and that spews jet exhaust everywhere.Does it affect the temperature sensor? Who knows for sure without a flight schedule to compare to the temperature record, but if the Met Office can disqualify an all-time high temperature record for an Ice Cream Truck parked nearby spewing exhaust, you’d think meteorological authorities would want to look at whether jet airplanes are doing the very same thing at Ouargla Airport.
Fifth, the airport is under construction at the moment. An extension/expansion of the public terminal facility is happening in 2018 as indicated by this article in 2017:
A project to extend the terminal of Ain El Beida airport in Ouargla will be launched in 2018, according to the director of transport of the wilaya.The technical studies relating to this operation have been completed and work will start in the course of next year…
So for all we know, since we have no Google Earth imagery past March 2018, the airport may be torn asunder, darkened earth may be exposed, changing the albedo, and therefore the ground influenced air temperature in full sun, or the thermometer may be moved and compromised in other ways. We won’t know until we get some on-the-scene photos.
Sixth, based on the location of the AWS (automated Weather Station) temperature sensor in March 2018 and wind data, the all-time African high temperature record may be a product of poor placement, wind, and heat transport (or jet exhaust).
I spent several hours trying to locate the temperature sensor. There were several possible candidates, and I’ve narrowed it down to one. Unfortunately, since Ouargla Airport is not a popular destination, and because there’s little ground photography available (likely due to the military base presence) I’ve had to rely on Google Earth only. Here’s what I found as the likely candidate:
Ouargla airport – best candidate for the automated weather station. Click to enlarge.
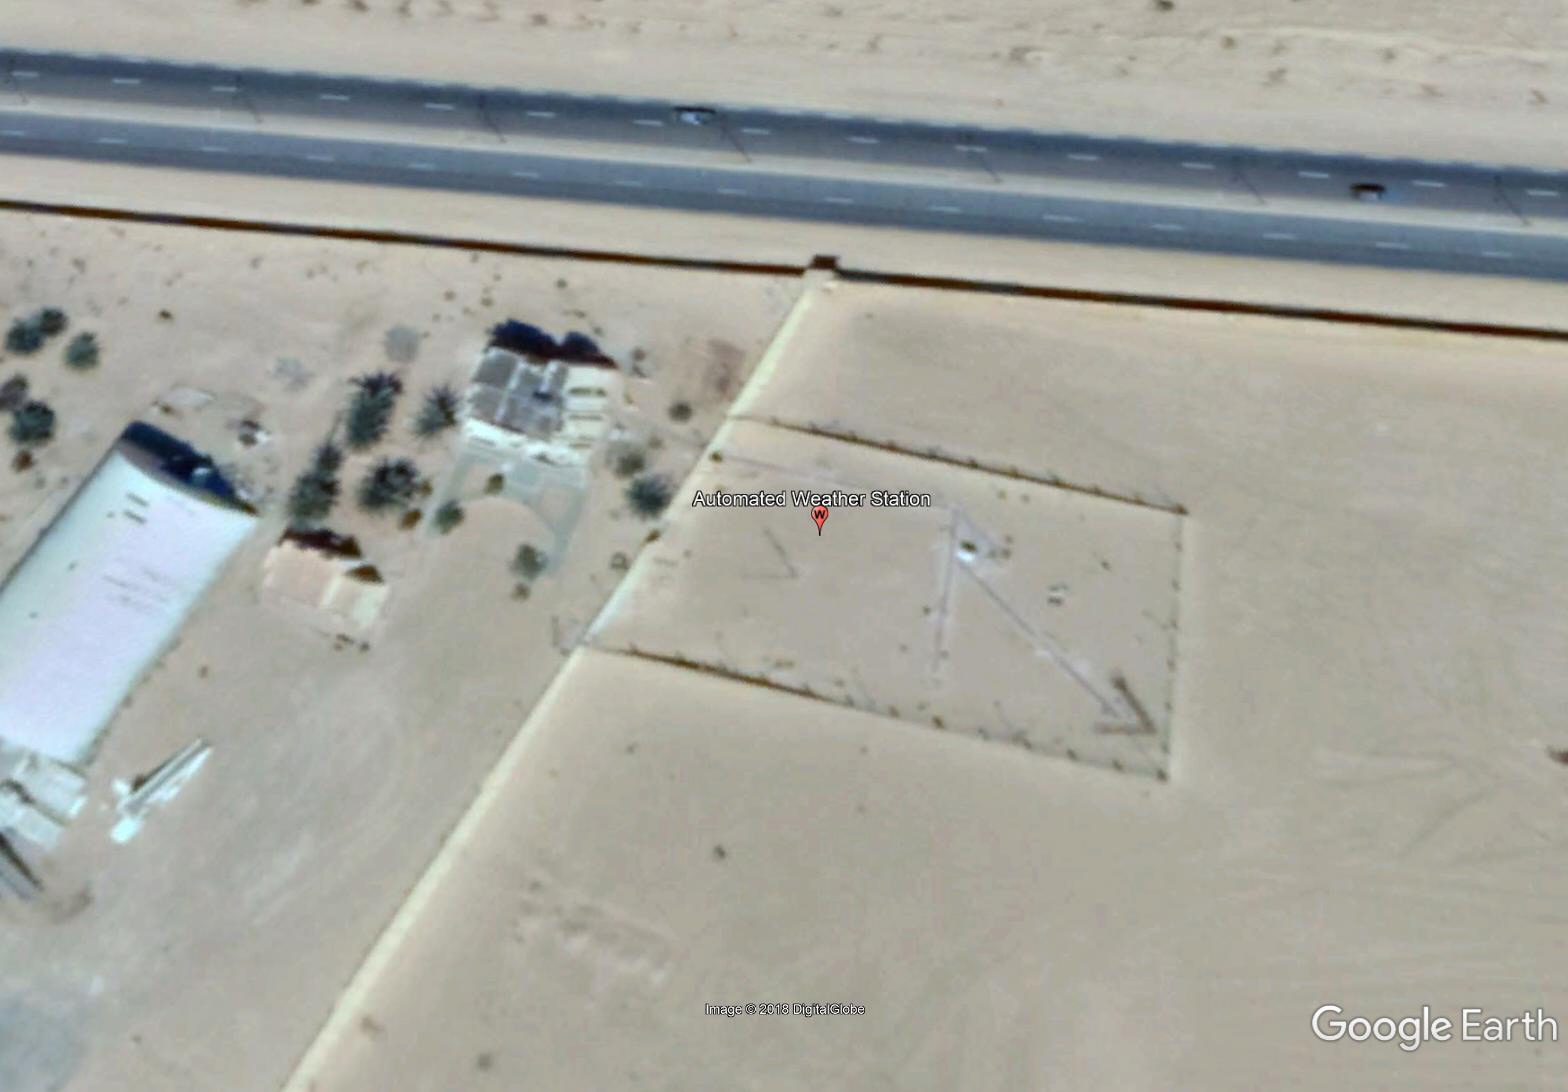
Here is a close-up view:
I looked at all sorts of structures and identified them, ILS radio towers, communication towers, floodlight poles, wind tees, wind socks, etc. and this small fenced in tower near the approach of runway 20 is the only structure that makes sense for the following reasons:
It’s near the terminal and admin building – shorter wiring distances to where the data is needed.
It’s a public facility, with public reporting of weather data, not a military weather station, so it makes sense it would be closer to the public area.
It is positioned in the runway approach area and is fenced in to keep people away. AWS are used for runway conditions, not climate, so makes sense where it is placed and fenced.
The tower is about the right height for an AWS, typically 10 meters (30 feet) for the anemometer/windvane, and the temperature sensors are almost always close to that sort of tower because they want all the readings at the same place.
Nothing else I observed in the entire area fits the bill for an AWS tower. Most all others are too tall.
So let’s assume that marker is the location of the AWS.
According to the SYNOP report, when the high temperature was set, it likely happened between 3 and 6PM local time based on other hourly Tmax data:
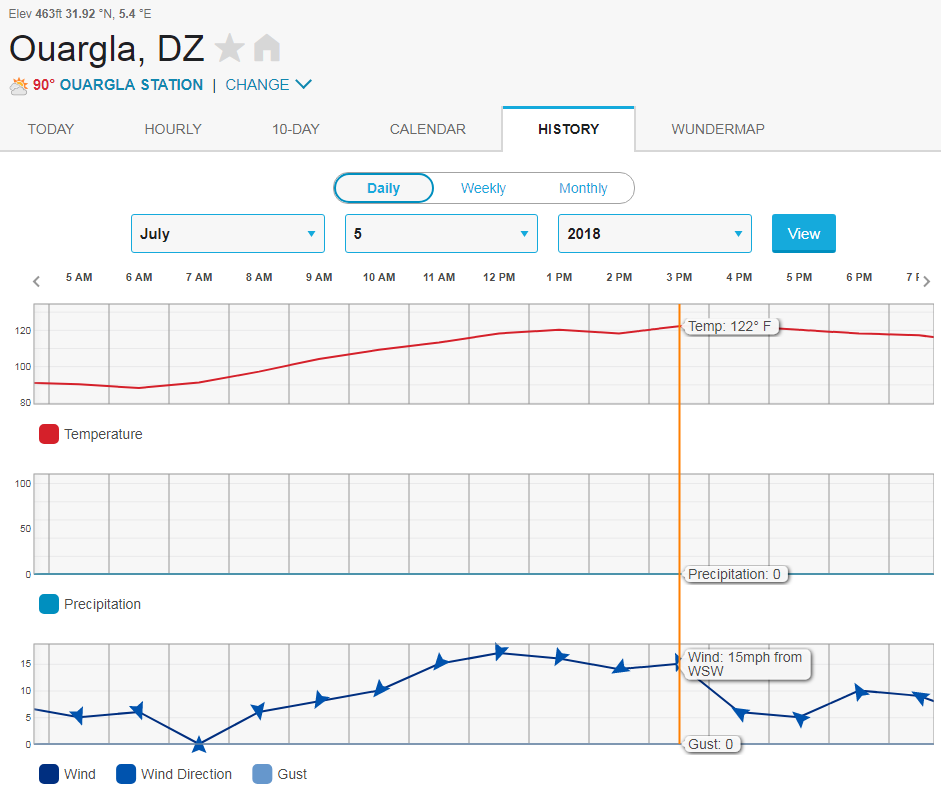
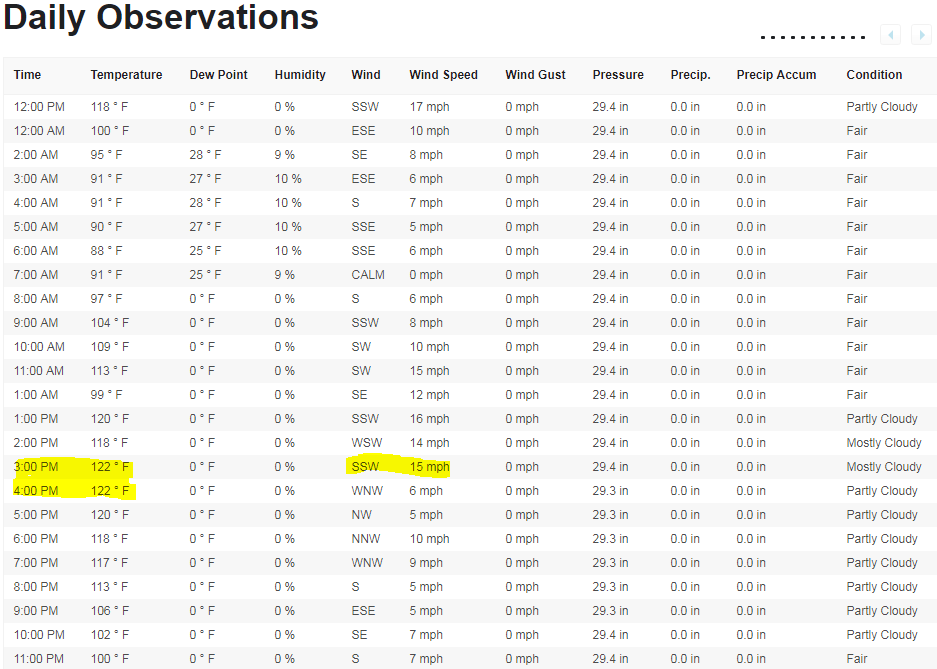
We can narrow the likely time of the 124.3F/51.3C Tmax down further with archived data from Weather Underground:
Note that at 2PM the temperature was gown down, but at 3PM it hit 122F (49.9C) and at the same time there was a wind shift to the WSW SSW with average wind of 15mph. 3PM is also about the time to expect peak solar insolation for that location, which leads to maximum ground heating.
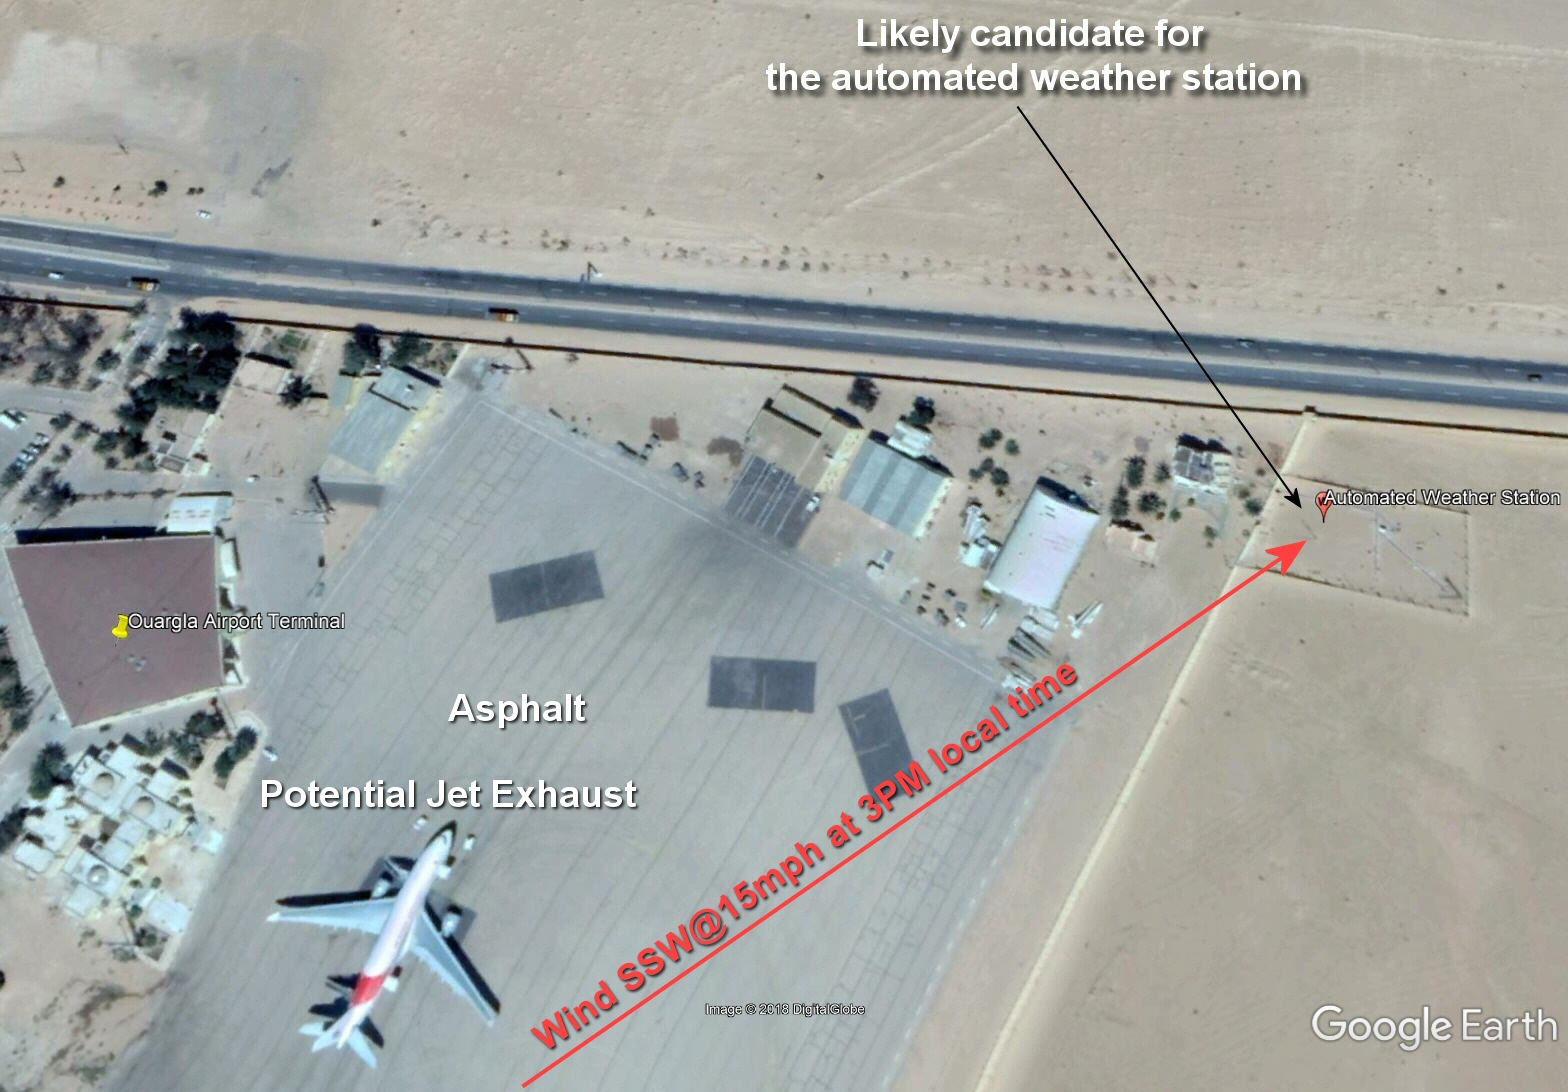
Assuming I have the AWS temperature sensor placement right, guess what is upwind of the AWS when the wind is coming from the WSW SSW?
That’s right, a big slab of asphalt tarmac and a big source of jet exhaust as seen below with my annotated Google Earth image:
One thing is for certain, with that wind direction, there was most certainly heat transport toward the AWS from the tarmac and terminal. I don’t know if there was a jet plane present and taxiing at that time or not, but if there was, the jetwash would add to the heat transport.
I believe that the Ouargla “all time African high temperature record” is based on artificial heating sources and heat transport by wind at the opportune moment and best direction for heat transport from the airport tarmac and/or jetwash.
I also submit it has NOTHING to do with global warming/climate change but is little more than a combination of a warmer than normal meteorological synoptic-scale event for the region, combined with poor thermometer placement and a wind driven heat transport event.
I welcome comments, and if anyone can get an “on the ground” confirmation of my theory, such as photos or videos, please share it in comments.
One final note. NASA GISS uses this station as part of the GHCN (Global Historical Climate Network) data provided by NOAA. After looking at the fractured record, and the above scenario, any sensible person would ask WHY?
Moral of this story: We shouldn’t rely on airport weather stations for anything to do with climate records. They are placed for aviation purposes, not for climate purposes, and are active energy sources, heat sinks, and unnatural/artificial terrain that is unrepresentative of the area’s climate.
UPDATE: A day after this post was published, a typo was noticed in the wind direction in the text (should have been SSW, not WSW) and was corrected in both the post body and the image with wind direction. The typo doesn’t change the conclusions of the essay.
00votes
Article Rating
118 Comments
Inline Feedbacks
View all comments
Bob Hoye
July 7, 2018 6:43 am
Good sleuthing!
dodgy geezer
July 7, 2018 6:47 am
…the recent all time high in Scotland that turned out to be polluted by an idling vehicle producing hot exhaust near the temperature sensor….
The Scots one would surely have been rejected anyway – a sensor in a car park with dumped rubbish all around it is not an accurate station…
commieBob
July 7, 2018 6:51 am
This adds to a remarkable onslaught of all-time heat records set around the planet over the last ten days.
Every year there will be a number of hot and cold records. The CAGW alarmists will report the hot records as if they are unusual. They aren’t.
The alarmists will ignore cold temperature records dropping like snowflakes. link I continue to be skeptical because I simply do not trust the alarmists to tell the whole unvarnished truth.
Dr. Michael Mann’s attempt to erase the MWP with his hockey stick turned me into a skeptic. Since then it’s been one sad piece of crap after another. The left wing and the MSM paint The Donald as a liar. He doesn’t hold a candle to them.
Bruce Cobb
July 7, 2018 7:33 am
I hear they make a mean salad there, in Ouargla.
What, you’ve never heard of Ouargla salad?
Pamela Gray
July 7, 2018 7:43 am
A record temperature during a modern warm period. Meh. A few tens of thousands years from now that record temperature at that location will not be detectable. It is likely the case that in past warm periods over the last 800,000 years, records would have been recorded as freqently as they have been now, were the technology available.
I thought I had seen a temperature of 56 °C in Ain Salah, and indeed that memory was good. In a google book scan of 1961 I found:
The Physical Environment and Agriculture of Morocco, Algeria, …
Michael Y. Nuttonson – 1961 –
… highest sun temperatures. In contrast to these great diurnal ranges, the annual range of temperature is not great and seldom exceeds 14° C. The highest temperatures ever recorded in Algeria are: 48° C. at Biskra, 54° C. at Touggourt, 55° C. at Timimoun, and 56° C. at In Salah … The low temperature records include -5° C. at Ouargla, -4° C. at In Salah, and -2° C. at Biskra. In the Sahara, as in northern …
Paul Sepe
July 7, 2018 7:59 am
> Ouargla, with a population of nearly half a million, is located in north central Algeria, roughly midway between Morocco and Tunisia.
Unless it’s actually quadrupled since the last census, this population figure seems to be wrong as well. (It seems that in their careful research, they’ve taken the entire province’s population for the city’s.)
In Seattle, they use SeaTac airport as the record of choice, regardless of what it’s doing all around it.
NOAA’s NCDC database puts the station at 47.4444°, -122.3138°, which on Google Maps puts it smack in the middle of all the runways. Just plug that number into Google maps and you’ll see it. The resolution on GM was too low for me to make out any individual structures, but there are several likely candidates.
I also looked at a little history. I looked at the June data for 1948, and 2018. not a lot of difference just eyeballing it. At the bottom of each generated PDF of the historical data it has a Summary field, which I assume means average.
Here are the max/min averages for the month.
        Max     Min
1948:   72        52
2018:   72        53

Looks like the equipment changed from Coop to
ASOS in October 1996. So let's look at June 1997

1997:    67       52

And the big El Nino year of 1998:

1998:    68       52

And the El Nino of 2016

2016:    73      54
What does it mean? Probably nothing. But I’m sure not scared by it.
This so clearly brings into question the ultimate meaning of a “global average temperature”.
With humans occupying much of the land, how is it that we can disqualify human cities from being places to measure temperature? Are cities not where humans live MOST OF THE TIME ? Are temperatures of cities and temperatures surrounding our built structures not the temperatures in which humans live most of the time?
Do standardized temperature locations really have any meaning at all, compared to what humans generally experience most of the time ? The temperatures in which humans live ARE the temperatures of their cities and places with their built structures. We are already living in places where the temperature is above any anomaly based on any standardized-measuring-station determination.
Humans are now very much a part of the Earth scene, contributing to small increments in temperatures of their living spaces that “global average temperature” is engineered to ignore. A “global average temperature”, as determined by idealized, perfectly located measuring stations, NOT influenced by human structures, is a total fantasy. We live in the temperatures that our structures create in association with the natural structures of the Earth. When we compare a global temperature anomaly, figured from ideally located stations, and then freak out because of a fraction of a degree, why are we not freaking out about the possibly MULTIPLE degrees higher temperature that we already live in because of our structures? Those ideal anomalies do NOT reflect our actual living temperatures in our cities where we are ALREADY experiencing much more than the idealized anomaly of increase.
Even within the natural structures of the Earth, the temperature can differ by small amounts in the same general area, which reduces the idea of a small anomaly to a non-physically-based idea.
temp sensor would be close to runway, critical that a/c have correct air temps at runways
MarkW
July 7, 2018 10:57 am
Even without the ice cream truck, the Scottish record would have been invalid because of the extremely bad conditions in the immediate vicinity of the sensor.
But it wasn’t. One would have assumed its siting issues would have disqualified it immediately, but there’s no indication the Met Office would have done that.
The commenters over at WaPo are true believers, preparing for the heat apocalypse. I am always amazed that they become so upset by this kind of report.
Trevor
July 7, 2018 1:18 pm
“Snow falls in Sahara desert for third time in 40 years | The Independent https://www.independent.co.uk › News › World › Africa
“Jan 9, 2018 – Snowfall covered the desert dunes. … Snow has fallen in the Sahara, covering desert dunes in a layer up to 40cm deep. Snow started falling on the Algerian town of Ain Sefra in the early hours of Sunday ”
GOODNESS ME ! FANCY IT BEING HOT IN ALGERIA ??????
IT MUST HAVE SOMETHING TO DO WITH THE WEATHER perhaps !???
Sheri
July 7, 2018 1:26 pm
All this record stuff was kind of cute when Guiness did it. Not so much when politicians and the media do it to cause panic. Records are great for book you want to hawk….
Juan
July 7, 2018 2:18 pm
Only the dumbest people still believe anything from this pathetic rag. They have been caught lying countless times.
“Unfortunately in this particular instance we have evidence that a stationary vehicle with its engine running was parked too close to the observing enclosure and the Stevenson screen housing the thermometers during the afternoon of 28th June,” the Met Office explained.”
Why is it unfortunate? Does the Met Office want a high temperature?
You’re referring to the Scotland incident in a pair of other posts. This one likely involves a large airplane.
brians356
July 7, 2018 3:45 pm
The highest official temperature ever recorded in my hometown Lewiston, Idaho (only a couple hundred miles from Canada) was 115 f. That was just set in [drum roll] … 1962. Proof the world has been cooling for 55+ years.
Was that temp recorded in the valley where the steep Lewiston Hill to the north almost acts like a reflective oven on the entire valley; or was it recorded at the higher elevation at the airport in the Lewiston Orchards?
(I was in high school then, and I remember reading 117 F on our home thermometer in nearby Clarkston that summer.)
It was almost certainly recorded at the former NWS station at the airport. Down on Main St it would have been much hotter. Our family drove that day in a 1960 Chevy to spend several days at Zim’s Plunge, the hot springs resort in central Idaho! My dad borrowed a window mounted swamp cooler, but it was useless.
TRM
July 7, 2018 5:38 pm
Meanwhile South Africa is getting snow, some in places that have never had it.
“In my view, this temperature record should be disqualified as being influenced by man-made objects”
Sheesh! I can understand why skepticism is warranted, but saying it should be disqualified based on guesses and suspicions is a little much. Are there any other stations near enough to compare temperature patterns? Does the record appear to generally have anomalous temperatures at the station? Are temps higher when the wind is from the southwest? According to Weather Underground, at 3 p.m. the wind was SSW, not WSW; according to the SYNOP report it was WNW. Regardless, the temps were evidently very high for an extended period no matter what wind direction was recorded.
The typo in the wind direction has been corrected. Thanks. The typo doesn’t change the conclusions of the essay.
“Regardless, the temps were evidently very high for an extended period no matter what wind direction was recorded.”
So what? The issue is the high temperature record, not that it gets very hot in the summer in the middle of the desert in Algeria, it’s the accuracy of the high temperature record. Classic deflection on your part.
If this was an isolated case, you might have a point, but it isn’t. It’s a worldwide problem. For example, Rome:
Anthony, please don’t misunderstand – I agree that the record temp is suspect, but I disagree with the idea that it should simply be thrown out based on the evidence you provided, which contains some guesses and assumptions. I do agree that the WaPo article jumped the gun. I don’t doubt that there are station siting problems (the Roman example is a good one), but that has absolutely nothing to do with whether the record temperature recorded here is false.
The fact that the whole afternoon had very high temps is not irrelevant, and it wasn’t a “deflection” on my part. However, I understand your point.
“Also, you may not understand what a “runway approach” is. It is in fact within the approach area of runway 20.” I guess part of the problem here is that “area” is pretty vague. Judging by the distance and patterns on the soil, I wonder how significant a problem this really is.
I had seen your work before, and also the response from NOAA (https://www.ncdc.noaa.gov/ushcn/station-siting). Why should I have to publish anything to counter your concerns in order to voice an opinion? Your concerns are legitimate. Your (and others’) work was valuable and an admirable effort, at the very least because it instigated a closer look by NOAA at their data. That said, I’m not sure the data are as faulty as you suggest, or that “the NOAA/NCDC homogenization adjustment causes well sited stations to be adjusted upwards to match the trends of poorly sited stations” – but I emphasize that I’m not sure, meaning I withhold judgment.
P.S. Usually you give a h/t to those who find errors, don’t you? It wasn’t just a typo – you used it to orient your arrow. I noticed the slight, but no big deal. Your decision. Understandable – it’s people like me you are fighting.
P.P.S. Is north not toward the top of the image? Funny how the arrow on the graph doesn’t agree with the reading. And why choose 3 p.m. for your wind direction, rather than 4, when it was from the SE or WNW, depending on which you believe? To me the wind direction is not good evidence to use here based on the inconsistent readings and not knowing when the high was reached. It is this kind of thing that makes alarm bells ring, making me wonder how dispassionately you view the data. I’m not picking on you -no human reasons well all the time, myself included. The best scientists (I am NOT included!) are always mindful of potential for bias – it’s the only way to counteract it.
I’d certainly be curious to know where the nearest “ideal” station is, and if it is very close, how it compares.
I think it would be interesting to compare a list of known sites that may be compromised, that have un-compromised stations close by, to see the range of the differences between them.
Obviously, this is not always possible, but I still think it would be useful to get a handle on the magnitude of the problem, and to build up a picture of how much difference is made by the many different ways a station may be compromised.
The nearest site (though I don’t know how “ideal” it is) is OUED IRARA, AG (in Haoud El Hamra . The high there was 121 F that day, according to NOAA. Also according to NOAA (I just got the official results – it took them longer to process the temp there for some reason, maybe because they were double checking it? Who knows?) the high at Ouargla was 124 F. The stations appear to be about 80 km apart.
There is a roadside automatic weather station on east bound interstate 1976 east of Denver high in the hills. have of the station hangs over a guard rail that is for a bridge.
Do they use these roadside AWS for calculating global temperature?
Johann Wundersamer
July 8, 2018 12:34 pm
Just look at the small area for the jet above, it has to make a 360 rotation and that spews jet exhaust everywhere.


Good sleuthing!
…the recent all time high in Scotland that turned out to be polluted by an idling vehicle producing hot exhaust near the temperature sensor….
The Scots one would surely have been rejected anyway – a sensor in a car park with dumped rubbish all around it is not an accurate station…
Every year there will be a number of hot and cold records. The CAGW alarmists will report the hot records as if they are unusual. They aren’t.
The alarmists will ignore cold temperature records dropping like snowflakes. link I continue to be skeptical because I simply do not trust the alarmists to tell the whole unvarnished truth.
Dr. Michael Mann’s attempt to erase the MWP with his hockey stick turned me into a skeptic. Since then it’s been one sad piece of crap after another. The left wing and the MSM paint The Donald as a liar. He doesn’t hold a candle to them.
I hear they make a mean salad there, in Ouargla.
What, you’ve never heard of Ouargla salad?
A record temperature during a modern warm period. Meh. A few tens of thousands years from now that record temperature at that location will not be detectable. It is likely the case that in past warm periods over the last 800,000 years, records would have been recorded as freqently as they have been now, were the technology available.
I thought I had seen a temperature of 56 °C in Ain Salah, and indeed that memory was good. In a google book scan of 1961 I found:
The Physical Environment and Agriculture of Morocco, Algeria, …
Michael Y. Nuttonson – 1961 –
… highest sun temperatures. In contrast to these great diurnal ranges, the annual range of temperature is not great and seldom exceeds 14° C. The highest temperatures ever recorded in Algeria are: 48° C. at Biskra, 54° C. at Touggourt, 55° C. at Timimoun, and 56° C. at In Salah … The low temperature records include -5° C. at Ouargla, -4° C. at In Salah, and -2° C. at Biskra. In the Sahara, as in northern …
> Ouargla, with a population of nearly half a million, is located in north central Algeria, roughly midway between Morocco and Tunisia.
Unless it’s actually quadrupled since the last census, this population figure seems to be wrong as well. (It seems that in their careful research, they’ve taken the entire province’s population for the city’s.)
https://www.citypopulation.de/php/algeria-admin.php?adm1id=30
In Seattle, they use SeaTac airport as the record of choice, regardless of what it’s doing all around it.
NOAA’s NCDC database puts the station at 47.4444°, -122.3138°, which on Google Maps puts it smack in the middle of all the runways. Just plug that number into Google maps and you’ll see it. The resolution on GM was too low for me to make out any individual structures, but there are several likely candidates.
I also looked at a little history. I looked at the June data for 1948, and 2018. not a lot of difference just eyeballing it. At the bottom of each generated PDF of the historical data it has a Summary field, which I assume means average.
Here are the max/min averages for the month. Max Min 1948: 72 52 2018: 72 53 Looks like the equipment changed from Coop to ASOS in October 1996. So let's look at June 1997 1997: 67 52 And the big El Nino year of 1998: 1998: 68 52 And the El Nino of 2016 2016: 73 54What does it mean? Probably nothing. But I’m sure not scared by it.
This so clearly brings into question the ultimate meaning of a “global average temperature”.
With humans occupying much of the land, how is it that we can disqualify human cities from being places to measure temperature? Are cities not where humans live MOST OF THE TIME ? Are temperatures of cities and temperatures surrounding our built structures not the temperatures in which humans live most of the time?
Do standardized temperature locations really have any meaning at all, compared to what humans generally experience most of the time ? The temperatures in which humans live ARE the temperatures of their cities and places with their built structures. We are already living in places where the temperature is above any anomaly based on any standardized-measuring-station determination.
Humans are now very much a part of the Earth scene, contributing to small increments in temperatures of their living spaces that “global average temperature” is engineered to ignore. A “global average temperature”, as determined by idealized, perfectly located measuring stations, NOT influenced by human structures, is a total fantasy. We live in the temperatures that our structures create in association with the natural structures of the Earth. When we compare a global temperature anomaly, figured from ideally located stations, and then freak out because of a fraction of a degree, why are we not freaking out about the possibly MULTIPLE degrees higher temperature that we already live in because of our structures? Those ideal anomalies do NOT reflect our actual living temperatures in our cities where we are ALREADY experiencing much more than the idealized anomaly of increase.
Even within the natural structures of the Earth, the temperature can differ by small amounts in the same general area, which reduces the idea of a small anomaly to a non-physically-based idea.
During the summer most of my time is spent inside of buildings where air-conditioning keeps the temperature in the low 70s F.
During the winter most of my time is spent inside of buildings where heating keeps the temperature in the low 70s F.
I guess my average global temperature is somewhere in the low 70s F.
Mine is about 75 F. (^_^)
temp sensor would be close to runway, critical that a/c have correct air temps at runways
Even without the ice cream truck, the Scottish record would have been invalid because of the extremely bad conditions in the immediate vicinity of the sensor.
But it wasn’t. One would have assumed its siting issues would have disqualified it immediately, but there’s no indication the Met Office would have done that.
Well, that sure explains NASA GISS.
The commenters over at WaPo are true believers, preparing for the heat apocalypse. I am always amazed that they become so upset by this kind of report.
“Snow falls in Sahara desert for third time in 40 years | The Independent
https://www.independent.co.uk › News › World › Africa
“Jan 9, 2018 – Snowfall covered the desert dunes. … Snow has fallen in the Sahara, covering desert dunes in a layer up to 40cm deep. Snow started falling on the Algerian town of Ain Sefra in the early hours of Sunday ”
GOODNESS ME ! FANCY IT BEING HOT IN ALGERIA ??????
IT MUST HAVE SOMETHING TO DO WITH THE WEATHER perhaps !???
All this record stuff was kind of cute when Guiness did it. Not so much when politicians and the media do it to cause panic. Records are great for book you want to hawk….
Only the dumbest people still believe anything from this pathetic rag. They have been caught lying countless times.
“Unfortunately in this particular instance we have evidence that a stationary vehicle with its engine running was parked too close to the observing enclosure and the Stevenson screen housing the thermometers during the afternoon of 28th June,” the Met Office explained.”
Why is it unfortunate? Does the Met Office want a high temperature?
You’re referring to the Scotland incident in a pair of other posts. This one likely involves a large airplane.
The highest official temperature ever recorded in my hometown Lewiston, Idaho (only a couple hundred miles from Canada) was 115 f. That was just set in [drum roll] … 1962. Proof the world has been cooling for 55+ years.
Was that temp recorded in the valley where the steep Lewiston Hill to the north almost acts like a reflective oven on the entire valley; or was it recorded at the higher elevation at the airport in the Lewiston Orchards?
(I was in high school then, and I remember reading 117 F on our home thermometer in nearby Clarkston that summer.)
It was almost certainly recorded at the former NWS station at the airport. Down on Main St it would have been much hotter. Our family drove that day in a 1960 Chevy to spend several days at Zim’s Plunge, the hot springs resort in central Idaho! My dad borrowed a window mounted swamp cooler, but it was useless.
Meanwhile South Africa is getting snow, some in places that have never had it.
https://www.iceagenow.info/elation-and-awe-as-capetonians-experience-snow-for-the-first-time-video/
“In my view, this temperature record should be disqualified as being influenced by man-made objects”
Sheesh! I can understand why skepticism is warranted, but saying it should be disqualified based on guesses and suspicions is a little much. Are there any other stations near enough to compare temperature patterns? Does the record appear to generally have anomalous temperatures at the station? Are temps higher when the wind is from the southwest? According to Weather Underground, at 3 p.m. the wind was SSW, not WSW; according to the SYNOP report it was WNW. Regardless, the temps were evidently very high for an extended period no matter what wind direction was recorded.
And it’s not in the runway approach area.
The typo in the wind direction has been corrected. Thanks. The typo doesn’t change the conclusions of the essay.
“Regardless, the temps were evidently very high for an extended period no matter what wind direction was recorded.”
So what? The issue is the high temperature record, not that it gets very hot in the summer in the middle of the desert in Algeria, it’s the accuracy of the high temperature record. Classic deflection on your part.
If this was an isolated case, you might have a point, but it isn’t. It’s a worldwide problem. For example, Rome:
More here: https://wattsupwiththat.com/2009/03/28/how-not-to-measure-temperature-part-86-when-in-rome-dont-do-as-the-romans-do/
And I’ve published a study showing that temperatures have in fact been systematically biased upwards by such problems.
https://wattsupwiththat.com/2015/12/17/press-release-agu15-the-quality-of-temperature-station-siting-matters-for-temperature-trends/
What have you published to counter such concerns?
Also, you may not understand what a “runway approach” is. It is in fact within the approach area of runway 20.
Anthony, please don’t misunderstand – I agree that the record temp is suspect, but I disagree with the idea that it should simply be thrown out based on the evidence you provided, which contains some guesses and assumptions. I do agree that the WaPo article jumped the gun. I don’t doubt that there are station siting problems (the Roman example is a good one), but that has absolutely nothing to do with whether the record temperature recorded here is false.
The fact that the whole afternoon had very high temps is not irrelevant, and it wasn’t a “deflection” on my part. However, I understand your point.
“Also, you may not understand what a “runway approach” is. It is in fact within the approach area of runway 20.” I guess part of the problem here is that “area” is pretty vague. Judging by the distance and patterns on the soil, I wonder how significant a problem this really is.
I had seen your work before, and also the response from NOAA (https://www.ncdc.noaa.gov/ushcn/station-siting). Why should I have to publish anything to counter your concerns in order to voice an opinion? Your concerns are legitimate. Your (and others’) work was valuable and an admirable effort, at the very least because it instigated a closer look by NOAA at their data. That said, I’m not sure the data are as faulty as you suggest, or that “the NOAA/NCDC homogenization adjustment causes well sited stations to be adjusted upwards to match the trends of poorly sited stations” – but I emphasize that I’m not sure, meaning I withhold judgment.
P.S. Usually you give a h/t to those who find errors, don’t you? It wasn’t just a typo – you used it to orient your arrow. I noticed the slight, but no big deal. Your decision. Understandable – it’s people like me you are fighting.
P.P.S. Is north not toward the top of the image? Funny how the arrow on the graph doesn’t agree with the reading. And why choose 3 p.m. for your wind direction, rather than 4, when it was from the SE or WNW, depending on which you believe? To me the wind direction is not good evidence to use here based on the inconsistent readings and not knowing when the high was reached. It is this kind of thing that makes alarm bells ring, making me wonder how dispassionately you view the data. I’m not picking on you -no human reasons well all the time, myself included. The best scientists (I am NOT included!) are always mindful of potential for bias – it’s the only way to counteract it.
I’d certainly be curious to know where the nearest “ideal” station is, and if it is very close, how it compares.
I think it would be interesting to compare a list of known sites that may be compromised, that have un-compromised stations close by, to see the range of the differences between them.
Obviously, this is not always possible, but I still think it would be useful to get a handle on the magnitude of the problem, and to build up a picture of how much difference is made by the many different ways a station may be compromised.
The nearest site (though I don’t know how “ideal” it is) is OUED IRARA, AG (in Haoud El Hamra . The high there was 121 F that day, according to NOAA. Also according to NOAA (I just got the official results – it took them longer to process the temp there for some reason, maybe because they were double checking it? Who knows?) the high at Ouargla was 124 F. The stations appear to be about 80 km apart.
This minimum record in Oman could also have connections to aircraft, runways and carparks, but I haven’t the time to check just now. https://www.wunderground.com/cat6/Minimum-Temperature-426-C-1087-F-Oman-June-26-2018-New-World-Record
OH NO!! The desert is hot, hot, hot!
https://youtu.be/MYITD8TMvcM
Somewhat related.
There is a roadside automatic weather station on east bound interstate 1976 east of Denver high in the hills. have of the station hangs over a guard rail that is for a bridge.
Do they use these roadside AWS for calculating global temperature?
Just look at the small area for the jet above, it has to make a 360 rotation and that spews jet exhaust everywhere.
Sure? What good is 360 rotation for.
180 would’nt do it?
Then, there’s this:-
https://www.washingtonpost.com/news/capital-weather-gang/wp/2018/07/03/hot-planet-all-time-heat-records-have-been-set-all-over-the-world-in-last-week/?noredirect=on&utm_term=.d7dfba821cd4