Guest essay by David Archibald
For the first time a major political party has gone into an election with an anti-green platform and won big time. Specifically the Conservative Party platform for the Ontario election on 7th June promised:
- This means no carbon tax or cap-and-trade schemes.
- Stop sweetheart deals by scrapping the Green Energy Act.
The Conservatives made some other promises too but what was interesting about dropping the carbon tax etc. was the lack of agonising over the science, the planet, polar bears, the Great Barrier Reef or anything else. While the Trump administration recently hired a climate agoniser to head NASA, and the head of the EPA hasn’t moved against the endangerment finding on CO2, Ontario voters in a record turnout voted to make global warming a non-problem by forgetting about it, and getting on with their lives.
Ontario may or may not have had global warming in the late 20th century but there is a whole continent that missed out on it together. The following chart shows the lower troposphere temperature anomaly for Australia since the satellites went up in 1978. The data is from Dr Roy Spencer’s group at the University of Alabama, Hunstville.

Australia’s atmospheric temperature has been a paragon of stability. There has been no increase over the last 40 years. Since global warming has to start in the atmosphere, there has been no global warming in Australia. No Australian under the age of 40 has experienced global warming. Given the way the Sun is going, they are likely to miss out altogether.
If they missed out on global warming, perhaps they have experienced sea level rise? No luck there either. One of the longer sea level series is from Fort Denison in Sydney Harbour with records from May 1914. This is how that data plots up:

There appears to be a slight rise but that is deceptive. The first record in May 1914 was a mean level of 1.111 metres. The last record, for February 2018, is 1.018 metres – 93 mm lower. There can be other interpretations of what it all means but there is no emergency. There isn’t even a trend, unless flat counts as a trend. And in the end the voters are likely to pull an Ontario and decide that there are things that are more important. The Conservatives in Ontario promised to spend C$100 million on autism.
David Archibald is the author of American Gripen: The Solution to the F-35 Nightmare
Regarding the legal notice I saw when I loaded this site:
“We use cookies to ensure that we give you the best experience on WUWT. If you continue to use this site we will assume that you are happy with it. This notice is required by recently enacted EU GDPR rules, and since WUWT is a globally read website, we need to keep the bureaucrats off our case!”
With what I’m seeing on the legal front in the EU, any sort of exposure over there is getting dangerous. Among other threats, Article 13 is coming up for a vote, https://saveyourinternet.eu/home , which may require online forums operating in the EU to implement harsh filtering and censorship to avoid copyright liability.
hanelyp
Thankfully the UK is getting out from under the EU cosh.
If takes too long, or Brexit is soft, I’ll trust my trusty VPN https://www.privateinternetaccess.com
Cheap, unlimited and fast.
And I completed the petition.
you hope. Theresa the appeaser wants to stay in. I get the feeling that’s what will happen
No – haven’t you been watching?
May has turned her arse up to the EU – not to flash the brown eye but to take a right good shafting from them.
Everything she said she’d stand up to, within a week she had capitulated – EU Army? We’re committed to paying for that even after we (so-called) “leave”. Fishing rights, nope. Border controls, nope. Customs Area? Nope, stuck in the EU field there too.
The truth is that we will not be leaving – it will be just “name only” and we will still lose all of our sovereign rights and self-determination.
We have been betrayed by the very people we elected to run our country FOR us.
I hope you’re right but democracy is becoming very fragile in the UK. The people were told that the result of the referendum on Brexit would be implemented and we would take back control of our borders, money and laws. Now it’s looking more and more that the people have been, bit by bit, stitched up by the Remain establishment of which Mrs May is part.
If we don’t get the full Brexit (as above) as promised I fear climate change will be the least of our problems. We cannot be part democratic, but only when it suits the establishment.
Our problem is Parliament is supreme.
Above monarch AND people.
All UK parties are warmist and support the Climate Change Act. In or out of the EU makes little odds, if any.
We’re stuffed.
But….but…what will all those people currently employed measuring how bendy a banana can be do then:
https://en.wikipedia.org/wiki/Commission_Regulation_(EC)_No._2257/94
The cookies AFAIK are to keep you signed in so you don’t have to re-enter your credentials every time you want to post a comment.
As for the EU, there is a hilarious video by Nigel Farage listing the criminal convictions and dodgy Soviet affiliations of the incoming EU Commissioners. The European Commission is effectively the top executive body of the EU, with both the power to source legislation and oversight over how that legislation is implemented.
The company I work for in the UK is now scared to do just about anything. The new laws means the fines can be absolutely massive and are tied to the earnings of the company. We have to check with lawyers before we do anything. Something that was a little job and would take 30 minutes can now wait two days for clearance. We have all had PGP installed and have to encrypt everything, even a single line of data that might just be something like Name,DOB and marital status.
Frankly hanelyp, I don’t give a damn.
Mustn’t confuse them with the facts ….
they might choose the red pill …
Anti-Green. Pro-conservation, rational and reasonable.
A lesson here for the brand new New Conservative party in New Zealand. Pick it up and run with it, PLEASE!
What New Conservative Party?? You mean the rebranded Old Conservative Party?
It took us 15 years of pain but 40% of us finally woke up. No champagne uncorking yet, we have a 3 party system so the liberals (lefties in Canada) and socialist NDP still had almost 60% of the vote. In our case 40% is generally enough provincially or federally to win an outright majority of seats. Now we will experience an onslaught of negative media hype trying to destroy the conservatives, and boy has it started. We have an editorial from our national broadcaster the CBC (=ABC in Aus or BBC in UK) saying that the conservatives only won due to the white heterosexual vote, even though they also outright won the non white vote according to polls.
Wait til they say that all the women who voted conservative did so because their husbands, boyfriends, or sons ‘pressured’ them into it.
Waterloo, home of the University of Waterloo, head office of BlackBerry, host to Sandvines, Open Text and hundreds of others, elected a lady I believe to be an engineer. Is that correct?
Maybe some common sense will enter the fray.
Mistake No 1 – politicians/political parties are not subject to truth in advertising laws
Mistake No 2 – believing ANY politician (or would-be politician)
Mistake No 3 – using anything from Australia showing CO2 is not an evil, nirvana-destroying gas that escaped from Pandora’s box
See the straight-faced lie of our former liar-in-chief (Gillard):
https://www.youtube.com/watch?v=KMVc0IbtyAQ&w=1161&h=653
While politicians can get away with lying to voters once they are in power and use excuses such as ‘circumstances have changed’ or ‘now we have seen the books we (always unfortunately) cannot hold to our pre-election promises’ it does not matter what the data shows.
Worst of all is the weasel-words they are fond of using to demonstrate that we are dumb and it is our faults for not understanding what their words mean:
E.g. an Emissions Trading Scheme is not a carbon tax
Thanks for ruining my pre-breakfast day with sensible sounding policies and Australia in the same article (but WUWT will remain my go-to, must read every day site)
I live in Ontario Canada. I voted in that election Unfortunately many of Ford’s own people believe in global warming. I think even he does, but he hates taxes so much that is the overriding factor . The other elephant in the room is Trudeau our PM. See below for what Trudeau wants to do and he will force it by way of the Supreme Court. Only 2 provinces out of 10 are opposing him. Ford in Ontario and the province of Saskatchewan.
Standards, subsidies and taxes. The bane of the free market. Standards should only be used to prevent injuries or bad health effects. Subsidies should only be used to prop up a company that produces a domestic product that is key to national security. Taxes should only be used as a government income source. Too often however the government uses standards to interfere in the life of all its citizens. At the same time governments subsidize almost everything. Taxes are collected for all sorts of reasons. Ex: liquor and tobacco taxes, estate or inheritance taxes, gift taxes, company asset taxes, and carbon taxes.
It is this last one that irks me the most. Carbon taxes are ridiculous. One of 3 things can happen. 1) The company can refuse to pay them and move out of the country or threaten to move out before they are enacted. In this case everybody loses. 2) The company can pay them and then raise their prices so that with business as usual no emission reduction of CO2 occurs. In this case only the company loses if it also exports its product. The consumers don’t lose because the carbon taxes are supposed to be given back to the public at large. However the general price level of all carbon related goods goes up so that inflation goes up. However since no decrease in CO2 emissions occurs, there was no reason to have the tax in the 1st place. 3) The company can change its source of fuel to a lower carbon entity at a higher cost and pass on its necessary price increase to its customers. The customers have no choice because all the competitors have to do the same thing. In that case there is a reduction in CO2 emissions but since the atmosphere needs more CO2 NOT less, everybody loses.
It is this third scenario that factors into my main point. Even if you believe in AGW(human caused global warming/climate change) , here are the stark facts of trying to do anything about it. PM Trudeau in Canada plans on introducing a tax on the emission of CO2 and all greenhouse gases except water vapour, starting January 1, 2019.
Canada puts out 1.5 % of world total of CO2 and has not had any increases for 11 years.. China puts out 31% of the world total and increased their output 4.1% in 2017 and is on track for an equal 4% increase after the 1st quarter of 2018.
In 1991 Norway was the 1st country along with Sweden to introduce a carbon tax, and they have found that their tax was responsible for reducing their increases of emissions by only 2.32% compared to a 0 rate on carbon. However Norway’s CO2 emissions still went up. To top it all off Norway found that the carbon taxes reduced their GDP by 0.06%.
In the Norwegian scheme there were so many exemptions that the effective coverage of the carbon taxes was only 64% of industrial production. The Norwegian price for carbon is around $25 Can per ton. Trudeau has promised to introduce Canada’s carbon tax at $10 per ton in 2019 and increase it $10 per ton every year until $50 per ton by the end of 2023. However the differing prices between Norway and Canada will not have any significant effect on the results because there is very little opportunity for any company in Canada in at least 7 of the provinces, to switch to a non CO2 producing fuel because those 7(except Manitoba,B.C. and Quebec) do not have significant hydro power; so the companies will simply pay the tax to stay in business. Theoretically this should not amount to any significant reduction in CO2 because Canada is different from Norway in a fundamental way. In Norway any firm has access to hydro elecricity.
However we will take Trudeau’s word for it and assume that all 75% of planned reduction of Canada’s contribution to the 2030 targets will be met. Ireland achieved a decrease in emissions after 4 straight years of increased emissions despite a carbon tax. British Columbia despite having a carbon tax since 2008 has not achieved any decrease in CO2 emissions.
The Intergovernmental Panel on Climate Change (IPCC) has said that that the average climate computer model forecasts an increase in temperature of 3C by the end of the century (82 years from now) if the world doesn’t reduce its carbon footprint. The said reduction of temperature goal is 1.5 C by end of century in order to limit the temperature increase to 1.5 C.
Canada has committed to reduce greenhouse gas emmissions per Paris agreement by 2030 of 33%. 33% of 1.5 % = 0.5% of world total
In the 1st phase of reductions which will culminate by 2023, if all 75% of the planned CO2 emissions are met ; this will reduce our greenhouse gas footprint by 75% of 33% = 24.75% with the other 25% of 33% = 8.25% being part of a revised carbon pricing scheme between 2023 and 2030.
75% = 0.75 and 0.5% = .005
So you have 0.75 * .005 = 0.00375 Don’t forget that carbon trading and a carbon price dont actually guarantee that any reductions will ever occur.
But if the promised reductions do occur then you multiply by goal of 1.5C so that you have 0.00375 * 1.5 = 0.005625 C
That is a reduction of a little over 5 thousandths of a degree C at the end of the next 82 years. Whether Canada will do any better is a function of how many exemptions and what discount carbon tax %’s are actually determined for each specific industry. Even so since this is the 1st phase only, Canada’s goal in this phase is to cut 75% of a third of its emissions which = 24% . There is a big difference between Norway’s result of 2.32 % reduction and Canada’s goal of 24%. However Canada’s emissions have been flat since 2007.
Since China’s increase last year as per the above is .3 * .041 = 0.0123 or 1.23% of world total
Canada’s reduction will be .75 * .005 = 0.00375
That means China’s increase for 1 year is 0.0123/ 0.00375 = 3.28 times the amount of Canada’s reduction for each year if the emissions go lower in Canada to the same degree as the increased price effect after 5 years. Dont forget that Canada’s reduction is only at a maximum effect by 2022 because of the increasing price of $10 per ton per year. In the 1st year 2019 or any other year, the reduction could be the whole amount or any amount depending on how many firms simply pay the tax vs the number that switch to a non carbon or lower carbon fuel source. China has refused to decrease its output and only promised to try to limit their increases by 2030. China is not a developing country because it has 45% of the world’s skyscrapers.
Ah taxes. Theft disguised as a necessary evil of the greater good. How about voluntary donation. If people genuinely care, they will fund it.
You will never ease suffering if the foundation of your society is violence. Taxation is violence. Don’t agree? Refuse to pay and see how long it takes for storm troopers with guns to knock down your door. Why people refuse to accept this is beyond me. Must be some sort of childish void that losing Santa fills.
What will all of this cost Canada?
Price of carbon by 2022 will be $50 per ton by 2022 and at 700 million tons = 35 billion $ Can. However since the carbon tax will start in 2019 at $10 per ton, the yearly taxes will be assuming no exemptions 2019= 700 m * $10 = $7 billion 2020= 700m * $20 = $14 billion 2021 = 700m * $30 = $21 billion 2022= 700m * $40 = $28 billion 2023 = 700m * $50 = $35 billion So total cost over 5 year period is $112 billion and assuming no other increases the yearly rate will remain at $35 billion per year indefinitely. Of course all this assumes that 100% of the emmissions will be covered. If as in Norway, only about 2/3 of industry is covered by the the new tax, then take 1/3 off of these figures which will then be a total of $74 billion over the next 5 years instead of the $112 billion that I stated above. .
This will still leave Canada short 66 million tons of its Paris commitment to cut by 2030 and Trudeau has said that Canada will meet its commitment by 2030.
What will this cost each household in Canada?
Minimum of $1100 Can and maximum of $2500 Can depending on rebates given back by each province. Some provinces have promised to give all of it back.
THIS IS ABSOLUTE MADNESS.
My Prime Minister Trudeau is worried about a trace gas in the atmosphere absolutely essential for all life while not worrying about the 5 trillion pieces of plastic that are in the seas. ABSOLUTELY SHAMEFULL
Warming should be good for Canada.
In Canada we will take 3C extra any day even in the summer
Larkana, Sindh. How do you think they’d enjoy another 3 degrees?
Ever heard of polar amplification zazzy?
Yah just like happened in the 60s and 70s. Only back then is was called an Arctic Front
Strange how winters on the west coast are getting colder and longer
You need a quick one liner: Business do not pay taxes, Customers pay taxes.
Alan, you’re leaving out a few things.
1. Ontario and Saskatchewan will likely be joined next year by Alberta when the Notley government goes under. And prospects for New Brunswick are not looking very good either. So there’s two more possible anti-CO2 tax provinces, one for certain. Make no mistake, Jason Kenney is making the federal government the principal enemy in his campaign, not the current Alberta Premier.
The consequence of all this is that it’s simply impossible for a federal government to enforce a carbon tax over the objections of the two largest economic provinces in the Dominion.
2. Trudeau’s government is running out of mandate. He has to go to the polls in 2019. So he’s only got about 18 months left. Much of his existing legislative mandate is in ruins such as electoral reform. The one thing he is passing, marijuana reform, is also in some trouble with the Senate imposing a load of government-hostile amendments to the bill. And let’s not forget that his government is also in serious trouble over Kinder-Morgan.
So much as he may like to impose a CO2 tax, he’s running out of room.
Isn’t Ontario the Canadian equivalent of New YorkNoVaMaryland? How can the conservatives carry such a #woke province? Zoolander’s other eyebrow must be drooping.
Consider what happened in Ontario when they shut down coal plants and expanded wind generation, electricity rates increased by more than 70% in a short period of time. It’s easy to motivate voters against environmentalism when it’s put them in the poor house.
Around here (Comifornia) you still routinely hear ads selling residential solar, citing how “cheap” it is compared to standard utility rates. And completely ignoring how utility rates have been driven up by mandates for utilities to support residential solar by buying surplus generation.
Yeah…. but your PM will just double down on the federal carbon tax and that goes for every province that doesn’t currently have or is planning a carbon tax scheme. Andrew Scheer hasn’t publicly said he WON’T introduce a carbon tax …… so that means right now it’s in the works.
Wow. Great example for Rabbit Run’s post:
http://rabett.blogspot.com/2018/06/tobis-rule.html
It really is fascinating how trolls keep dragging out the same dis-proven claims over and over again.
Linking to high-traffic sites like this one gets them redirects to their lower-traffic sites “over and over again.”
Speaking of “over and over again”.
If you really aren’t the arm-waving, one trick pony you seem to be….show us where this proof is.
It’s always in the pudding.
Every graph on that site is fake and made up. Greenies keep believing in their fake religion of CO2 warming
Every graph from actual scientists is made up. Every graph from non-scientists are real.
And that’s how rational people see things.
No one has shown or proved that any skeptic fudged or faked any data. On the other hand NOAA , NASA and NCAR, and the Met office along with BOM and the New Zealand government agency that tracks global temperature change have all been caught fudging the graphs and some of them have been caught faking some of the data. This has happended a lot more than once and was even admitted to by some of the scientists in their emails. We skeptics will never forget climate gate. The only reason 2 of the scientists were not charged in England was that the statute of limitations had run out.
A skeptic has no reason to lie about climate change or global warming. All we get are howls of derision from the wider public cause they think we are nuts. So why would we do this and subject ourselves to ridicule. Just to try to win an argument. ? If that is what you think , then you are nuttier than the nuttiest that I thought greens could ever be. The real reason is THE TRUTH. We know the truth about CO2 and we will fight this hoax to our everlasting breath. When we are presented with graphs we have never seen, we investigate the source. If a line of reasoning makes sense backed up by good data then we change our minds. That is what science is all about. Unlike the global warming religion which is NOT science.
“We know the truth about CO2”
Wow. And what is that truth? What explains the warming besides CO2? This should be interesting.
“What explains the warming besides CO2?”
Is the following argument necessarily true?
“Jimmy isn’t at school today, therefore, he must be on a family trip.”
If not, then do you see where your argument similarly fails?
https://philosophy.lander.edu/logic/cause.html
Your argument seems to be: Since CO2 is a greenhouse gas and it’s concentration is rising, and there are no other forcings that can explain the earth’s warming to this degree, and the fingerprints of CO2 are present, then…
There must be something other than CO2 warming the planet and all climate scientists are wrong.
No, that’s you restating your argument, with which I’ve already dealt.
https://philosophy.lander.edu/logic/cause.html
Is Jimmy necessarily on a family trip if he’s not at school?
Allay,
The reasoning of the IPCC is exact that: “we have examined all possible natural causes and without CO2 we can’t explain the warming since 1950, thus CO2 is the cause of the warming.”
Problem is that there was zero warming 2001-2014 with strong increasing CO2 levels (and now after the 2015-2016 El Niño about back down again). That is called “the pause” or anything else to hide the non-warming. So what did compensate the effect of the extra CO2? And if that effect is so strong in cooling, isn’t that also responsible for the warming in previous periods?
Problem is that the IPCC does not know and can’t know every detail that influences climate and thus can’t be sure that CO2 is the main control knob. A few large influences like (deep) ocean currents, the influence of clouds and by what mechanisms clouds are influenced,… These have much more effect than the influence of increasing CO2 from 290 to 410 ppmv in the atmosphere.
What warming? Not where I’ve lived for 50 years
Yes, the globe means where Mick lives, and temperature is based on whether he is sweating today.
“Every graph on that site is fake and made up”
No Alan, you have been tricked into thinking that. There is nothing fake about any of that data. Its got nothing to do with greenies or religion. Why don’t you check for yourself?
Recentism as in sea level is rising! as wave is coming and sea level is falling! as trove is passing IS funny, but there IS also the point that is your trend is smaller than hourly variation, then it is not very important.
However, I do find some of your criticism valid, and will offer you one +1 vote. You’re now in -7. Oops. I gave you a minus vote. Tough.
Ontario? There is an Ontario in Canada, isn’t there? Is there one in Australia or is this actually about politics in Hungary? Why do so many writers assume that the name of every city they know is also known to everyone else in the world?
Very true! Some years ago I booked a flight to Waterloo, Ontario, Canada, (where I wanted to go) but I accidentally indicated I’d pick up my rental car from the airport in Waterloo, Iowa, USA (where I was not). It pays to be specific! 🙂
Trends for both charts are up. A cherry pick today via a point to point line today is different from one next month.
Doug Ford doesn’t make much sense other than “I promise I’ll cut taxes, just you watch” and speaks like his brother Rob.
As I said, recentism (using the “last” number) is stupid, but it is used by both warmists and non-warmists, and has the point that variation is large compared to the calculated trend.
I’d rather not see this kind of approaches.
In all, it’s actually about 30% of Earth’s surface, i.e., land where global warming has little to no effect.
30% may be correct. Since part of your percent is the “little warming” portion, then it is safe to say that 70-80% of the earth shows warming. That coincides nicely with the fact that warm records outpace cold ones more than 2:1.
Most if not all our temperature records, heatwave frequency and drought records in Canada, like those of the US, were in the decade mid 30s to mid 40s. My prairie homesteading family suffered this directly. Sweetgrass Saskatchewan still holds the high for Canada of +47C from July 1937.
Ive made the point that the 0.8C warming from their 1880s was much steeper than the jiggered temps that tout 0.8C rise between 1980 and 2000 – it had all occurred by the late 1930s without significant CO2 rise. Had Hansen not pushed the 30s temperatures down 0.3 – 0.4C and bent the 40 yrs of cooling that followed and had some of the same scientists certain we were heading into a manmade ice age, the 1990s wouldnt be hockey-sticking up dangerous warming. The 1998 el Nino wasnt thought to be a record at the time.
Since, we have learned that Greenland, Europe, Siberia, South Africa, Paraguay, Ecuador, and just a day or two ago China’s record temperatures were also in the 1930s. The patterns look the same and this fact will ultimately, after the clime syndicate is put out of business, lead to correcting temperatures back to a non- event by such strong corroborative information.
This shows it nicely, from the year 1900, forward.
http://notrickszone.com/2018/05/03/its-here-a-1900-2010-instrumental-global-temperature-record-that-closely-aligns-with-paleo-proxy-data/
The proxy records, rather than being merely the corroborating regional supports of weather tends and pseudo-cycles, etc., has now become the more reliable record, than the belief-based tweaking of ‘direct’ observation ‘records’ (perverted and false Weather Bureau bullsh|t).
The massive swing to conservatism is unstoppable at this time. The psychotic left are hell bent on the total demolition of Western culture along with a quite literal white genocide.
What do they do to half-white people like Obama? Do they get off with a fine? How white does one have to be to fear for their personal safety under the psychotic left’s regime?
obviously more than half…..he campaigned as half black….and immediately became America’s first black president
100%.
Kathleen Wynne the recently previous liberal premier was a nut job SJW as nutty as Trudeau, and looked like a male looking female Bill Nye. The liberal party lost so bad they lost official party status with only 7 seats. Trudeau will NOT be PM come 2019. Wynne is now requesting Doug Ford the new premier change the rules so they can have official party status. The nerve 🙂
Here is what is really happening and is going to happen as we move forward. This phony global warming scenario will be over!
AGW will be proven wrong as global temperatures fail to show any further warming much less now in a cooling trend.
Overall sea surface temperatures now in a nice down trend. This being due to very weak solar (UV/NEAR UV LIGHT ) which is what determines sea surface temperatures not the phony CO2/INFRARED relationship versus sea surface temperatures.
The North Atlantic now -.60c below 1981-2010 means needs to be monitored along with land areas in the high Arctic. This is a place where change could impact the global climate.
AGW THEROY – not one of the basic premises has come to be from the lower troposphere hot spot, to distinct stratospheric cooling, to a decrease in OLR, to a more zonal atmospheric circulation to overall sea surface temperatures warming.
ENSO a natural CLIMATIC FACTOR was responsible for the recent warmth not AGW. One can see this by looking at the MEI index over the past few years.
My two solar conditions for cooling are now present which are 10+ years of sub solar activity in general (which started in year 2005) and within this sub solar activity in general a period of very low average value solar parameters (which started in year 2018/late 2017) whose values are greater in degree of magnitude and duration of time which commonly occurs between typical solar minimums between normal sunspot cycles.
The theory is simple which is very low prolonged minimum solar conditions result in overall lower sea surface temperatures (less UV/NEAR UV LIGHT )and a slightly higher albedo(due to an increase in explosive volcanic activity and an increase in snow/cloud coverage the result lower global temperatures.
The geo magnetic field modifying the solar activity.
The upshot is a climatic regime change which happens in decades if not years. Since post Dalton times till now the climate has been in the same climatic regime. It is common to have temperature fluctuations of +/- 1 c within a climatic regime due to ENSO/VOLCANIC ACTIVITY.
When the climate changes to another climate regime it usually happens at the top of the previous climatic regime and changes in the opposite direction. This is what I think is taking place now with year 2018 being the transitional year. If one looks at the climatic history that is what it shows more often then not.
In addition if one looks at the climatic history they will see the climate of today is in no way unique, and that every period of prolonged solar activity has been associated with lower overall global temperatures.
I say if my theory is correct AGW will be proven wrong prior to year 2020.
Salvatore, I generally agree with your assessment of naturally-caused global cooling, starting anytime in the next few years. I’ve been writing this for many years – here is a recent post. I hope to be wrong – getting old and hate the cold.
http://notrickszone.com/2018/06/10/new-hell-climate-change-gets-certified-schellnhuber-prophesizes-end-of-civilization/
Hi Pierre,
Hope you are well.
These fanatics will believe in catastrophic global warming until Hell freezes over.
For the record, I predicted that natural global cooling would commence by 2020 to 2030, in an article published on 1Sept2002 in the Calgary Herald. I am now leaning closer to 2020 for cooling to start.
I hope to be wrong. Humanity suffers during cooling periods.
Best, Allan
You never outgrow your need for panic. I’ve lived through at least six doomsday scenarios that sweep over society like waves from time to time, sea levels notwithstanding. People — some people anyway — have a deep inner need to believe the world is coming to an end unless we do something DRASTIC. And SOON.
It’s usually about 3% science, and 97% being hard up for kicks. The alleged threat never goes away — there are still plenty of H-bombs out there, for instance, but daily headlines and ghoulish descriptions of thermonuclear annihilation are rare nowadays. Carl Sagan sort of turned into a parody of himself in his later career, the way Al Gore is now.
Nobody seems terribly worried about influenza mutating into something that knocks off a billion people or so, even though it could happen almost without warning. Screaming Mimis are a bore in the end. Chalk it up to doomsday fatigue.
Boondoggle: How Ontario’s pursuit of renewable energy broke the province’s electricity system
I figure that 12c/kWh at retail level is not expensive – probably forty years since Australia has retail prices at that level. Average retail price in Australia is 35c/kWh. In South Australia, including the service charge, price tops 60c/kWh (obviously at that price they do not use much so the service charge becomes a factor in the unit price).
You would think Australians would be kicking out any government that set rules that enabled tripling the wholesale electricity price but there is no major party offering anything different.
There remains very strong support for ambient generation in Australia. Anyone suggesting otherwise is immediately labelled a denier – see comments here:
https://reneweconomy.com.au/whats-behind-scare-campaign-on-rooftop-solar-blackout-threat-78729/#comment-3945053333
Greenies will rename it : Fort Denizen
No no, follow the gourd!
As an Ontario resident, I am so thankful, this could not have come soon enough. So important to stress, Rob Ford is on record saying scraping the carbon tax will be his FIRST order of business. That is a huge statement. Of course the usual (left) media is stating “The obvious solution to make up for the lost revenue is to simply run a deficit.” This just proves once again, carbon taxes are about revenue generation, not reducing CO2. Our leader and CO2 warrior Justin Trudeau just bought an oil pipeline Kinder Morgan Trans mountain for 4.5 Billion.
https://www.huffingtonpost.ca/christine-van-geyn/doug-ford-carbon-tax-promise_a_23457365/
https://globalnews.ca/news/4255416/justin-trudeau-kinder-morgan-trans-mountain-seats-bc/
Doug Ford.. but I second that emotion.
Ontario Premier is Doug Ford not Rob!!!
“The Land That Global Warming Forgot”
It’s hardly “Land”. But it also just isn’t true for Australia. UAH gives the trends since 1979 at the bottom of their data file. Australia is 0.18 °C/decade, considerably higher than global 0.13 °C/decade.
“Nick Stokes
“The Land That Global Warming Forgot”
UAH gives the trends since 1979 at the bottom of their data file. Australia is 0.18 °C/decade, considerably higher than global 0.13 °C/decade.”
0.05c, 5 100’s of a degree, is considerable? That’s well within error ranges.
“That’s well within error ranges.”
Indeed, error ranges on UAH for an area like Australia are large. But no-one seemed to notice them when the article said:
“There has been no increase over the last 40 years. Since global warming has to start in the atmosphere, there has been no global warming in Australia. No Australian under the age of 40 has experienced global warming. “
And it just isn’t true. It may be uncertain that warming is greater than global. But it is not certainly zero. The evidence favors greater than global.
Nick,
I am sure a man as wise as you wpild be fully aware of the level of homogenization in Oz>>>
This is UAH satellite data
Only since 79. We came out of a cold period. It’s a cherry pick
“It may be uncertain that warming is greater than global. But it is not certainly zero. The evidence favors greater than global.”
St. Thomas More wrote, “A Dialogue of Comfort against Tribulation” while imprisoned in the Tower of London in 1534.
In it he “coined” the now well known idiom, “grasping at straws”, which appears to be applicable here.
Well, so far you’ve explained the origin of the term.. And that’s all you’ve done. Care to actually do the bit that matters and explain exactly what you are responding to that is grasping at straws, and why you think that label is reasonable?
Sure – if it is uncertain that warming is “greater than global,” how can it be true at the same time that warming is greater than global?
Maybe “grasping at straws” is the wrong characterization after all…now it looks more like contradiction.
Australia has been experiencing warm records over cold one at about 5:1.
That’s expected when warming occurs.
If records are the standard, then shouldn’t I believe that these sufficiently contradict your premise?
Why are your warm records better than my cold ones (hint: why is your faith more rational than mine)?
The winter that wouldn’t end: cold continues, sets records
https://www.accuweather.com/en/weather-blogs/weathermatrix/the-winter-that-wouldnt-end-cold-continues-sets-records/70004626
2017–18 North American cold wave
https://en.wikipedia.org/wiki/2017%E2%80%9318_North_American_cold_wave
First Week of 2018 Was the Coldest on Record in Dozens of Cities in the East
https://weather.com/storms/winter/news/2018-01-09-coldest-first-week-of-january-on-record-east-2018
Your cold records are duly noted. Yes, everyone agrees that there are both warm and cold records.
But everyone ALSO agrees that there are more warm records set than cold records in the past few decades.
This “well I can show you cold snaps” nonsense is absurd. Nobody forgot to record them. They are in the part we call “cold records” and is why the 2:1 ratio is so alarming.
“This “well I can show you cold snaps” nonsense is absurd.”
Agreed! Now you’re beginning to get it!
E.g., just like your “well I can show you hot snaps”?
(BTW, you argued for 5:1 in the first post, now it’s down to 2:1. You’re losing ground fast.)
Only when you use a 1961-1990 baseline, as the BOM does.
Yeah I think David Archibald shot himself in the foot by showing the full 40 years of UAH data which clearly shows a warming trend. Usually a cherry-picked section of the data is shown to make it appear there is no trend.
It is not 40 years but the pause is strong in Australia ; since begin 1998 the trend is flat.

And taking into acount the Pinatubo cooling the trend from 1990 on is very small.
Santer showed this for the globe:
Even warmist Carl Mears from the RSS says: the troposphere has not warmed quite as fast as most climate models predict. Note that this problem has been reduced by the large 2015-2106 El Nino Event, and the updated version of the RSS tropospheric datasets.
http://www.remss.com/research/climate/
http://images.remss.com/figures/climate/RSS_Model_TS_compare_globev4.png
http://images.remss.com/figures/climate/RSS_Model_TS_compare_trop30v4.png
RSS-tropics model and observations
http://images.remss.com/figures/climate/RSS_Model_TS_compare_trop30v4.png
I have to agree with Nick in this one. Article says stable……data shows higher than global average
If you control for the Urban Heat Island Effect, the entire globe is the land that global warming forgot.
Forensic Science; Why Michael Mann Chose Only the Past 1000 Years to Reconstruct
https://co2islife.wordpress.com/2018/06/15/forensic-science-why-michael-mann-chose-only-the-past-1000-years-to-reconstruct/
There is no urban heat island effect. BEST proved that.
I see lots of downvotes for Curry’s work. Very interesting.
Interesting. I live in Arvada, Colorado. I work in Denver, Colorado, approximately 8 miles as the crow flies. It is consistently 5 to 6 degrees warmer in Denver, nearly without fail, year round.
No UHI?
Reeeeeheeeeeheeeeaaallllyyy?
Find a new religion bub, this one severely limits your logical capabilities
David, FYI, sea level measurements at Fort Denison, Sydney go back to 1886. Is there a reason you only start at 1914?
There are 2 series of tide gauge data for Fort Denison
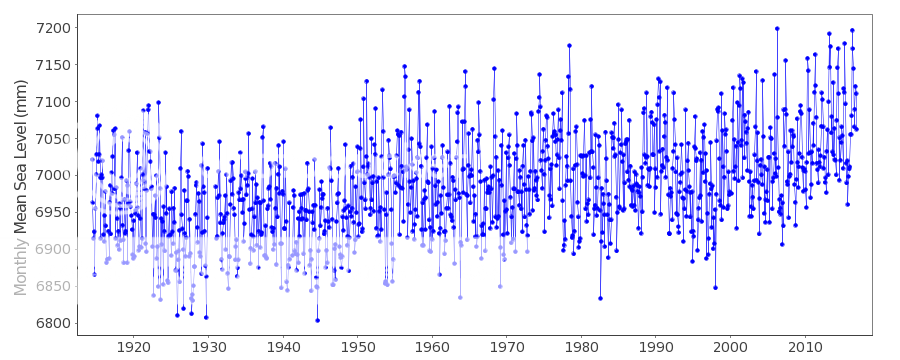
1/ 1886 – 1993
2 1914 – 2016
I think there is a trend rise of about 11cm over 100 years
But currently there is also a sinking which would give 4cm drop over the same time.
So about 7 cm of sea level rise over 100 years.
You will note the the Govt. series starts in 1914.