Guest essay by J. Scott Armstrong
In his 2007 book, Assault on Reason, former U.S. Vice President Albert Gore claimed that “many scientists are now warning that we are moving closer to several ‘tipping points’ that could, within as little as 10 years, make it impossible for us to avoid irretrievable damage to the planet’s habitability for human civilization.” Ten years later, the results are now in, or so UN Climate Change Executive Secretary Patricia Espinosa would have us believe. In the first week of May 2018, the UN released its annual report with the conclusion that “Climate Change is the single biggest threat to life, security and prosperity on Earth.” And, on May 23 this year, an editorial in Nature published projections of severe economic damage from dangerous global warming. So is the Earth really becoming dangerously warmer?
In 2007, Kesten Green, from the University of South Australia, and I published “Global Warming: Forecasting by Scientists versus Scientific Forecasting.” In it, we evaluated the forecasting methods the 2001 U.N. Intergovernmental Panel on Climate Change (IPCC) used to derive their forecasts of dangerous warming. We concluded that their methods violated 72 of the 89 relevant forecasting principles in the Principles of Forecasting handbook. Even a single violation could render a forecast useless. The IPCC report included nothing to suggest that the authors were aware of the enormous improvements in forecasting methods and principles over the past century. (See here for the most recent description of methods, principles, and evidence).
The IPCC used selected expert opinions about the effects of carbon dioxide levels and other variables to create computer models that provide the numerical and graphical basis for their “scenarios”—detailed stories of “possible” futures. Scenarios have no validity for forecasting, as they are based only on experts’ ideas about what might happen. In practice, the use of scenarios encourages extreme forecasts and gives decision-makers unwarranted confidence in the forecasts. (See a review of the evidence.) Other experts consider the IPCC’s scenarios to be implausible; see, for example the Global Warming Petition Project, which was signed publicly by more than 30,000 [scientists and engineers].
In 1980, I published a review of research on expert forecasts. The review led to the conclusion that experts’ forecasts about complex uncertain situations are no more accurate than those of non-experts. Most people resisted the conclusion, resulting in the Seer-Sucker Theory: “No matter how much evidence exists that seers do not exist, suckers will continue to pay for the existence of seers.”
This general conclusion about experts applies to environmental issues. For example, at the first Earth Day in 1970—when global cooling was a major concern—a widely quoted expert, Paul Ehrlich, predicted that between 1980 and 1989, four billion people, including 65 million Americans, would perish due to lack of food and other resources.
The above failings prompted me to challenge Mr. Gore to a ten-year $10,000 bet on the most accurate way to forecast global temperatures. The bet was proposed as an objective effort to focus attention on assessing the accuracy of alternative forecasting methods. I forecasted that there would be no long-term trend. Interestingly, this is consistent with the IPCC report’s conclusion in their technical section on forecasting, which stated that due to the complexity of the problem: “the long-term prediction of future climate states is not possible.” (That observation was ignored in the IPCC’s administrative summary.) My forecast is also consistent with the Golden Rule of Forecasting, which is to be conservative when forecasting in an uncertain situation. Nevertheless, I was not highly confident that I would win the bet due to the common range of natural variation over a ten-year period.
Mr. Gore declined my challenge. So, I used the 2001 U.N. Intergovernmental Panel on Climate Change (IPCC) projection of 3°C-per-century warming as a relatively conservative forecast to stand for his undefined but rather alarming sounding “tipping point.”
Kesten Green monitored the bet from 2008 through 2017 by using monthly satellite data from the University of Alabama at Huntsville. Satellite data are more reliable than land-based stations, which are often contaminated by poor maintenance, elimination of stations, urban areas, and unexplained adjustments to historical data. Furthermore, in line with the IPCC report’s concern—“reverse the decline of observational networks in many parts of the world. Unless networks are significantly improved, it may be difficult or impossible to detect climate change over large parts of the globe”—the satellite data cover the whole Earth. Thus, we refer to the satellite data graph as the “Whole Earth Thermometer.”
Which method provided forecasts with the smallest errors? Over the 120 months of the original “bet,” ending on December 31, 2017, the absolute errors of the no-trend forecast were 12% smaller than those of the IPCC’s “dangerous warming” projection.
I am extending the bet by ten years. My bet is that the no-change model will be more accurate over the 20-year period beginning in 2008 and running through 2027, retaining 2007 as the base year.
I am confident about winning the extended, 20-year bet. Why? In 2009, Kesten Green, Willie Soon and I published a paper in the International Journal of Forecasting in which we compared the accuracy of forecasts based on the IPCC projection with the accuracy of no-trend forecasts. The IPCC authors had explained that, “global atmospheric concentrations [of carbon dioxide, etc.]…have increased markedly as a result of human activities since 1750.” So, we used the U.K. Met Office Hadley Centre’s complete land-temperature data from 1850—when the industrial revolution was in full swing—through 2007. We made forecasts every year from 1850 through 2007 (the complete series) to forecast one-year-ahead, two-ahead, and so on, up to 100-years-ahead. As the forecast horizon increased, the IPCC forecast errors increased consistently and rapidly versus the no-trend forecast. For horizons 91to100 years, the errors were, on average, 12.6 times larger than those from the no-trend forecast. To our knowledge, that paper is the only peer-reviewed article published in a scientific journal that provides long-range forecast of global mean temperatures that complies with scientific forecasting methods and principles.
In 2014, we used the same procedures to analyze temperatures covering the 1,820 years from 116 through 1935, (the complete time series) again finding no evidence of warming. Instead, the forecast errors of the global warming hypothesis were twice those of the global cooling hypothesis, which, in turn, were twice as large as the forecast errors from the no-trend model.
Finally, Kesten Green and I contacted experts for examples of situations analogous to global warming, and also consulted the literature. Out of 71 analogous situations, 26 met our criteria that the alarm was: (1) based on forecasts of human catastrophe arising from effects of human activity on the physical environment, (2) endorsed by experts, politicians and the media, and (3) accompanied by calls for government action. The government acted in 23 of these 26 situations (e.g., DDT, acid rain, global cooling, and mercury in fish.) All of those alarming forecasts were based on experts’ opinions, rather than valid forecasting methods. None of the forecasts came true. The government policies were found to be harmful in 20 of the situations, and beneficial in none. (Green and Armstrong, 2011.)
Failing scientific evidence to support their case, advocates of the dangerous manmade global warming hypothesis have turned to the “Precautionary Principle,” which argues that uncertainty—ignorance about the situation—requires immediate action. That is a political principle, not a scientific principle, and the appropriate citation for it is George Orwell’s Nineteen Eighty-Four.
In contrast, I suggest that you ignore expert opinions about climate change. Instead, follow the Golden Rule of Forecasting to be conservative. In addition, monitor temperatures using the objective Whole Earth Thermometer along with a predetermined benchmark year, whether Gore’s revelation or the first use of satellite data, to determine whether there is indeed a very long-term warming (or cooling) trend that goes dangerously beyond normal variations before considering actions.
Dr. J. Scott Armstrong is a Professor at the University of Pennsylvania. In the interest of full-disclosure, he states that he is biased toward more warming because, in his opinion, the Earth is below its optimum temperature level.
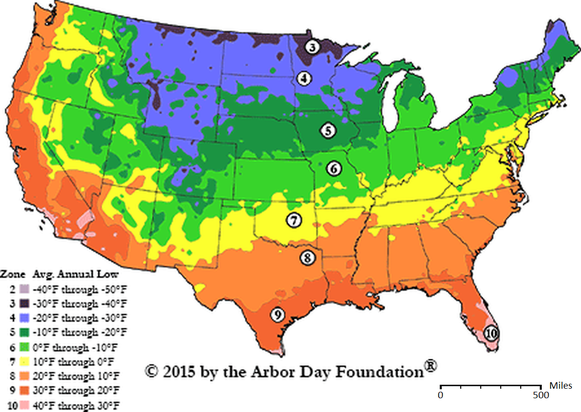
In general, the effect of an increase or decrease in temperature can be estimated by examination of a growing / hardiness zone chart, like this one for the United States:
http://sealevel.info/zones-2015_129pct.png
If you compare the scale-of-miles to the zone sizes you can see that a 1°F change in temperature is equivalent to a shift in latitude of about 30-40 miles — barely noticeable.
From the rule-of-thumb in Hansen 1988 (“A warning of 0.5°C… implies typically a poleward shift of isotherms by 50 to 75 km…”) we get 34.5–51.8 miles per 1°F change in temperature, which seems a bit high.
(But the zone shift might be a little more than that, since hardiness zones are mostly determined by low temperature extremes and freeze timing, and global warming is predicted to mostly increase nighttime lows in winter, with little effect on summer highs.)
Now compare that 30-40 mile shift to the range of climate zones where most crops are grown…
E.g., potatoes:
http://potatoesusa.com/us-potato-industry/us-growing-regions
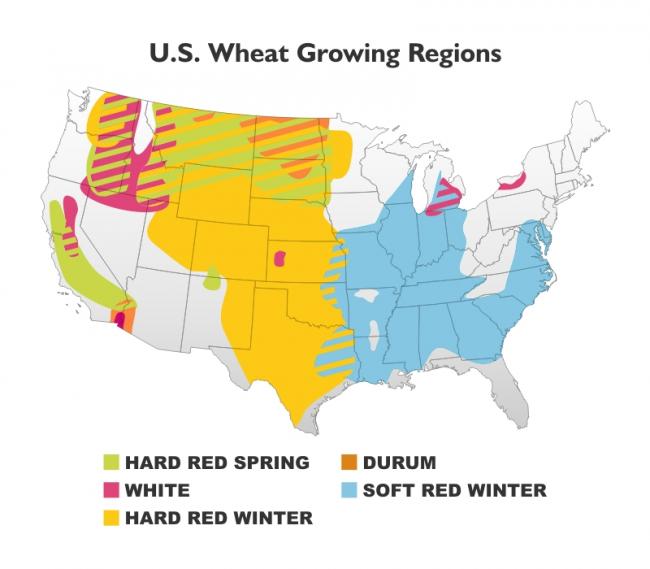
or wheat:
http://media.barchart.com/cm/articles/cache/a4e1560a45cce5761e34586e2d100248.jpg
or corn:
http://www.robinsonlibrary.com/agriculture/plant/field/graphics/corn-usmap.gif
The claims that a degree or two of warming will devastate agriculture do not pass the laugh test.
Heat makes the rate at which wheat grains fill faster. This is known to create individual grains that weigh less if temperature above varietal optimum.
In certain kinds of tested wheat temperature 1°C above optimum accelerated grain filling by 3.1 days quicker resulted in 2.8mg lighter end product. Other researchers estimate that for every 1°C above optimum wheat kernels obtained were 1.5mg lighter.
When look at studies demonstrating higher CO2 boosts wheat yields we need to know the temperature trialed. One early (1998) researcher using 660 ppm CO2 found that at only 1°C extra that CO2 gave a 25% higher yield & 5 shorter days of growth. Giving 2°C extra gave a 16% higher yield & 10 shorter days of growth at 660ppm CO2. Yet once giving 3°C extra gave only 2% higher yield & 13 days of shorter growth at 660ppm CO2. And once wheat strain grown 5°C above optimum yield declined by 32% despite grown at 660ppm CO2.
My personal assumption is that advances in crop science will meet climate challenges.
I don´t know if it can be qualified as ironic but the fact is that the infamous Mann´s temperature versus time hockey stick graph is actually a plant growth versus time graph where tree ring width is used as a proxy for temperature. So even the Mann himself acknowledges that plants grow more as temperature increases.
You have wheat growing in southern Texas and wheat growing in northern Alberta. What is the temperature difference between the two locations.
Hi Bill Illis,
Am writing on small tablet & see my reply posted 2 June 6:59am way under other comments below, if interested. I also added the following detail there, which may or not have come through.
Individual wheat grains develop from the meri-stem (stem cell niche) on a spikelette. Spikelettes develop on a spike during what is called the “double ridge stage”.
Higher than optimum temperatures at this double ridge stage speeds up that shoot apex phase. Consequently there is less time for spikelettes to develop on a spike before flowering.
Here’s my misplaced comment:
Texas sows “winter” wheat for harvest on average from May 25th to July 7th.
Alberta harvests it’s wintering over wheat around mid-August.
High protein Durham wheat, favored for pasta manufacture, is sown in spring. Alberta can grow Durham & most for U.S.A. is grown in the Dakotas (ie: not a Texas crop)
But with different kinds of wheat, planted and harvested at different times.
Of the five classes of wheat, ie hard red winter, hard red spring, soft red winter, white and durum, HRW predominates on the Great Plains, but the farther north you get, barley and rye become more common.
In the inland Pacific Northwest, soft white wheat is the most common class. Even among HRW, different varieties and planting regimes occur.
Reposting the links with https instead of http, so that the images will embed:
U.S. growing / hardiness zone chart:
Potatoes:
Wheat:
Corn:
Sorghum:

Sorghum is an important crop from South Dakota to the southern tip of Texas. That range runs from the southern edge of zone 4 to the southern edge of zone 9, a span of 50°F = 28°C in average temperature. Potatoes, wheat & corn have even wider distributions.
Obviously, claims that one or two degrees of warming will devastate crops do not pass the laugh test.
In the real world, farmers are adept at adjusting strain selection and planting dates, to optimize yields for their locales. Studies which ignore that, and plant the wrong varieties, at the wrong times, can create the appearance of deleterious effects which will never happen in the real world. The technical term for that is “junk science.”
A lot of junk science gets published in high-profile, peer-reviewed journals:
Why Most Published Research Findings Are False, by John P. A. Ioannidis, 2005. PLoS Med 2(8): e124. doi:10.1371/journal.pmed.0020124.
ManBearPig will never take the bet. I agree, the Holocene Climatic Optimum seemed to be aptly named, and it was rather warmer than the present.
Upon further reflection, Gore was the greatest threat to the planet. It was a near miss comparable to a mile- wide meteor passage inside the moon’s orbit. He is only a fading menace today, but orbital return is possible with Bernie cycles.
🙂
An impact would result in the devastation of 100 Manhattens.
Seriously, look for more warming warnings as Summer is arriving in the regions of the world where most people lve.
Devastation of 100 Manhattans – is that a good thing or a bad thing? Assuming most of us don’t live anywhere near Manhattan. Or are we talking about drinks at a bar?
“The IPCC used selected expert opinions about the effects of carbon dioxide levels and other variables to create computer models”
I was not aware that the IPCC did any models.
The IPCC models are called the RCPs, the Relative Concentration Pathways, from which they generate their “projections”. Remember how often we have been reminded that they do not make predictions, only projections.
I think you will find they are Representative Concentration Pathways.
The models were done in the hotel, outside the convention hall.
They create models by running models.
I think the full quote from the IPCC is actually worse than you suggest:7
“The climate system is a coupled non-linear chaotic system, and therefore the long-term prediction of future climate states is not possible. Rather the focus must be upon the prediction of the probability distribution of the system’s future possible states by the generation of ensembles of model solutions.”
How exactly does one go about accurately predicting a probability distribution? When the future comes around, all you get is a single occurrence. How can you ever measure the accuracy of your predicted distribution at a given point in time with only a single state at any given point in time? It’s all just a pointless mathematical exercise that cannot be scientifically tested.
Kurt,
Bingo. You can neither prove nor disprove the validity of such hazy speculations. There’s one reason for that, which I can think of. It keeps fear-mongers employed for decades or more.
Wow – no sooner do I post on a theory that represents a single unique event using a probability distribution, than I seemingly appear to be in two distance places, mere minutes apart. Maybe Schroedinger had it right after all.
‘We don’t know where, we don’t know when… but something terrible is going to happen.’
Robin Williams
“No boom today. Boom tomorrow. Always boom tomorrow.”
Cmdr. Susan Ivanova, Babylon 5
Ivanova taught Murphy.
Kurt in Switzerland,
I’m reminded of the section in the Hitchhikers Guide to the Galaxy where the computer, Deep Thought, tells the philosophers that while it is compute-bound calculating the meaning of life, the universe, and everything, they will have millions of years of guaranteed employment speculating on what the answer will be.
If only we lived 10 lifetimes, then we would have a better chance to do so.
It wouldn’t matter how many lifetimes we live, when the thing they are predicting is a time-variant “probability distribution” where the only check on the accuracy of the distribution at any future point in time is a single sample. And remember that the individual samples themselves are multi-decade (e.g. 30 year) averages.
You can never test the accuracy of the probability distribution (the ensemble output of the models), ergo the purpose of the model simulations can’t be as a learning exercise to discover the behavior of the actual climate system. Instead, the whole exercise is premised on the unfounded assumption that the models are accurate, and the model output is presented in such a way as to minimize the risk that the models will be invalidated; so long as the actual future climate falls anywhere within the probability distribution, they get to say that the climate is consistent with the models.
It sounds like they think they will get a better guess by averaging a bunch of guesses. An average of several guesses is no better than any one guess on its own.
Averaging wrongness does not equal less wrongness.
The only correct mathematical interpretation of an average of a series of guesses (or predictions) is as a measure of an expected value of a next sequential guess (or prediction). No statistical measurement of a series of guesses (predictions) is relevant to the behavior of the system you are guessing about (predicting) because the data you are collecting relates to the hypothesis of how the system behaves, and is not data about how the system actually behaves.
When scientists treat the output of computer models as if it were actual data of the modeled system, they are literally fabricating data. In what other scientific discipline is it acceptable to fabricate data?
Your last sentence is a good description of the problem with models not just in climate science (where models predominate) but other disciplines as well. As Prof Hajek said abut an epidemiology study:
“The model only reflects whatever spurious assumptions are put into it. Starting with the opposite assumptions would generate the opposite result. This is no route to a scientific finding.”
Recently a bunch of serious climate scientists were arguing with Matt Ridley on Twitter that their models were producing “emergent data” that “proved” what ECS is. Either you are using known, accepted data to calculate ECS, in which case there is no doubt about it whatsoever and it can probably be calculated on a hand calculator, or you are using assumptions that are just assumptions to calculate it within the model and therefore it is just another assumption.
I think they got confused with weather forecasting with the typical “80% chance of rain”. I don;t mind that – because there will be many, many days with similar conditions when I can check if it rains 80 days out of 100.
But as you say, there will only ever be one June 2nd 2018, and having a range of probabilities of what that might look like is pretty pointless.
I will predict that in 10,000 years we will be well on the way to another ice age.
We are presently in a inter-glacial period of an ice age, no need to wait.
I’m going to make a long-standing bet that in ten years, we’ll still be hearing scare stories about ‘tipping points’, still another ten years out.
And it’ll be worse than they thought.
Just like we got ten years ago. And ten years before that.
So have we tipped over or not?
Yes, if you live in the land down under…
I experience tipping points several times a week. Sometimes I tip distilled amber colored liquids. Sometimes I tip fermented fluids of varying colors. Other times I tip waitresses well. I have even been known to tip a green stick with a sausage… or a marshmallow…. and toast them to perfection over a toasty fire, before consuming them with the aforementioned fermented fluids.
None of these tipping points have had an adverse effect on the global climate…. but they do seem to improve the local ambiance and cordiality of all involved participants.
Don’t worry, tip and be a happy!
Yes indeed.
Those are tipping points one can predict to almost the minute.
Accurately.
One might call them tippling points.
A fine example of the no-trend method of forecasting. I would not bet against you, Joel.
Which is absolutely true…
Climate Change is the biggest threat…because it is utilized by Big Green as a hammer to pull government funds away from places that the $$$ are really necessary.
Severe economic damages from dangerous global warming is also true because $$$ that could be put to good economic use are instead being squandered on Big Green Schemes like unreliable low density “renewable” energy like (Solar and Wind) or (Biomass that involves tearing up the Carbon Sink)
Bryan! Your observation is absolutely Brilliant!!! Just add the word “Story” to “Climate Change” and you hit the Bullseye!!!
Philip Tetlock researched that for a couple of decades. It’s true. A dart-throwing monkey is generally better at predicting the outcome of uncertain events than are experts.
I would like to see a calculation of the cost (total including construction and property purchase) for an electrical storage system (Battery, Pumped storage, Gravity driven rail cars, etc,) for just each of the 100 largest/most populous cities in the USA providing a capacity equivalent to one week electrical usage.
Now how many nuclear power plants can be built for that same price?
“The review led to the conclusion that experts’ forecasts about complex uncertain situations are no more accurate than those of non-experts.”
Experts fall back on what they have been trained in. Specifically in most cases this is training in a Gaussian distribution and uncertainty of an event termed in a sigma level. Nassim Taleb in his seminal Black Swan argues Mandlebrot’s fractals are the better way to judge uncertainty in the occurrence of rare events in the world around us.
Fractals are scale invariant. Fractal is the word Benoit Mandlebrot coined to described the broken and rough repetition of geometric patterns at different scales. The smallest parts resemble the whole.
Nassim Taleb also quotes in his BlackSwan book Fed Chairman Alan Greenspan talking about market volatility blurted out, “I’d rather have the opinion of a trader than a mathematician.”
Non-experts are like the experienced sailor who knows and can read the winds and the sea far better than an expert in oceanography and wave-mathematics. They are the 70-year old farmer whose been on the land for his entire life and knows when he’s being sold snake oil by charlatans like Catherine Hayhoe on her climate change droughts.
Weathermen and climate projectionists like to push the ideas of 100-year events, 500-year events, or 1000-year events. In a Gaussian world this makes sense. But in a fractal world, it is nonsense.
So it is Ellicott City MD getting hit by what Gaussian thinking Forecasters called a 500-year flood event in 2016, only to have it happen again in last week (two years later, 2018).
In short, the climateers exploit the fractal patterns of nature to claim increasing extreme events tat defy the Gaussian sigma.
Agree. Climate isn’t becoming more extreme. What is changing is the length of time we have been observing.
And what we are observing is not a coin toss. Rather it is a toss of the dice in which the number of dice is changing with each toss.
Predict the value of the next toss.
“So it is Ellicott City MD getting hit by what Gaussian thinking Forecasters called a 500-year flood event in 2016, only to have it happen again in last week (two years later, 2018).”
The Ellicott flood has probably been covered in other posts but I’ve read and heard media reports several times over the past week that this year’s flood was a once in 500 year event.
Granted, the source is Wikipedia but …
“Ellicott City has had major devastating floods in 1817, 1837, 1868, 1901, 1917, 1923, 1938, 1942, 1952, 1956, 1972 (Hurricane Agnes), 1975 (Hurricane Eloise), 1989, 2011, 2016, and 2018. The 1868 flood washed away 14 houses, killing 39 to 43 (accounts vary) in and around Ellicott City.”
Based on 10 floods during the 1900s, this year’s flooding was a 50 times in 500 year event. I wouldn’t recommend Ellicott City for real estate investment.
From Al, it might have been better stated, “in as few as ten years or as many as ten million years we’ll have some quantity of change”.
All you can say for sure is “weather happens”. Excessive heat, excessive cold, excessive rainfall and drought, with varying mixtures and degrees. This whole media circus over it is only a cover for the underlying global political coup intended by the progressive socialist activists like Gore.
Since we’re mentioning Gore here…
Pinwheels and Mirrors
A long time ago (in the 80’s or so),
Al Gore warned that warming would soon be alarming;
“Our children won’t know what it’s like to see snow!
Our atmosphere we must stop harming!”
He’d studied in college, Revelle and Strong’s knowledge.
Then, over years of political careers,
He pondered this notion: The atmosphere and oceans
Are useful to raise public fears.
He made presentations to all the world’s nations.
His film (sci-fi trash) was a box office smash!
Academy sensation! Oscars, nominations
And copious currents of cash!
Then unto him fell the Peace Prize, Nobel…
Authority, on him was now vested.
(Debates he must quell, for he knows quite well:
Models failed when reality tested.)
So, grew the meme of anthropogenic extreme.
While insiders profited highly,
Those who objected were quickly subjected
To ridicule (and regarded vilely).
Pinwheels and mirrors now litter the lands…
Power lines, mile after mile.
On high plains, sea cliffs and desert sands
Our vistas, they now beguile.
But, collectors of government subsidies
Find them a beautiful sight,
These mechanical menaces… begging a breeze
Or a sunbeam to make their cost right.
Decades upcoming threaten cold’s icy numbing-
Nature’s cycles, in concert, are waning.
The slowness to warm should have cancelled alarm,
But Al never ceases campaigning:
“We humans are bad, with our fossil fuel fad,
It’s a fast-building carbon disaster!
And now it’s two-fold! It’s causing the cold
And the hotness to come so much faster!”
Yet, while he’s pleading that all should be heeding
His carbon reduction ambitions,
He hopes you’re not seeing his own footprint being
Hundreds of families’ emissions.
Let’s hope he’s thought out, while jetting about,
The messages of his actions.
By far they outweigh any words he might say,
In the minds of the wiser factions.
No.
I’ll tell you what is becoming more dangerous though.:After a cold late spring, local government here is not keeping up to speed with clearing the vegetation from the sides of local roads and cycle paths.
Increased CO2 and warmer temperatures can certainly be expected to make green things grow more vigorously, and I have anecdotal evidence that it may be happening. Would I want to forego the ensuing increase in all life-forms, fueled from the base up? No. Never. What I want is for them to employ more lawnmowers, not more people who claim that life is going to hell in a handcart. They are not scientists.
Satan, I will give you my soul for all eternity if you rid us of these idiots.
When?
Highest Recorded Temperatures:
Table of the highest recorded temperatures for each continent..
Place……………………………………………..- Date -……Fahrenheit
North America- (Death Valley), —- July 10, 1913——– + 134.0 F
Africa- Kebili, Tunisia——————- July 7, 1931 ——- + 131.0 F
Asia- Tirat Tsvi, Israel————- June 21, 1942 ———– +129.2 F
Australia- Oodnadatta, South Aust,–Jan. 2, 1960 ——- + 123.0 F
Europe- Athens, Greece————- July 10, 1977 ——– + 118.4 F
South America- Rivadavia, Argentina Dec. 11, 1905—- +120.0 F
Oceania- Tuguegarao, Philippines— April 20, 1912 -=- + 108.0 F
Antarctica*- Vanda Station, Scott Coast- Jan. 5, 1974 — + 59.0 F
http://wmo.asu.edu/
In the words of physicist Prof Howard “Cork” Hayden:
“If the science were as certain as climate activists pretend, then there would be precisely one climate model, and it would be in agreement with measured data. As it happens, climate modelers have constructed literally dozens of climate models. What they all have in common is a failure to represent reality, and a failure to agree with the other models. As the models have increasingly diverged from the data, the climate clique have nevertheless grown increasingly confident — from cocky in 2001.
http://www.americanthinker.com/articles/2014/02/climate_consensus_con_game.html
*Antarctic Record Temperature Con
https://notalotofpeopleknowthat.wordpress.com/2017/03/02/antarctic-record-temperature-con/
Nice stats.
“the UN released its annual report with the conclusion that “Climate Change is the single biggest threat to life, security and prosperity on Earth.””
Actually, the biggest threat to life, security and prosperity on the planet would be the UN.
That’s true as long as you’re not a UN bureaucrat.
;-}
+1 Time to get the US out of the UN.
and the UN out of the US
“In his 2007 book, ……….. within as little as 10 years,”
…and temps flat lined
Apparently he thinks an assault on reason is a bad thing.
When I was young, we had a thing called wisdom.
Folks like Al Gore valorize facts and logic over knowledge and experience. John Ralston Saul makes the point eloquently in his book Voltaire’s Bastards.
Reason, devoid of wisdom, is highly overrated and, in fact, quite dangerous. What unbridled reason produces is mostly castles in the sky and climate science.
1) How many positive feedback loops are there in nature?
2) Still waiting for evidence that current events are unique or even unusual in EARTH’S history (not just the last 100 years or a model of the last 100 years).
I think one of the biggest little problems we have in science now is that the press releases don’t match the data, but the public consciousness is being pushed by (and pushes against) the press releases, not the data. On top of that you have the community defending the press releases as if they were the data, and you have an awful mess.
How about avalanches? 🙂
There are a myriad of cases in engineering where you analyze system responses. I can’t think of any cases where you invoke feedback analysis unless you have actual amplification. It’s just not necessary.
I am not a mathematician but I suspect that Dr. James Hansen’s invocation of feedback is bogus.
The Precautionary Principle is a crock. The damage done by “doing something” is far worse than that caused by dealing with any reasonable climate changes. Switching to renewables will cause major deaths from power outages when cold snaps happen for example. High winds already have caused problems with wind farms being out of commission in the winter. Oh and how do you restore an infrastructure that is comprised of solar farms and wind turbines destroyed by hurricanes and other storms in some reasonable time? Look at Puerto Rico. Where’s all the power going to come for those electric vehicles? How much ecological damage will have to be caused to field enough solar panels and wind turbines?
Money diverted to build and fund renewables is money that could have been spent bettering the lives of people. Which means that people who could have been saved by the devices that weren’t invented will die.
Oh please. Trump is slashing foreign aid, that has nothing to do with what the US spends or does not spend on renewable energy. In fact, Trump is cutting what the US spends on renewable, AND still cutting foreign aid.
Fearful global warming has become a nursery rhyme that many people love too much to surrender to reality.
It, thus, will be around for as long as Santa or the Tooth Fairy.
When I was a kid, Santa and the tooth fairy always came through.
Just noting that my comments blink out of view and only show up later, so I have no chance to edit them, and I know that there is an editing feature here now, and so I seem to be banned from using it. (^_^). I best damn well get it right the first time. No editing for me. Keeps it interesting, I guess. I’m just glad I was finally directed to the site’s new location. If that message would not have appeared on the old site, I don’t know when I ever would have gotten here, … which might have been a blessing for some, if I didn’t.
Monte Carlo modeling has been replaced by Marco Polo modeling.
A whole .9c change since the Little Ice Age ended which pails in contrast to other temperature changes from earlier periods. I would go so far to say the period of temperature after the Little Ice ended to present is one of the most stable periods the earth has ever had for temperatures.
So this talk about the earth getting dangerously warm is ridiculous.
“Which method provided forecasts with the smallest errors? Over the 120 months of the original “bet,” ending on December 31, 2017, the absolute errors of the no-trend forecast were 12% smaller than those of the IPCC’s “dangerous warming” projection.”
But which forecast got it right? You forecast no change; the IPCC forecast warming. And it warmed. A lot.
“Kesten Green monitored the bet from 2008 through 2017 by using monthly satellite data from the University of Alabama at Huntsville. Satellite data are more reliable than land-based stations, which are often contaminated by poor maintenance, elimination of stations, urban areas, and unexplained adjustments to historical data.”
They aren’t more reliable. UAH V5.6 gives a much different answer than V6.0. But they also don’t measure what the IPCC was predicting. I’m sure you can find a “forecasting principle” to explain why that little detail doesn’t matter, but they don’t.
How much warming would have been measured if there had not been a super-nino? Atmospheric warming reflects ocean oscillations, not the reverse.
70s in Utah. The 80s were hot, and lively, and hot. 80s a couples of weeks ago. 40s a couple of days ago.
Dry air in reality doesn’t hold heat a whole lot better at .04% CO2 than it does at .035%, does it?