Observations during lunar eclipses show how Earth’s atmosphere has cleared, letting in more sunlight
Strange but true: You can learn a lot about Earth’s climate by watching a lunar eclipse. This week at the 46th Global Monitoring Annual Conference (GMAC) in Boulder, CO, climate scientist Richard Keen of the University of Colorado announced new results from decades of lunar eclipse monitoring.
“Based on the color and brightness of recent eclipses, we can say that Earth’s stratosphere is as clear as it has been in decades. There are very few volcanic aerosols up there,” he explains.
This is important, climatologically, because a clear stratosphere “lets the sunshine in” to warm the Earth below.
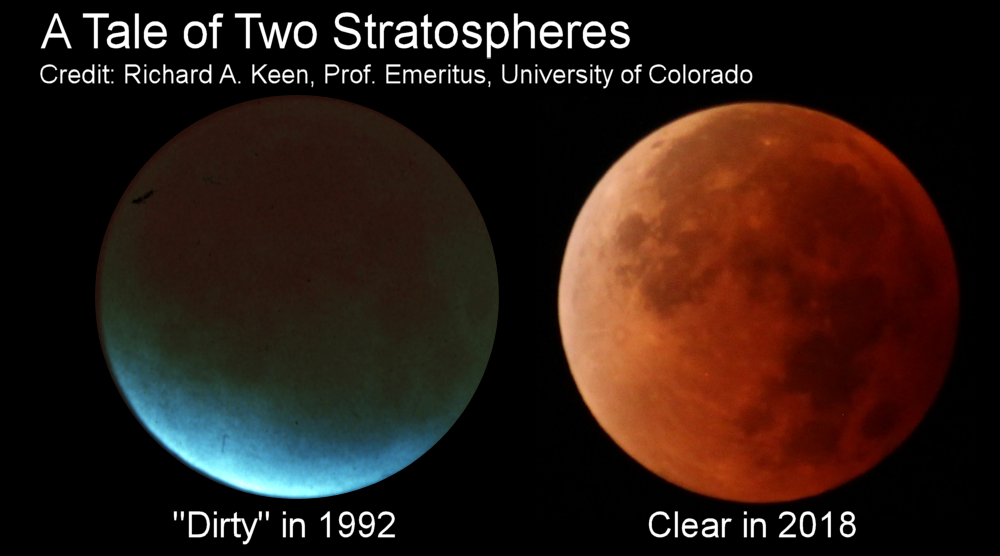
To illustrate the effect that volcanic aerosols have on eclipses, Keen prepared a side-by-side comparison (above) of a lunar eclipse observed in 1992 after the Philippine volcano Pinatubo spewed millions of tons of gas and ash into the atmosphere vs. the latest “all-clear” eclipse in January 2018.
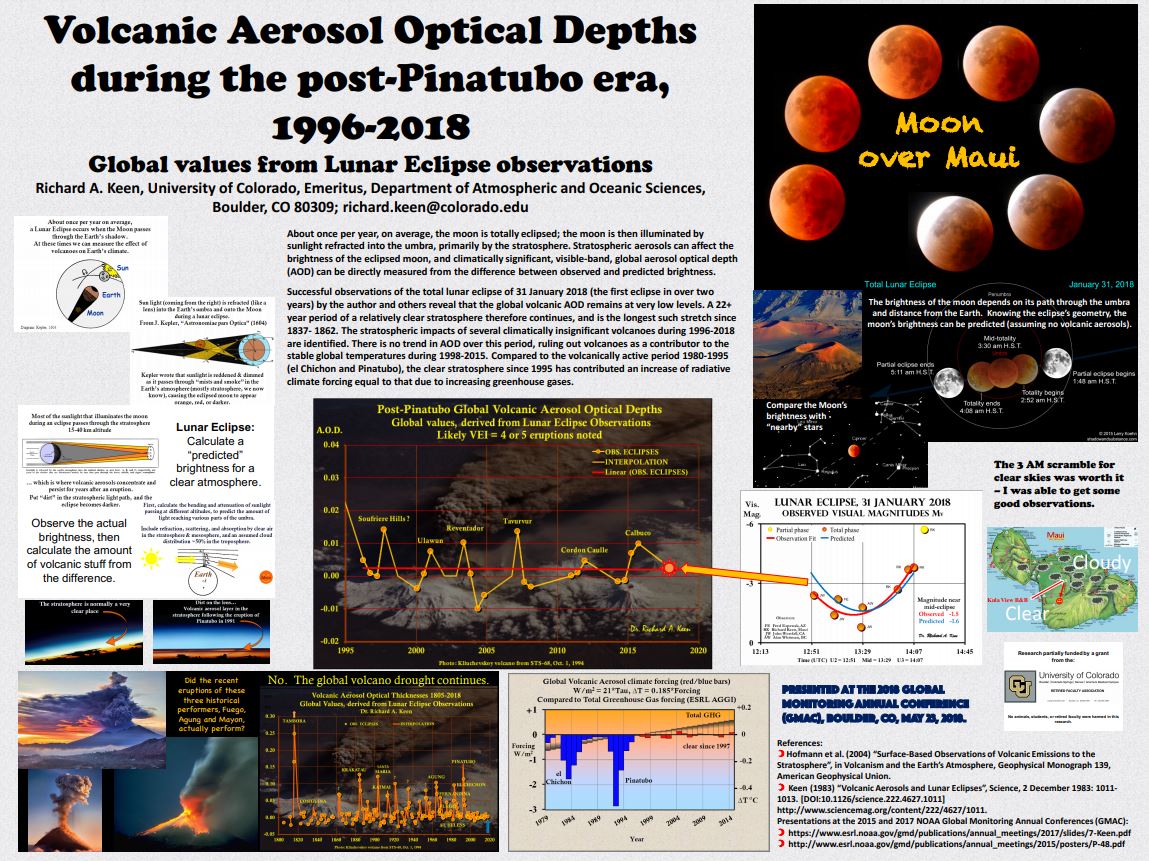
“Compared to the murky decades of the el Chichon and Pinatubo, the clear stratosphere since 1995 has allowed the intensity of sunlight reaching the ground to increase by about 0.6 Watts per square meter,” says Keen. “That’s equivalent to a warming of 1 or 2 tenths of a degree C (0.1 C to 0.2 C).”
“In other words,” he adds, “over the past 40 years, the decrease of volcanic aerosols and the increase of greenhouse gases have contributed equally to the total warming (~0.3 C) observed in global satellite temperature records.”
Total lunar eclipses happen somewhere on Earth typically once or twice a year. Keen is looking forward to the next one on July 27, 2018, which will be the longest lunar eclipse of the century. The Moon will pass almost directly through the middle of Earth’s shadow, remaining inside for 1 hour and 43 minutes. That’s just a few minutes shy of the theoretical maximum.
“This will give us plenty of time to measure the color and brightness of Earth’s shadow and, thus, the aerosol content of the stratosphere,” says Keen.
For more information about lunar eclipses and climate change, check out Keen’s poster from the GMAC.
It seems the idea of explaining that CO2 causes all temperature changes has been eclipsed.
Groan.
Crispin,
I don’t mean to cast a shade on your assertion but CO2 induced global warming has been accepted in totality (well….. 97% anyway).
97% of the theory has been accepted? 97% of the people accept it? 97% of all scientists accept it? 97% of all donkeys accept it?
Oh which oh which could it be? Maybe it is 97% of all window lickers accept it. It’s just so maddening. I am at a loss. The vagueness and lack of details make me feel all tingly.
…and Keen just said they were all wrong…..1/2 of it was from dirt
I have been pointing out for the last 4 or 5 years the effects of El Chichon and Mt P were to cause long term warming. It is not just the change between max volcanic pollution in 1992 and present but the change from BEFORE those irruptions and five years later.
https://climategrog.wordpress.com/uah_tls_365d/
oops lost the graph …
J Mac
Can we say that 97% of scientists accept 3% of the claims? I work with a lot of ‘scientists’ few of whom accept much of what is claimed at all. Once they delve into the climate claims and math and lack of certainty of the inputs, they revert to type: they flee from assurances and stand aside as mobs run hither and yon. They are too professional to get involved in foolish arguments.
Climate physics is a lot less certain than particle physics and particle physics has all sorts of maybe’s and if’s we-assume’s. The major difference is that particle physics has a body of replicable experiments and climate science bas a body of replicable beliefs. Scientists saying, “Trust me, I am a scientist,” has cache, while “Trust me I am a climate scientist,” does not. Pressed for mechanisms and details, the latter equivocates, endlessly. It is like trying to staple Jello to drywall.
Q. Why must we invent particles to explain the failure of the models to replicate past temperatures?
A. Jello
Q. Why is Miskolczi wrong about the unchanging optical thickness of the atmosphere?
A. Jello
Q. Why did sea level rise accelerate until 1930 and then rise constantly when CO2 emissions increased rapidly?
A. Jello
I have tried to mount these answers on my Wall Of Evidence. Jello just leaves a stain that doesn’t wash off.
“Why did sea level rise accelerate….when temperatures flat lined and even decreased?”
………jello
I provide an obvious (I thought) spoofing humorous response to Crispin’s humorous entree…. and y’all flip out.
Gads…. jello.
I guess I’ll have to use the /Sarchasm tag, even when replying to anothers untagged sarcastic comments.
…. and y’all flip out.
I think we were all trying to be funny too!
Oh look, jmac is using its Disqus name on here as well. Surprise, surprise.
I’ll once again point out that Cook et al. is a flawed study. It was not peer reviewed, it was performed by his buddies meeting for pizza and beer to guess as to the nature of what a paper’s abstract was really about, and conflates consensus with truth. There are a myriad reasons why Cook’s “97%” meme is false. Here’s a good explanation why:
http://iopscience.iop.org/article/10.1088/1748-9326/8/2/024024/pdf
AZ1971,
You can restate the obvious as many times as you like. The ‘97% consensus’ is a well documented farce, acknowledged long ago by anyone with a small understanding of basic statistics and survey methods.
“eclipsed” & “shaded”? You guys are on a roll today. But it would be “moon-shade” not real shade.
So “moonshine” has come back over the last 20 years? Good to hear 🙂
Sounds like y’all need some 97% Caffeine-free…. hey is 1962 when “97%” became part of the sales/marketing lexicon? Do the warmistas know that that is one of the biggest reasons most people chuckle at them for claiming 97% certainty about everything?
https://youtu.be/kQ3XHpHg7g8
97% of those previously tested as believing it still believe it given the incentive they have to forgo a lucrative career if they fail to continue to do so. it is a big enough part of the qualification to preclude those who do not from getting that qualification and so represents the ultimate in appallingly bad survey structure.
No, no, the idea is that cleaning up REAL air pollution adds to the forcing of CO2 as the new ” air pollution”.
Now, if we clean up the CO2 “pollution”, then this will cause something else to amplify warming. It never ends, you see. It just bounces around from one thing to another, because being afraid is such a positive psychological approach to modern living. Our level of civilized comfort has removed traditional daily threats from the picture, and so we have to create these other monsters, in order to fulfill our biological need to live on the edge. Without some sort of fear, a lot of people must get bored and feel dead.
I wonder whether the incidence of drug addiction would skyrocket, if the global warming scare ever went away.
Catastrophic Anthropocentric Climate Alarmists are lunatics.
“Lunatics” — I saw what you did there. (^_^)
Richard Keen wrote:
“Compared to the murky decades of the el Chichon and Pinatubo, the clear stratosphere since 1995 has allowed the intensity of sunlight reaching the ground to increase by about 0.6 Watts per square meter,” says Keen. “That’s equivalent to a warming of 1 or 2 tenths of a degree C (0.1 C to 0.2 C).”
“In other words,” he adds, “over the past 40 years, the decrease of volcanic aerosols and the increase of greenhouse gases have contributed equally to the total warming (~0.3 C) observed in global satellite temperature records.”
I wrote a similar conclusion in 2016 – see my post below. From my graph, it is clear that the peak cooling effect of volcanic aerosols from El Chichon and Pinatubo was 0.4C to 0.5C, not 0.1C to 0.2C as Keen stated, and each took volcanic aerosol event about 5 years to fully dissipate.
There is NO need to attribute any of the observed warming to increasing atmospheric CO2.
https://wattsupwiththat.com/2016/07/01/spectacular-drop-in-global-average-satellite-temperatures/comment-page-1/#comment-2250667
I plotted the same formula back to 1982, which is where I (I think arbitrarily) started my first analysis. Satellite temperature data began in 1979.
That formula is: UAHLT Calc. = 0.20*Nino3.4SST +0.15
It is apparent that UAHLT Calc. is substantially higher than UAH Actual for two periods, each of ~5 years, BUT that difference could be largely or entirely due to the two major volcanoes, El Chichon in 1982 and Mt. Pinatubo in 1991.
This leads to a startling new hypothesis: First, look at the blue line (a function of Nino3.4 SST), which shows NO significant global warming over the entire period from 1982 to 2016. Perhaps the “global warming” observed in the atmosphere after the 1997-98 El Nino was not global warming at all; maybe it was just the natural recovery in global atmospheric temperatures after two of the largest volcanoes in recent history.
Comments?
https://www.facebook.com/photo.php?fbid=1030751950335700&set=a.1012901982120697.1073741826.100002027142240&type=3&theater
I later added the Sato Global Mean Optical Depth Index to compensate for volcanic cooling.
https://www.facebook.com/photo.php?fbid=1618235531587336&set=a.1012901982120697.1073741826.100002027142240&type=3&theater
The blue line in the plot (UAH LT global atmospheric temperature calculated without Sato) is a direct function of NINO34 Sea Surface Temperature (SST).
The yellow line (UAH LT global atmospheric temperature calculated with Sato) is a direct function of NINO34 SST and the Sato volcanic air opacity index.
The red Line is the actual UAH LT global atmospheric temperature.
Correction of typo in my first post:
I wrote a similar conclusion in 2016 – see my post below. From my graph, it is clear that the peak cooling effect of volcanic aerosols from El Chichon and Pinatubo was 0.4C to 0.5C, not 0.1C to 0.2C as Keen stated, and each volcanic aerosol event took about 5 years to fully dissipate.
My posts appeared after a delay – not sure why – but it appears most of you missed them, because you keep asking about HOW MUCH and the answers are here:
Summary:
Industrial pollution does not have much impact on global temperature. Major (century-scale) volcanoes like El Chichon and Pinatubo definitely do cool the planet – by up to about 0.5C, fully dissipating after about 5 years..
The details are all here:
https://wattsupwiththat.com/2017/09/15/report-ocean-cycles-not-humans-may-be-behind-most-observed-climate-change/comment-page-1/#comment-2613373
Formula:
UAHLTcalc Global (Anom. in degC) = 0.20*Nino3.4IndexAnom (four months earlier) + 0.15 – 8*SatoGlobalMeanOpticalDepthIndex
Sato Global Mean Aerosol Optical Depth at 550 nm https://data.giss.nasa.gov/modelforce/strataer/tau.line_2012.12.txt
.
Volcano Magnitudes:
The 1982 eruption of El Chichon was VEI5.
The 1991+ eruption of Mt Pinatubo was VEI6, roughly an order of magnitude higher.
The scale goes up to VEI8, which is open-ended – a VEI8 volcano is going to do more than cool the planet – it’s pretty much going to ruin your day.
https://en.wikipedia.org/wiki/Volcanic_Explosivity_Index
VEI Ejecta volume (bulk) Classification Description Plume Frequency Tropospheric
injection Stratospheric
injection[2]
Examples
0 < 104 m3 Hawaiian Effusive 104 m3 Hawaiian / Strombolian Gentle 100 m – 1 km daily minor none
Stromboli (since Roman times), Nyiragongo (2002), Raoul Island (2006)
2 > 106 m3 Strombolian / Vulcanian Explosive 1–5 km every two weeks moderate none
Unzen (1792), Cumbre Vieja (1949), Galeras (1993), Sinabung (2010), Agung (2017)[citation needed]
3 > 107 m3 Vulcanian / Peléan/Sub-Plinian Catastrophic 3–15 km 3 months substantial possible
Lassen Peak (1915), Nevado del Ruiz (1985), Soufrière Hills (1995), Nabro (2011)
4 > 0.1 km3 Peléan / Plinian/Sub-Plinian Cataclysmic > 10 km (Plinian or sub-Plinian) 18 months substantial definite
Laki (1783), Mayon (1814), Pelée (1902), Sakurajima (1914), Galunggung (1982), Eyjafjallajökull (2010), Calbuco (2015)
5 > 1 km3 Peléan/Plinian Paroxysmic > 10 km (Plinian) 12 years substantial significant
Vesuvius (79), Fuji (1707), Tarawera (1886), Agung (1963), St. Helens (1980), Hudson (1991), Puyehue (2011)
6 > 10 km3 Plinian / Ultra-Plinian Colossal > 20 km 50 – 100 yrs substantial substantial
Laach Lake Volcano (c. 12,900 BC), Veniaminof (c. 1750 BC), Lake Ilopango (535), Huaynaputina (1600), Krakatoa (1883), Santa Maria (1902), Novarupta (1912), Pinatubo (1991)
7 > 100 km3 Ultra-Plinian Super-colossal > 20 km 500 – 1,000 yrs substantial substantial
Aira Caldera (22,000 BC), Kikai Caldera (4,300 BC), ( Cerro Blanco (c. 2300 BC), Thera (c. 1620 BC), Taupo (180), Baekdu (946), Samalas (1257), Tambora (1815)
8 > 1000 km3 Ultra-Plinian Mega-colossal > 20 km > 50,000 yrs[3][4] vast vast
Cerro Galán (2,200,000 BC), Huckleberry Ridge Tuff (2,100,000 BC), Yellowstone (630,000 BC), Whakamaru (in TVZ) (254,000 BC),[5] Toba (74,000 BC), Taupo (25,360 BC)
As the infulence of volcanic aerosols emerges from the shadows.
We need a new scale for particulate concentration. We could call it “50 Shades of Haze”
Keen discusses volcanic activity but I wonder just how much change has take place since WWII from the decline in anthropogenic particulates and pollutants. Few people appreciate how much money and effort have gone into reducing and removing anthropogenic particulates from the air beginning in the late 1950s. I wonder just how much more solar energy reaches the surface in the United Kingdom after their ban on soft coal for domestic use, where there had been no control over particulates.
“Few people appreciate how much money and effort have gone into reducing and removing anthropogenic particulates from the air beginning in the late 1950s.”
When one considers China, India and the third world, I wonder just how much our atmosphere has been cleaned up.
Trust them. Aerosols were the favored explanation for any logical holes in the global warming models, until the simpler method of just adjusting the temperatures to fit the model was used.
Tom Halla wrote:
“Trust them. Aerosols were the favored explanation for any logical holes in the global warming models, until the simpler method of just adjusting the temperatures to fit the model was used.”
I think you are generally correct Tom, thank you. Here is some supporting correspondence with Douglas Hoyt from 2006 and later.
Look up Hoyt – he is highly credible. There is more of my correspondence with Hoyt posted on wattsup.
https://wattsupwiththat.com/2017/01/29/this-is-how-climate-works-part-2/comment-page-1/#comment-2411784
COMMENTS FROM DR. D V HOYT IN 2006 RE CLIMATE MODEL TUNING, TO FALSE-FORCE THE MODELS TO HINDCAST THE GLOBAL COOLING THAT OCCURRED FROM ~1940 TO ~1975:
We’ve known the warmists’ climate models were false alarmist nonsense for a long time.
As I wrote (above) in 2006:
“I suspect that both the climate computer models and the input assumptions are not only inadequate, but in some cases key data is completely fabricated – for example, the alleged aerosol data that forces models to show cooling from ~1940 to ~1975…. …the modelers simply invented data to force their models to history-match; then they claimed that their models actually reproduced past climate change quite well; and then they claimed they could therefore understand climate systems well enough to confidently predict future catastrophic warming?”,
http://wattsupwiththat.com/2009/06/27/new-paper-global-dimming-and-brightening-a-review/#comment-151040
Allan MacRae (03:23:07) 28/06/2009 [excerpt]
Repeating Hoyt : “In none of these studies were any long-term trends found in aerosols, although volcanic events show up quite clearly.”
___________________________
This discussion should not take place without some numbers involved. How important are volcanoes, generally and specifically?
The Asian brown cloud (from India) is enormous, putting the bad combustion products of over 600m tons of biomass into the air each season. In China the difference is little: over 500m tons without all that coal smoke. Forest and peat burning in Indonesia clearing the virgin jungle to plant oil palms to supply the EU with biodiesel has a large output of particles. Land clearing in Brazil to plant soya, ditto. Annual grass burning in Southern Africa is very widespread over a whole sub-continent. Add to that all Siberian and Canadian forest fires, California if you must. There is a lot of material leaving the ground each year. How does this compare with the total for volcanoes? Yes they are influential, but they are influential against a backdrop of continuous emissions from combustion. If that background changes and there are no volcano eruptions, that is a double-whammy.
The next thing to do after quantifying the total mass, is the track where it goes. The smoke plumes from Southern Africa are lofted to Australia, proof for which is available from the SAFARI 2000 project in which more than 200 aerosol scientists tracked a deliberately created large scale fire by satellite, high altitude aircraft and ground observers. Does this material get high enough to affect transmission? At some altitude, yes.
Next, is the particulate matter strictly cumulative, short-lived or local and immediate in its effect? What is the clearance rate? The concept of optical thickness soon arises. Surely this can be easily measured on the ground? Remember the global dimming scare in the early 80’s? Soon there wasn’t going to be enough sunlight reaching the ground to grow crops. That was ‘all our fault’ too.
Claims for interference and change require context.
HI Crispin, hope you are well.
Please see my posts above – they may help. An over-simplification, but generally true to date.
https://wattsupwiththat.com/2018/05/25/climate-scientist-air-pollution-cleanup-may-be-major-driver-of-global-warming/comment-page-1/#comment-2826571
[excerpt]
Summary:
Industrial pollution does not have much impact on global temperature. Major (century-scale) volcanoes like El Chichon and Pinatubo definitely do cool the planet – by up to about 0.5C, fully dissipating after about 5 years.
https://wattsupwiththat.com/2018/05/25/climate-scientist-air-pollution-cleanup-may-be-major-driver-of-global-warming/comment-page-1/#comment-2826624
[excerpt]
Volcano Magnitudes:
The 1982 eruption of El Chichon was VEI5.
The 1991+ eruption of Mt Pinatubo was VEI6, roughly an order of magnitude higher.
The scale goes up to VEI8, which is open-ended – a VEI8 volcano is going to do more than cool the planet – it’s pretty much going to ruin your day.
Has anyone factored out the famous “back radiation effect” for a reduction in air pollution? Or didn’t they bother, since the math in AGW always magically works out, even when the fundamental under “lying”assumptions get changed.
Endless , damaging guesses . Endlessly accepted as fact, yet never actually correct.
Why some AGWers don’t know what back radiation is … after it’s been explained to them… then they think that the 303 K number is something I …. ” I ” big I, made up.
Finally an argument that makes sense.
Major volcanic activity has been nil this century thus far.
This of course does contribute to warming.
I expect this to change moving forward, that is an increase in major volcanic activity.
So why hasn’t it warmed this century? Just askin’. And why is it presently cooling?
Usually, there’s no presently in the climate, because the climate is at least 30 years long.
From the article: “In other words,” he adds, “over the past 40 years, the decrease of volcanic aerosols and the increase of greenhouse gases have contributed equally to the total warming (~0.3 C) observed in global satellite temperature records.”
They had to get the obligatory “greenhouse gas” plug in.
What does this mean for the ECS estimate since CO2 seems to have some help?
TA wrote:
“What does this mean for the ECS estimate since CO2 seems to have some help?”
Christy and McNider (2017) included the effects of volcanic aerosols and calculated a maximum TCS of +1.1C/(2xCO2) for the satellite era (since 1979). They ASSUMED (for argument only) that ALL non-aerosol warming was attributed to increasing atmospheric CO2. It is more probable that most of that warming was natural and CO2 played a minor role.
https://wattsupwiththat.com/2018/05/20/nasa-and-the-deep-state-creation-of-alarmism-about-climate-and-environment/comment-page-1/#comment-2823414
[excerpts]
If I read Fig. 1 correctly (from S. I. Rasool and S. H. Schnider, SCIENCE 1971), the sensitivity of climate to increasing atmospheric CO2 is estimated to be about 0.5C to 0.6C per [doubling of atm. CO2 from ~300 to ~600ppm], and there is NO real global warming crisis.
This low figure of climate sensitivity has been exaggerated by up to approx. ten times or more by climate modelers cited by the IPCC, slowly declining to approx. five times too high over the past decade or so. From the very beginning circa the 1980’s, global warming alarmism was a false, fabricated crisis. It is now the greatest scam, in dollar terms, in human history, wasting tens of trillions of dollars of scarce global resources.
[Institute for Space Studies, Goddard Space Flight Center, National Aeronautics and Space Administration]. Reports: Atmospheric Carbon Dioxide and Aerosols: Effects of Large Increases on Global Climate. SCIENCE, vol173, 9 July 1971
https://wattsupwiththat.com/2018/04/30/remember-how-climate-change-was-going-to-wipe-out-all-the-mountain-pikas-never-mind/comment-page-1/#comment-2804306
[excerpts]
… there is NO credible evidence that climate sensitivity is greater than about 1.0C to 1.5C/(2xCO2).
Christy and McNider (1994 and 2017) calculated a TCS of 1.1C/(2xCO2) using satellite data from 1979 to mid-2017. They ASSUMED (for the sake of argument) that ALL observed warming was caused by increasing atmospheric CO2, after accounting for the known cooling impact of volcanoes.
Therefore, this calculated 1.1C warming is an UPPER BOUND of climate sensitivity, and the probable value is less than 1.1C.
Lewis and Curry (2018) calculated an upper bound TCR of 1.2C and an ECS of 1.5C, using surface temperature data for the period from 1869 to 2016.
This low climate sensitivity suggests any manmade global warming will not be catastrophic – instead it will be mild and beneficial for humanity and the environment. Furthermore, atmospheric CO2 is not alarmingly high, it is alarmingly low in Earth’s history, and increasing CO2 from whatever source is hugely beneficial.
My best guess is that TCS is even lower, probably between 0.0 to 0.5C/(2xCO2). Furthermore, I expect we will see global cooling starting soon due to low solar activity, because much of the observed warming in the late 20th Century was natural, not man-made, and natural global cooling is probably imminent due to the decline in solar activity in Solar Cycle 24 and 25. Global average temperatures will probably trend cooler, not warmer, for the next several/many decades.
I hope to be wrong, because humanity and the environment suffer during cooling periods, but my predictive track record to date is infinitely better than the IPCC’s.
I bounded TCS at approx. +/-1C/(2xCO2) using the same assumptions as Christy and McNider (2017) – attributing all global temperature change to atm. CO2 and volcano aerosols – the minus 1C/(2xCO2) is derived from the global cooling period from ~1940 to ~1977.
In fact, TCS is probably between 0.0C and +0.5C/(2xCO2).
That is, IF TCS exists at all in significance – because I proved in 2008 that atmospheric CO2 trends LAG global temperature trends by ~9 months in the modern data record. CO2 also LAGS temperature by ~~800 years in the ice core record, over a longer time cycle. In summary, CO2 LAGS temperature at all measured time scales.
Since the global warming parameters TCS and ECS are based on the ASSUMPTION that CO2 primarily drives temperature, it is critical to this hypothesis that the cause precedes the effect, but it does NOT. The global warming hypothesis fails based on Precedence (Richard Feynman called this Causality).
In conclusion, the global warming hypothesis contends that the future is causing the past, a contention that is FALSE (within our current space-time continuum). It’s a bit more complicated than that, as I have explained elsewhere on wattsup, but not much.
This irrefutable fact disproved the catastrophic human-made global warming hypothesis ten years ago – there is NO credible human-made global warming crisis. This conclusion should have stopped the debate on global warming alarmism a decade ago, and it barely caused a ripple in the warmist juggernaut.
Since I published my paper on icecap.us in January 2008, I have given this specific issue a decade of thought, and I’m still quite sure that there is NO CREDIBLE GLOBAL WARMING CRISIS.
Regards, Allan
https://wattsupwiththat.com/2018/01/13/a-climate-history-lesson-extremism-of-stories-like-bomb-cyclone-is-a-good-thing/comment-page-1/#comment-2717714
Notes on the above analysis:
Using the same assumptions at Christy and McNider 2017 (~all changes are due to increasing atm.CO2), I estimated TCS equals MINUS ~1C/(2xCO2) for the global cooling period from 1940 to 1977, ~equal but opposite sign to the PLUS 1.1C calculated by Christy and McNider for 1979 to 2017.5.
I conclude that “This TCS is so low that there is no real global warming or cooling crisis caused by increasing atm. CO2.”
What is your predictive track record, Allan? Just curious, not accusative.
Allan,
Thanks for mentioning Rasool & Schneider’s 1971 paper. I think their Climate Sensitivity was 0.6 C, which is about what I got from my current study (0.68C). My derivation is on the right hand side of a poster from the 2015 GMAC:
https://www.esrl.noaa.gov/gmd/publications/annual_meetings/2015/posters/P-48.pdf
The reason R&S and I get the same number is that we both use simple radiative equilibrium – how much does a few extra watts of downward greenhouse radiation heat the ground, without fancy feedbacks.
My warming model is a one-line equation in the header of the table at lower right, an R&S used essentially the same equation. The main (small) difference between us is the amount of back IR from the sky due to 300 ppm of CO2.
I that poster the simple, low sensitivity model fits the observed temperature rather nicely. Subsequent models, run on supercomputers and the product of a billion $$$ climate industry, have done much worse.
Amazing, that R&S had the question solved nearly 50 years ago.
Dave Fair wrote:
“What is your predictive track record, Allan?”
Dave, what are the two most important issues in this “climate change” debate?
They are:
1. The catastrophic man-made global warming hypothesis,
and
2. Government programs to promote (and subsidize) “green energy”.
I suggest that anyone with competent mathematical and logical skills knows BY NOW that:
1. Catastrophic man-made global warming is a false crisis, unsupported by any credible evidence,
and
2. Green energy schemes such as grid-connected wind and solar power are not green and produce little useful (dispatchable) energy, due primarily to intermittency.
If someone still contests these facts after several decades of irrefutable evidence, then they simply do not want to admit the obvious truth.
However, we made these two clear conclusion in writing IN 2002, long before it was popular to do so. We clearly stated in our Rebuttal in the 2002 APEGA written debate:
1. “Climate science does not support the theory of catastrophic human-made global warming – THE ALLEGED WARMING CRISIS DOES NOT EXIST.”
2. “The ultimate agenda of pro-Kyoto advocates is to eliminate fossil fuels, but this would result in a catastrophic shortfall in global energy supply – THE WASTEFUL, INEFFICIENT ENERGY SOLUTIONS PROPOSED BY KYOTO ADVOCATES SIMPLY CANNOT REPLACE FOSSIL FUELS.”
I trust this is a sufficient predictive track record for any objective person. I suggest that the other six statements in our Rebuttal also materialized in those countries that fully adopted global warming and green energy mania.
Please also note that NONE of the IPCC’s very-scary predictions about catastrophic global warming, extreme weather, etc have materialized.
I have one remaining major prediction, published in the Calgary Herald on September 1, 2002:
“3. “If [as we believe] solar activity is the main driver of surface temperature rather than CO2, WE SHOULD BEGIN THE NEXT COOLING PERIOD BY 2020 TO 2030.”
Since we are not yet in 2020, this prediction still has a few years to run – but with SC24 the weakest in 100 years and SC25 looking similarly weak, this prediction is looking good, with global cooling probably starting closer to 2020 than to 2030. I hope to be wrong about this last prediction, because humanity and the environment suffer in a cooling world.
Regards, Allan
Source: “DEBATE ON THE KYOTO ACCORD”
PEGG, reprinted in edited form at their request by several other professional journals, THE GLOBE AND MAIL and LA PRESSE in translation, by Baliunas, Patterson and MacRae.
http://www.friendsofscience.org/assets/documents/KyotoAPEGA2002REV1.pdf
Allan, I would suggest that conclusions (your 1 and 2) are not predictions. Your prediction of cooling in the 2020 to 2030 timeframe is a prediction.
I am not arguing with you; CAGW is an unsupported political and rent-seeking scam.
Dave – I also correctly predicted the dramatic cooling event that Earth just experienced, but that was only predicted ~4 months into the future, based on Nino34 area SST’s.
https://wattsupwiththat.com/2017/12/14/where-the-temperature-rules-the-sun/comment-page-1/#comment-2696015
Thank you Richard Keen for your note and poster.
I sent you an email – hope you like it – comments welcomed.
Best, Allan
Some people prefer the term “climate change” rather than “global warming” – here is why:
The “Climate Change” hypothesis is so vague, and changes so often, that it is not falsifiable and not scientific. It should be rejected as unscientific nonsense – the prattling of imbeciles.
https://wattsupwiththat.com/2018/05/12/i-lose-sleep-over-climate-change-warmist-meteorologist-eric-holthaus-admits-to-soul-crushing-despair-i-confess-i-need-help/comment-page-1/#comment-2816081
THIS IS THE “CLIMATE CHANGE” ALARMISTS’ KEY STRATEGY:
“By having a vague theory, it’s possible to get either result.” – Richard Feynman.
“A theory that is not refutable by any conceivable event is non-scientific.” – Karl Popper.
The “Climate Change” hypothesis is so vague, and changes so often, that it is not falsifiable and not scientific. It should be rejected as unscientific nonsense – the prattling of imbeciles.
The “Runaway Global Warming” hypothesis is at least falsifiable, and IT HAS BEEN ADEQUATELY FALSIFIED:
1. By the ~37-year global cooling period from ~1940 to 1977;
2. By “the Pause”, when temperature have not increased significantly since the mid-1990’s, despite major increases in atmospheric CO2;
3. By the fact that Nino 34 area sea surface temperatures have not increased significantly since ~1982, and corresponding air temperatures increased largely due to the dissipation of the cooling impact of two century-scale volcanoes – in 1982 (El Chichon) and 1991+ (Pinatubo);
4. By the fact that CO2 lags temperature by ~9 months in the modern data record, and the future cannot cause the past (in this space-time continuum).
Regards, Allan
Dave Fair wrote:
“Allan, I would suggest that conclusions (your 1 and 2) are not predictions. Your prediction of cooling in the 2020 to 2030 timeframe is a prediction. I am not arguing with you; CAGW is an unsupported political and rent-seeking scam.”
We agree on the conclusions Dave. Re your concern about the wording, perhaps you are “splitting hairs”.
The two statements could easily have been written:
1. “Climate science does not support the theory of catastrophic human-made global warming – THE ALLEGED WARMING CRISIS WILL NOT EXIST.”.
(replace “DOES NOT” with “WILL NOT”)
2. “The ultimate agenda of pro-Kyoto advocates is to eliminate fossil fuels, but this would result in a catastrophic shortfall in global energy supply – THE WASTEFUL, INEFFICIENT ENERGY SOLUTIONS PROPOSED BY KYOTO ADVOCATES SIMPLY WILL NOT REPLACE FOSSIL FUELS.”
(replace “CANNOT” with “WILL NOT”)
Close enough? 🙂
OTHER SUCCESSFUL PREDICTIONS
in 1990 I wrote a Strategic Paper that predicted and detailed the steps needed for the successful turnaround of the moribund Canadian oilsands industry. These steps were all implemented, and Canada became the 5th largest oil producer in the world. This prediction was straightforward, because of the four major elements that caused the turnaround, I had already initiated or co-initiated three of them. These three elements were new tax terms, new royalty terms, and a production increase at that reduced unit cost from $18 to $12 per barrel of synthetic crude oil. The fourth major element vital to the turnaround was SAGD technology, done by others.
For verification, see my website at https://energy-experts-international.com/
and the
Calgary Sun article “WHEN THE OILSANDS HIT PAY DIRT” by Chris Varcoe, Sept. 25, 2017 at http://www.calgarysun.com/2017/09/25/when-the-oilsands-hit-pay-dirt
Hi again Dave.
I understand your issue – but isn’t whether a statement is a prediction (by your definition) just a minor matter of sentence wording?
For example, in the case below I could have:
a) advised the Alberta Energy Regulator that it must investigate the Mazeppa sour gas project and take action to ensure public safety.
or
b) advised the Alberta Energy Regulator that it must investigate the Mazeppa sour gas project and take action or thousands of people could die.
In both cases the meaning is the same, and both statements contain an implied prediction – in this case a conditional one – that if corrective actions are not taken, there is a significant probability that people will die.
One of the few objective measures of a scientific statement is its ability to predict future performance – some say this is the very essence of science. Then there is the classic test of a scientific hypothesis – “is it falsifiable or not?” In such cases, we are discussing its ability to predict future performance.
… end of soliloquy.
Best, Allan
ANOTHER SUCCESSFUL PREDICTION?
https://wattsupwiththat.com/2018/03/18/approaching-grand-solar-minimum-could-cause-global-cooling/comment-page-1/#comment-2768151
[excerpt]
THE MAZEPPA CRITICAL SOUR GAS STORY
I received an award this past week from the Society of Petroleum Engineers.
As an uninvolved citizen and a Professional Engineer, I was advised in May 2016 of an extremely dangerous situation. Following the Professional Engineers’ Code of Ethics, I investigated, established the facts and reported to the Alberta Energy Regulator (AER). This situation was then made safe by the AER.
This action by the AER is the most severe reprimand against any company in the history of the Alberta energy industry.
The potential death toll in a worst-case scenario could have totaled many tens of thousands – a Hiroshima-scale disaster.
Next week I get a spandex outfit, complete with a cape. 🙂
– Allan MacRae. P.Eng.
Public Documents:
1. AER SUSPENDS MAZEPPA PLANT OPERATIONS AMID CONCERNS
High River Times, August 27, 2016
“LEXIN FAILED TO COMPLY WITH AER REQUIREMENTS BETWEEN FEBRUARY AND JUNE AND WAS ORDERED TO SUSPEND ALL FACILITY AND INFRASTRUCTURE OPERATIONS ON AUG. 9.”
http://www.highrivertimes.com/2016/08/25/aer-suspends-mazeppa-plant-operations-amid-concerns
2. WATCHDOG TAKES UNPRECEDENTED STEP OF FORCING OIL AND GAS PRODUCER INTO RECEIVERSHIP
Calgary Herald, March 21, 2017
THIS ACTION BY THE AER (FORMERLY THE ERCB) IS THE MOST SEVERE REPRIMAND AGAINST ANY COMPANY IN THE HISTORY OF THE ALBERTA ENERGY INDUSTRY.
http://calgaryherald.com/business/energy/watchdog-takes-unprecedented-step-of-forcing-oil-and-gas-producer-into-receivership
3. LEXIN RESOURCES AND THE DARK SIDE OF ALBERTA’S DOWNTURN
CBC, April 24, 2017
THE MAZEPPA PROJECT WAS RUNNING 40% H2S. H2S IS HEAVIER THAN AIR AND INSTANTLY LETHAL AT CONCENTRATIONS OF 0.1% AND LESS. THE POTENTIAL DEATH TOLL COULD HAVE NUMBERED IN THE TENS OF THOUSANDS.
http://www.cbc.ca/news/canada/calgary/lexin-resources-what-went-wrong-1.4038838
4. IN REVERSAL, LEXIN ADMITS TO BREAKING ENVIRONMENTAL, INDUSTRY RULES
Calgary Herald. July 10, 2017
“[LEXIN EXECUTIVE DIRECTOR} SMITH PAID THE REGULATOR A $175,000 PENALTY FOR HIS ROLE IN LEXIN’S MISDEEDS, AND ACCEPTED A LIFE-TIME BAN FROM CONTROLLING ANY COMPANY INVOLVED IN EXPLORING FOR, PRODUCING OR TRANSPORTING OIL AND GAS IN ALBERTA.”
http://calgaryherald.com/business/energy/lexin-agrees-it-breached-environmental-industry-rules
+++++++++++++++++++++++++++++++++++++++++++++++++++++++++++++++++++++++++++
Hi DAve,
One more successful prediction – this one by my friend Joe d’Aleo.
One of my friends and co-authors is Joe d’Aleo, an American Weather Forecaster who was the Founding Chief Meteorologist for the Weather Channel.
The National Weather Service (NWS) of the USA forecast a warm winter for 2014-15 and Joe told me in October 2014 that the NWS forecast was seriously incorrect, and that the next winter would be particularly cold and snowy, especially in the populous Northeast. This was the second consecutive year that the NWS has made a highly incorrect (excessively warm) Winter forecast, in Joe’s opinion – and he and his colleagues at WeatherBell have an outstanding track record of accurate forecasts.
Joe and I had been working together on a paper on Excess Winter Mortality, and I suggested to Joe that this false “warm winter” NWS forecast was dangerous, especially if the country and its people were unprepared. Joe agreed, but did not know how to tackle the problem.
I proposed an approach, and we prepared a presentation for my friend at the US Energy Information Administration (EIA). At the EIA’s request, Joe then prepared his own Winter Forecast by month and by region, and the EIA re-ran their Winter Energy Demand calculations. Using Joe’s forecast, the EIA projected 11% more total winter energy required for the entire USA than the “warm” NWS forecast had projected. That is an awful lot of energy – mostly oil, natural gas and coal.
After that brutally cold and snowy winter, a back-analysis showed that the actual winter energy used was 10% more than the projection using the NWS weather forecast, and just 1% less than that using Joe’s forecast.
I’m not sure if we saved any lives, but I still think we did a good deed.
Regards, Allan
Solar brightening and less clouds is well known.
https://journals.ametsoc.org/doi/pdf/10.1175/BAMS-D-11-00074.1
Due to clean air act.
Maybe we will talk about moon brightening, just to avoid the obvious temperature connection.
Now how about the various clean air acts in the western world in the 60s and 70s that saw us cut particulate emissions. How much warming did that cause?
And all the pollution that pours into the air from China and India? No effect? There is far more industrial activity going on in the world now than decades ago and millions more cars and trucks.
If you look at China and its increasing particulate emission it starts to really kick off about the time GW ended, 1999.
We stopped emitting so much in the west in the late 70s, and the post war cooling trend stopped.
Between these dates there was warming. I see a big correlation there.
He appears to only consider one aspect of the role of particulates in the atmosphere, namely the passage of sunlight in to the atmosphere to heat the surface. There is also the effect of direct absorption and direct heating of the atmosphere by the particles. There is the absorption of heat (long wave) radiating from the surface and that warming the atmosphere. He also ignores the importance of particulates as condensation nuclei allowing for more or less condensation and water droplet formation and resulting cloud percentage changes.
He apparently ignores the fact that different particulates create different water droplets that in turn affect different wavelengths of light. For example, decreased voclanic activity means fewer suldur particles, which produce sulphuric acid droplets that block a higher percentage of yellow sunlight.
Finally, I am unaware of any reasonably accurate measures of the total nature and volume of particulates in the atmosphere or how it varies over time. What are the variations in percentage of particle sizes over time.? Particulate size is crucial in how it affects radiation, altering whether it absorbs, reflects or scatters the light. For example, it could be that the recently claimed reduction in global wind speed reduced the number of larger particulates in the atmosphere, it could be the reduction of summer fallowing in fields across North America and adoption of Zero and Minimum till to reduce soil erosion. Without most of the facts and lack of understanding of most of the mechanisms al this is speculative hand waving by people looking at one small part of a very complex system. Much of this focus and distortion is created by the obsessive and arrogant desire to consider or blame human activities for every change measured.
Mr. Ball You will clog up all the climate model algorithms with all this info.
Tim, Can you explain for us dummies exactly why temperature increase from adding more CO2 is a logarithmic function. The IPCC doesnt believe this.
The logarithmic function issue is irrelevant. All the IPCC and therefore most of the world ‘know’ about CO2 is that if it increases temperature increases. In every record I know of, the opposite happens. To my knowledge the only place in the world where a CO2 increase causes a temperature increase is in the computer climate models.
Au contraire. The IPCC fully subscribes to the conventional definition of climate sensitivity. It is given in degrees per doubling of CO2. That, mon ami, is logarithmic.
Tim Ball: “To my knowledge the only place in the world where a CO2 increase causes a temperature increase is in the computer climate models.”
Thank you! And, since no one has been able to respond in any meaningful way to my requests to quantify how CO2 is causing any temperature increase on Mars where it makes up 95% of the atmosphere, I invite you to extend your claim and not limit it to this world.
No Problem! 🙂 CO2 is a lot denser than air. link That means it has a greater lapse rate. That, in turn, results in a greater surface temperature. I leave the math to you as an exercise.
“All the IPCC and therefore most of the world ‘know’ about CO2 is that if it increases temperature increases. In every record I know of, the opposite happens.”
Dr. Ball
It has been known since 1999 that CO2 lags by 600 years with temperature increase from Vostok ice core.
http://science.sciencemag.org/content/283/5408/1712
It does not falsify the GHE but it seems the climate is less sensitive to CO2 than claimed in models and even historically derived estimates of TCR. It’s likely the climate has strong negative feedback that man-made CO2 has barely measurable effect in the temperature records.
“if it increases temperature increases. In every record I know of, the opposite happens.
Can you show a single example Tim…or are you making it up?
Peer review, word
“my requests to quantify how CO2 is causing any temperature increase on Mars where it makes up 95% of the atmosphere, I invite you to extend your claim and not limit it to this world.”
Is CO2 increasing in Mar’s atmosphere? Why? By how much? If no increase, balance was achieved long ago so no temperature increase now. That is the meaning of ECS.
Or rather the meaning of the E in ECS.
Was climate scientist Richard Keen‘s paper relegated to a poster session at the conference rather than a podium presentation because it detracted from the CO2 warming narrative??
“Was climate scientist Richard Keen‘s paper relegated to a poster session…”
Possibly because they have heard it all before. Here he is back in 1983.
Yep, they heard it all before, 35 years ago – that 1983 paper was brilliant in it’s description of the stratosphere in 2018. Nothing the IPCC has done has panned out so well that long into the future, right Nick?
“relegated” ???
Posters are now easier to do, and much nicer than ever; say 20 or 30 years ago.
Unless one wants to be a bit rude, one has to go into a room and sit through several papers just to hear the paper you want. With a poster session you get to see the graphics without eye strain, and you can easily question the author.
Also, you get to meet and greet folks that are attracted to your interesting (pretty) graphics. They, and you can partake of drinks and munchies.
Posters sessions seem to be by self-selection on the presenter’s part.
What’s not to like?
I’ve chaired sessions so am familiar with the paper review process. A portion of the papers are selected for podium and the others are posters.
Actually, I had a choice spot at the poster session, right across from the food (which was excellent) and beer.
Last year I spoke; the year before ’twas a poster, and so on. So there’s no pattern of “relegating”.
A nice thing about posters is that they get linked to the conference proceedings and are self-explanatory, mostly, while the speakers’ posted PPT slides lack the titillating narrative.
Thanks – glad you had a good spot at the poster session – also glad your paper received wide exposure at WUWT.
How is this different from the Mauna Loa Apparent Transmission ?
?
Thank you Engineer John
Exactly what we should be looking at.
Mauna Loa is a point measurement; lunar eclipses provide a global value. The Hofmann reference on the poster compares a variety of methodologies (in situ balloon, lidar, etc.) for measuring volcanic aerosol optical depths, and the paper concludes:
“Because of its global stratospheric integrating properties, the lunar eclipse technique is perhaps the most definitive for defining the global effect of volcanic eruptions on the stratospheric aerosol.”
But surely we knew all this? Painters used to come to London in the 19th century in order to paint the famously atmospheric landscapes caused by pollution. The temperatures taken at Kew near London were often many degree lower than 20 miles away that was outside of the pollution and therefore received more sun.
This comment by Anthony was interesting;
“This is important, climatologically, because a clear stratosphere “lets the sunshine in” to warm the Earth below.”
More specifically it warms the sea. I did some experiments a few years ago, that I reported here, to test the warming effects of the sun on the sea, which involved buckets, a rowing boat and very strange looks by people on the shore.
There is little doubt that sunshine has a strong warming effect on the oceans, especially at high latitudes such as here in the UK. The cold and sunless late winter/early spring meant the sea temperature locally was only about 10degress Centigrade-50 Fahrenheit just a few weeks ago. The hot sunshine has given it a real boost over the last few weeks, although it still remains chilly. In a very warm summer it might reach 19 degree C -around 66 Fahrenheit
tonyb
Lindzen’s IR iris response hypothesis shouldn’t just be confined to the tropics.
“Strange but true: You can learn a lot about Earth’s climate by watching a lunar eclipse.” True, but not strange. As with a solar eclipse, the Earth is ideally situated for observational science. Ref. The Privileged Planet.
Data is where we lack. I list a few of the more important ones.
ocean heat content data
global cloud coverage data
global albedo data
geo magnetic field data
This makes it that much harder to get a handle on the climate.
Radical Political agenda and buckets of cash from the punters is always preferred over data. You really can’t do anything useful with data but with the former you can change the world.
Exactly. Printing an unlimited amount of dollars has changed the world. Abolish the unconstitutional Federal Reserve System.
” a handle on the climate”.
If I’m not mistaken Earth is still in an ice age. In other words TOO COLD.
If it suddenly came out of the ice age, I’d be drowned. Luckily, that won’t happen.
Drowned???? How fast are you thinking it could change because you certainly won’t live long enough for that to happen.
If half of 0.3C over 40 years was caused by the atmosphere clearing, and half of what’s left was caused by the warm cycle of the PDO/AMO.
Even if we assume that CO2 was the cause of everything there’s not enough warming to worry about.
“the cause of everything that is left …”
China and India are still producing a lot of pollution, but Earth’s skies probably are globally clearer now than for most of the 20th century.
Not too difficult to confirm. China still has serious pollution, so look at the temp trends in the polluted areas compared to nearby, upwind pristine areas.
“… increase by about 0.6 Watts per square meter,” says Keen. “That’s equivalent to a warming of 1 or 2 tenths of a degree C (0.1 C to 0.2 C).”
This would be a climate sensitivity factor of between about .17 and .34 C per W/m^2, which is well below the IPCC’s range of between 0.4C and 1.2C. How would something like this get past pal review?
If you believe the IPCC sensitivity, we should be seeing a warming of between 0.25C and .75C from the 0.6 W/m^2 of increased forcing, not just 1 or 2 tenths of a degree. Where’s the rest of this warming hiding?
“How would something like this get past pal review?”
It is a poster presentation at a conference so essentially un-reviewed. Let’s see if the author(s) can get this published anywhere.
I do not recall the atmosphere being that dirty back on 1992.
I believe the picture was taken shortly after Mt Pinatubo erupted.
I don’t remember it being colder!
In the same way you don’t notice a 0,7ºc of warming.
“In other words,” he adds, “over the past 40 years, the decrease of volcanic aerosols and the increase of greenhouse gases have contributed equally to the total warming (~0.3 C) observed in global satellite temperature records.”
So, only volcanoes and CO2 affect global temperatures? What about the gradual warming from the Little Ice Age? Increasing AMO? And so on.
How is such a miniscule AGW warming distinguished from natural variation? More magic algorithms?
The dozens of GCM that run GHG-AGW theory all predict the troposphere should warm more rapidly, especially at tropical latitudes under increasing pCO2. That is the air about 5-7 miles up should warm faster than the surface, in terms of anomaly values if GHG-AGW theory is robust.
Volcanic aerosols though, to be long lasting, have to be in the stratosphere. Aerosols (sulfates mostly) in the troposphere are washed-out within weeks to a month. Thus the long-term effect of aerosols is to warm the stratosphere slightly and cool the troposphere through their scattering short-wave sunlight back to space.
So now we have this phenomenon where the tropical hot spot in the mid-troposphere is not detected as predicted by theory. Meanwhile the surface has warmed by every dataset.
This doesn’t mean GHG-AGW theory is disproved completely, as the water vapor feed-back amplification effect most GCMs employ, which is simply hand-tuned in to provide the desired final GHG sensitivity, is likely to be negative feedback instead of a 2x positive feedback.
it just means that the bulk of surface warming isn’t due to a GHE.
This can only lead to the conclusion that the warming in the surface is due to something(s) else. Less aerosols, while having several decades of an active sun, quickly moves to the top of the list.
BTW: the only total lunar eclipse in 1992 was December 9-10, 1992. 5 months after Pinatubo popped its cork.
correction: Pinatubo’s major eruptive event was June 15, 1991. So the Dec 1992 total lunar eclipse was 17 months later.
The pollution clean-up possibility has occurred to many, but has been difficult to
substantiate with “evidence.” Emerging market economic growth–spurred by
fossil fuel use–may cool Mother Earth, infuriating the AGW Hysterics.
Everything that was once made in the West is still being made. More coal is burned now than was burned 50 years ago. And much of it without even precipitators.
Yes. Not only more, much more.
And what can the U.S. and Europe do to decrease the growth in CO2 emissions?
Exactly Dave. The West benefitted from decades of fossil fuel combustion but now the East cant. Horns meet dilemma.
We set a new record for CO2 emissions in 2017 and 1st quarter of 2018 were up 4% on 2017 … but we will always have Paris. I wonder how much pain the Europeans inflict on themselves before they work out this is going nowhere. For Germany it’s a double funny as they continue with the planned Nord Stream 2 gas pipeline to make themselves reliant on Russia.
Seems WordPress is back to sending my posts to the bit bucket instead of moderation.. SIgh.
That keeps happening to my comments, as well.
Hang in there, joel!
I had one ‘vaporize’ a week back, when I hit the ‘post comment’ button. It showed up the next day, in the proper comment queue and at the correct time when sent. ??? !!!
It is called shadow banning. Twitter does it, too. I suspect it has nothing to do with AW’s site settings. This goes on under-the-hood at WordPress IT ops. Because AW and his crew of regulars are adding 3-4 articles/day on average, delaying a comment from targeted individual by sending it to Spam bit-bucket simply buries it and severely decreases the number of people who will eventually see it, and giving less chance to further comment on it.
Twitter is notorious for this covert attack on conservatives users. They delay tweets from getting to just a few high impact followers, those with very large followers themselves for several hours. Most of the original tweeter’s followers get the tweet so it looks as if nothing is amiss. But delaying it to high impact followers greatly diminishes the likelihood it will be re-tweeted by the high impact followers, thus keeping it from trending on Twitter, where it would get even more exposure.
Shadow banning – It is how the Left operates to suppress their perceived political adversaries.
It’s not shadow-banning here. WP will put a comment in the Trash folder due to an IP Address blacklist issue…as best we can tell. The mods regularly dumpster dive to retrieve good comments. Once they’re restored, they appear in the correct location as though they weren’t originally trashed.
As for Spam (which is a separate folder), it’s sometimes a bit harder to tell. The Spam filter will catch the obvious bot posts, but sometimes a legit comment gets thrown in there as well. This requires dumpster diving too. Traffic at WUWT is decently high, so sometimes it will take a while before a mod has time to get to it.
I counsel patience… 🙂
rip
rip,
Thanks for the reply.
the problem is my IP address should not be on any blacklist. And my comment @11:25am doesn’t appear to have any words that would put in Spam.
You think the “Left” are in charge of Twitter? Careful of what you write, the sneaky buggers are probably watching your every move.
Can ice core data give information about the jolly good state of the atmosphere, esp. the amount of aerosols, be them volcanic or otherwise, back in the day? I just assume that they do, but I am not sure about. Are there results from ancient cores and are they interconnected with temperature anomalies?
Looking on a more regional level ; there are now about 150 more hours of bright sunshine
recorded each year over England UK than there were in 1970 :
https://www.metoffice.gov.uk/climate/uk/summaries/actualmonthly
That is 25 minutes per day, about an extra 10%
It seems that an extra 25 hours recorded sunshine per year might correspond to additional 1 w/m2 of radiation over the year, suggesting that England is now getting an extra 6 watts/m2 of incoming radiation hitting the ground.
The extra 6 watts/m2 is the average over 24 hours i.e over both the day and night time.
At least the benefits of clean air is still something that everyone can agree with.
Oops! This reminds me – must clean the windows.