by Roy W. Spencer, Ph. D.
The Version 6.0 global average lower tropospheric temperature (LT) anomaly for April, 2018 was +0.21 deg. C, down a little from the March value of +0.24 deg. C:

Some regional LT departures from the 30-year (1981-2010) average for the last 16 months are:
YEAR MO GLOBE NHEM. SHEM. TROPIC USA48 ARCTIC AUST
2017 01 +0.33 +0.31 +0.34 +0.10 +0.27 +0.95 +1.22
2017 02 +0.38 +0.57 +0.19 +0.08 +2.15 +1.33 +0.21
2017 03 +0.23 +0.36 +0.09 +0.06 +1.21 +1.24 +0.98
2017 04 +0.27 +0.28 +0.26 +0.21 +0.89 +0.22 +0.40
2017 05 +0.44 +0.39 +0.49 +0.41 +0.10 +0.21 +0.06
2017 06 +0.21 +0.33 +0.10 +0.39 +0.50 +0.10 +0.34
2017 07 +0.29 +0.30 +0.27 +0.51 +0.60 -0.27 +1.03
2017 08 +0.41 +0.40 +0.42 +0.46 -0.55 +0.49 +0.77
2017 09 +0.54 +0.51 +0.57 +0.54 +0.29 +1.06 +0.60
2017 10 +0.63 +0.66 +0.59 +0.47 +1.20 +0.83 +0.86
2017 11 +0.36 +0.33 +0.38 +0.26 +1.35 +0.68 -0.12
2017 12 +0.41 +0.50 +0.33 +0.26 +0.44 +1.36 +0.36
2018 01 +0.26 +0.46 +0.06 -0.12 +0.58 +1.36 +0.42
2018 02 +0.20 +0.24 +0.16 +0.03 +0.91 +1.19 +0.18
2018 03 +0.24 +0.39 +0.10 +0.06 -0.33 -0.33 +0.59
2018 04 +0.21 +0.31 +0.10 -0.13 -0.01 +1.02 +0.68
The linear temperature trend of the global average lower tropospheric temperature anomalies from January 1979 through April 2018 remains at +0.13 C/decade.
The UAH LT global anomaly image for March, 2018 should be available in the next few days here.
The new Version 6 files should also be updated in the coming days, and are located here:
Lower Troposphere: http://vortex.nsstc.uah.edu/data/msu/v6.0/tlt/uahncdc_lt_6.0.txt
Mid-Troposphere:http://vortex.nsstc.uah.edu/data/msu/v6.0/tmt/uahncdc_mt_6.0.txt
Tropopause:http://vortex.nsstc.uah.edu/data/msu/v6.0/ttp/uahncdc_tp_6.0.txt
Lower Stratosphere: http://vortex.nsstc.uah.edu/data/msu/v6.0/tls/uahncdc_ls_6.0.txt
In other news, Dr. Ryan Maue reports:
https://twitter.com/RyanMaue/status/991313430941487104
@Ryan Spear
April was abnormally cold for Europe as well.
You guys still have not got things right. It is globally cooling.
Big cold is coming for SH this winter due to various factors.
April was abnormally cold for Europe as well.
No, not at all:
http://www.leif.org/research/Temp-Europe-April-2018.png
its funny how we kept hearing stories of how cold it was in england yet on this map it was above the 30 year average?
In the UK we had 3 days where the temperature reached 28 C but the rest of the month was cold. Those 3 days were something like 21 C above the following few days. It was a freak few days caused by a southerly track of the jetstream.
@ur momisugly son of mulder …that then caused warm surface winds from around Germany to flow west through France on the 13th, 16th, 17th ending on the 18th when the surface winds shifted.
In England the (field) hockey season finished a month late, last week for us, due to the number of iced off match days. A pretty good indicator of colder than usual weather. Could also quote central heating days. Up on a typical winter
where in the uk did it actually hit 28 c outside of central london ? it certainly got nowhere near that during that period in many other places.
Bitchilly, I know but it had the effect of raising the month’s average temperature to make it seem like a warm month consider 3days x 21deg (boats rose everywhere) above the rest / 30 days = 2 deg C approx increase in average. AGW says there was only about 0.8 deg C increase sind the start of the industrial revolution. Hence a significant affect.
Adjusted map?
Bob boder May 1, 2018 at 11:32 am
It was above average. We’ve had a several above “normal” Aprils in the past 20 years so have become accustomed to them. April is not a warm month. April 2018 was a fairly cloudy month but this kept the overnight minimum temperatures elevated.
‘ First, I asked Stephen Belcher, the head of the Met Office Hadley Centre, whether the recent extended winter was related to global warming. Shaking his famous “ghost stick”, and fingering his trademark necklace of sharks’ teeth and mammoth bones, the loin-clothed Belcher blew smoke into a conch, and replied,
“Here come de heap big warmy. Bigtime warmy warmy. Is big big hot. Plenty big warm burny hot. Hot! Hot hot! But now not hot. Not hot now. De hot come go, come go. Now Is Coldy Coldy. Is ice. Hot den cold. Frreeeezy ice til hot again. Den de rain. It faaaalllll. Make pasty.” ‘
http://www.bishop-hill.net/blog/2013/6/19/here-come-de-heap-big-warmy.html
I measured the location where I live in Lincoln about one degree centigrade above the average mean temperature for April but May has started a bit below average, we did have a heat wave in April and we were below normal for the previous two months according to the Met Office.
http://en.allmetsat.com/climate/england-wales.php?code=03377
Yes, re UK April temperatures, the mean CET max for April excluding the 18th to 22nd was 11.9 degrees, 0.8 degrees below the 1981-2010 mean, but the heatwave of 18th to 22nd averaged 21.1 degrees, 8.4 degrees above the mean, so overall it was 0.7 degrees above the mean.
Weird month. Disappontingly cold, except for the short warm spell.
Rich.
It surely was cold in Europe but not colder than avarage.. thats the point.. But it will be the next 3 years.
Four months in a row, and it has not moved a bit.
I had expected a fairly large drop, but it seems things are not cooling off that fast. Having four months so tightly clustered together is fairly uncommon in the UAH data set.
People who are expecting the Big Cooling have to wait another month.
It will never take place in any one month.
Oceans,,… buffering…
All that open water in the Arctic is resulting in a lot more heat being transferred from the oceans to the atmosphere?
and space
I agree that is a natural consequence but I also suspect baloney when I look at the map of the Arctic and Antarctic temps as there are vast areas there with inadequate coverage.
I don’t think a lot of readers would know there was a huge implied SARC to your comment
Looking at four month periods for the full data set, 13 of 470 periods (2.8%) have a difference of 0.06 degrees or less between the minimum and maximum for that period, as is true for the most recent four month period. There are also 3 five month periods with a variance of 0.06 degrees or less, but none when you get to six months. This makes it seem likely that it will pick a direction soon, although it could be a gambler’s fallacy to assume that…
New methodology of data measurement? I think so
From the article: “Global temperatures for April 2018 continue above normal globally with very notable exception of North America.”
What is normal? If we drop two-tenths of a degree more, will that be normal (the zero line on the chart)?
Was that drop in temperature for April only for North America?
Some large areas across the Eurasian continent started warming early in April, and that warming increased after the second half of the month, according to my daily pics. Otherwise the SH was average looking, no noticeable above or below temps. So the Eurasian continent was the moderating influence. The oceans did cool a bit, and that likely explains the drop.
goldminor
That warming in the NE Eurasia Arctic was linked to the cold in N America.
That warming was linked to warm surface winds flowing northeast from the Caspian Sea, which then crossed to Central Eurasia, then north into the Arctic waters.
goldminor
Yes the warmth did come up from Caspian Sea thanks to the splitting and looping of the jet.
But the most interesting part was what was happening in the Arctic. Because thank’s to increased Jet stream activity within the Arctic. This large mass of warm air quickly lost its heat and by the time it had flowed around the Arctic and moved south again down across N America it was bitterly cold.
lt was this that was a key factor to the low temps in N America.
All that heat gone to space, oh the humanity.
There is no “normal” in climate or weather, this is Newspeak.
Thank you! I hate the stupid use of terms like “normal” or “anomaly,” both of which suggest there is something “abnormal” about the *weather* which is the furthest thing from the truth. Not only is there nothing “unusual” or “anomalous” or abnormal” about the weather, but warmer is BETTER, period. People should be THANKFUL if the weather is “warmer than average,” and should be HOPEFUL that it will CONTINUE TO BE SO. The alternative (cooling) will be a HELL of a lot WORSE!
Dang. The El Niño effects have dissipated.
Guess we’ll just have to laugh our way through another round of excuses for the renewed “pause”.
Yes, I come from the health statistic field, and it was beaten into me very early in my 30 year career: the proper term for “abnormal” is “statistically atypical”.
Which we know current temps are not.
Exactly.
Look at the zero line, which represents the average of all of the individual months (or so one might assume) during the years stated.
How many months fell right on that center line?
It appears to me that very few did.
Very few months were average.
Which means that average is abnormal, not normal at all.
It is ridiculous to say that something that almost never happens is normal!
The “normal” temperature is not a value to be computed to a decimal place. It should be considered a “smear” pattern — a range approximating the expected temps for a given time of year. The “normal” or “average” high around here in May is 70-85F (and the local TV weather kiddies, showing their warmist bias, go ape-shit if the forecast high is a couple of degrees above “normal.”). Claims of higher precision than are justified by the quality of the data seem to be the basis for the Climate Change™ deception.
The satellite data starts as we come out of a below “average” cold period. Smoke and mirrors
The tropics cooled, too. You can see where it went… to the north pole, and from there… to space.
Yup, all indications that things are going to cool, not warm, in the future. IOW, bad news, but not the fault of human fossil fuel emissions (but you can rest assured that whatever happens, it’ll be blamed on humanity anyway).
0.1 degree catastrophic global warming increase since … 1986-87-88.
0.1 degree catastrophic global warming increase since … 1990-91-92.
0.1 degree catastrophic global warming increase since … 2001-2007.
That would be your sensitivity of global temperature to CO2 – The rest is the usual 60 year short cycle (NO, I don’t what causes it) on top the long cycle 900-1000 year pattern we’ve seen since before the Romans.
If Earth was a patient and a doctor looked at those results he would conclude ‘within normal limits” not worry about it and move on.
Take two of these (sugar pills) and don’t call me in the morning!
All within the COLOSSAL margins of error in the “measurements” as well.
AGW Thank you very much for pointing that out!
The ocean temps are really the only thing that counts and precede land temps both up and down. The SH waters are overall warmer but going into winter. A weak El Niño is likely in the tropical Pacific later this year but the tropical Atlantic has cooled.
It’s a slow-motion dance here. My guess is we continue down a bit as the delayed effects of the La Niña are felt. After that hard to say. Of course if we get a volcano to go off all bets are off.
rbabcock
Why should ocean temps “precede land temps both up and down.”? Because of the greater thermal inertia of water, I expect water temps to lag land temps.
Clyde, rb may be referencing research by Ole Humlum, who after looking at lags in the records concluded:
“It is instructive to consider the variation of the annual change rate of atmospheric CO2 together with the annual change rates for the global air temperature and global sea surface temperature (Figure 16). All three change rates clearly vary in concert, but with sea surface temperature rates leading the global temperature rates by a few months and atmospheric CO2 rates lagging 11–12 months behind the sea surface temperature rates.”
The quote comes from GWPF 2017 State of the Climate report. The study report is The phase relation between atmospheric carbon dioxide and global temperature
https://www.researchgate.net/publication/257343053_The_phase_relation_between_atmospheric_carbon_dioxide_and_global_temperature
rb: Note that there is no real western Pacific warm pool. Warmish water (but not too warm) is getting wedged northerly and southerly and swathes of cold water from the polar regions have been angling equatorward. You are likely correct that any movement into El Nino territory will be weak. This wide mass of cool water at the equator is lingering like the El Nino did before it.
Since Climate Change means warming, have we won? ANOTHER Nobel for Trump?
Well that map also indicates below average for half of S America, most of Africa and much of Russia. And if anyone tells me the U.K. was warmer than average in April then I will send the men in white coats to go and get them.
The “anomalies” shown are relative to 1981-2010, of little use in showing recent temperature changes.
Clim: The anomalies should be measured against 60 years, not 30 years. The warming from 1981 was starting at the bottom of a 30yr long cooling period that had scientists worrying about global cooling during the 1970s. This would show that over half the warming was just warming up to what it was in the 30s and 40s. But that suits promoters of a hyper-warm climate to start the baseline series in a hole. Indeed, from 1900 to the peak in mid 1930s-1940s was much more rapid warming than from 1940 to 2000. This is what caught up to them with the Pause which was predicted by a few scientists and it isn’t played out yet. I bet they will switch over to 60yr baseline after they anguish over this battling languishing temperatures.
“And if anyone tells me the U.K. was warmer than average in April then I will send the men in white coats to go and get them.”
Can’t speak for the rest of the UK, but unless there’s a huge adjustment, CET will finish well above average. Average for 1981-2010 is 8.5C, provisional for 2018, up to 29th, 9.8C. Even if they drop a degree of the final figure it’s going to be above average. Not too surprising when you consider temperatures two weeks ago.
comparing cet to modern day mid troposphere temps is meaningless.
bitchilly,
I was assuming steve wasn’t talking about mid troposphere temperatures. But as the map in this article shows, UAH has the troposphere above the UK above average as well.
Also, a lot of the above average values came from the minimums. Maximum UK temps were 0.6°C above average, minimums 1.4°C.
Sorry, that was meant to go in my reply to London247.
Steve I totally agree with ups
Bellman if your figures are accurate why am I so ******* cold? And the soil is cold as well. Good grief even “Gardeners World” made reference to a late spring.
“Bellman if your figures are accurate why am I so ******* cold?”
It’s been an odd month, full of contrasts. It’s been cold the last few days, and the month started cold, but there was also a bit of a heat wave in the middle.
https://www.metoffice.gov.uk/news/releases/2018/april-statistics
It would be great to see this mapped onto a Peter’s Projection so one can compare areas. There’s an awful lot of tropical cooling to offset the exaggerated high latitude warmth.
UAH produces sinusoidal maps, April’s will be out soon. Here’s March’s for reference: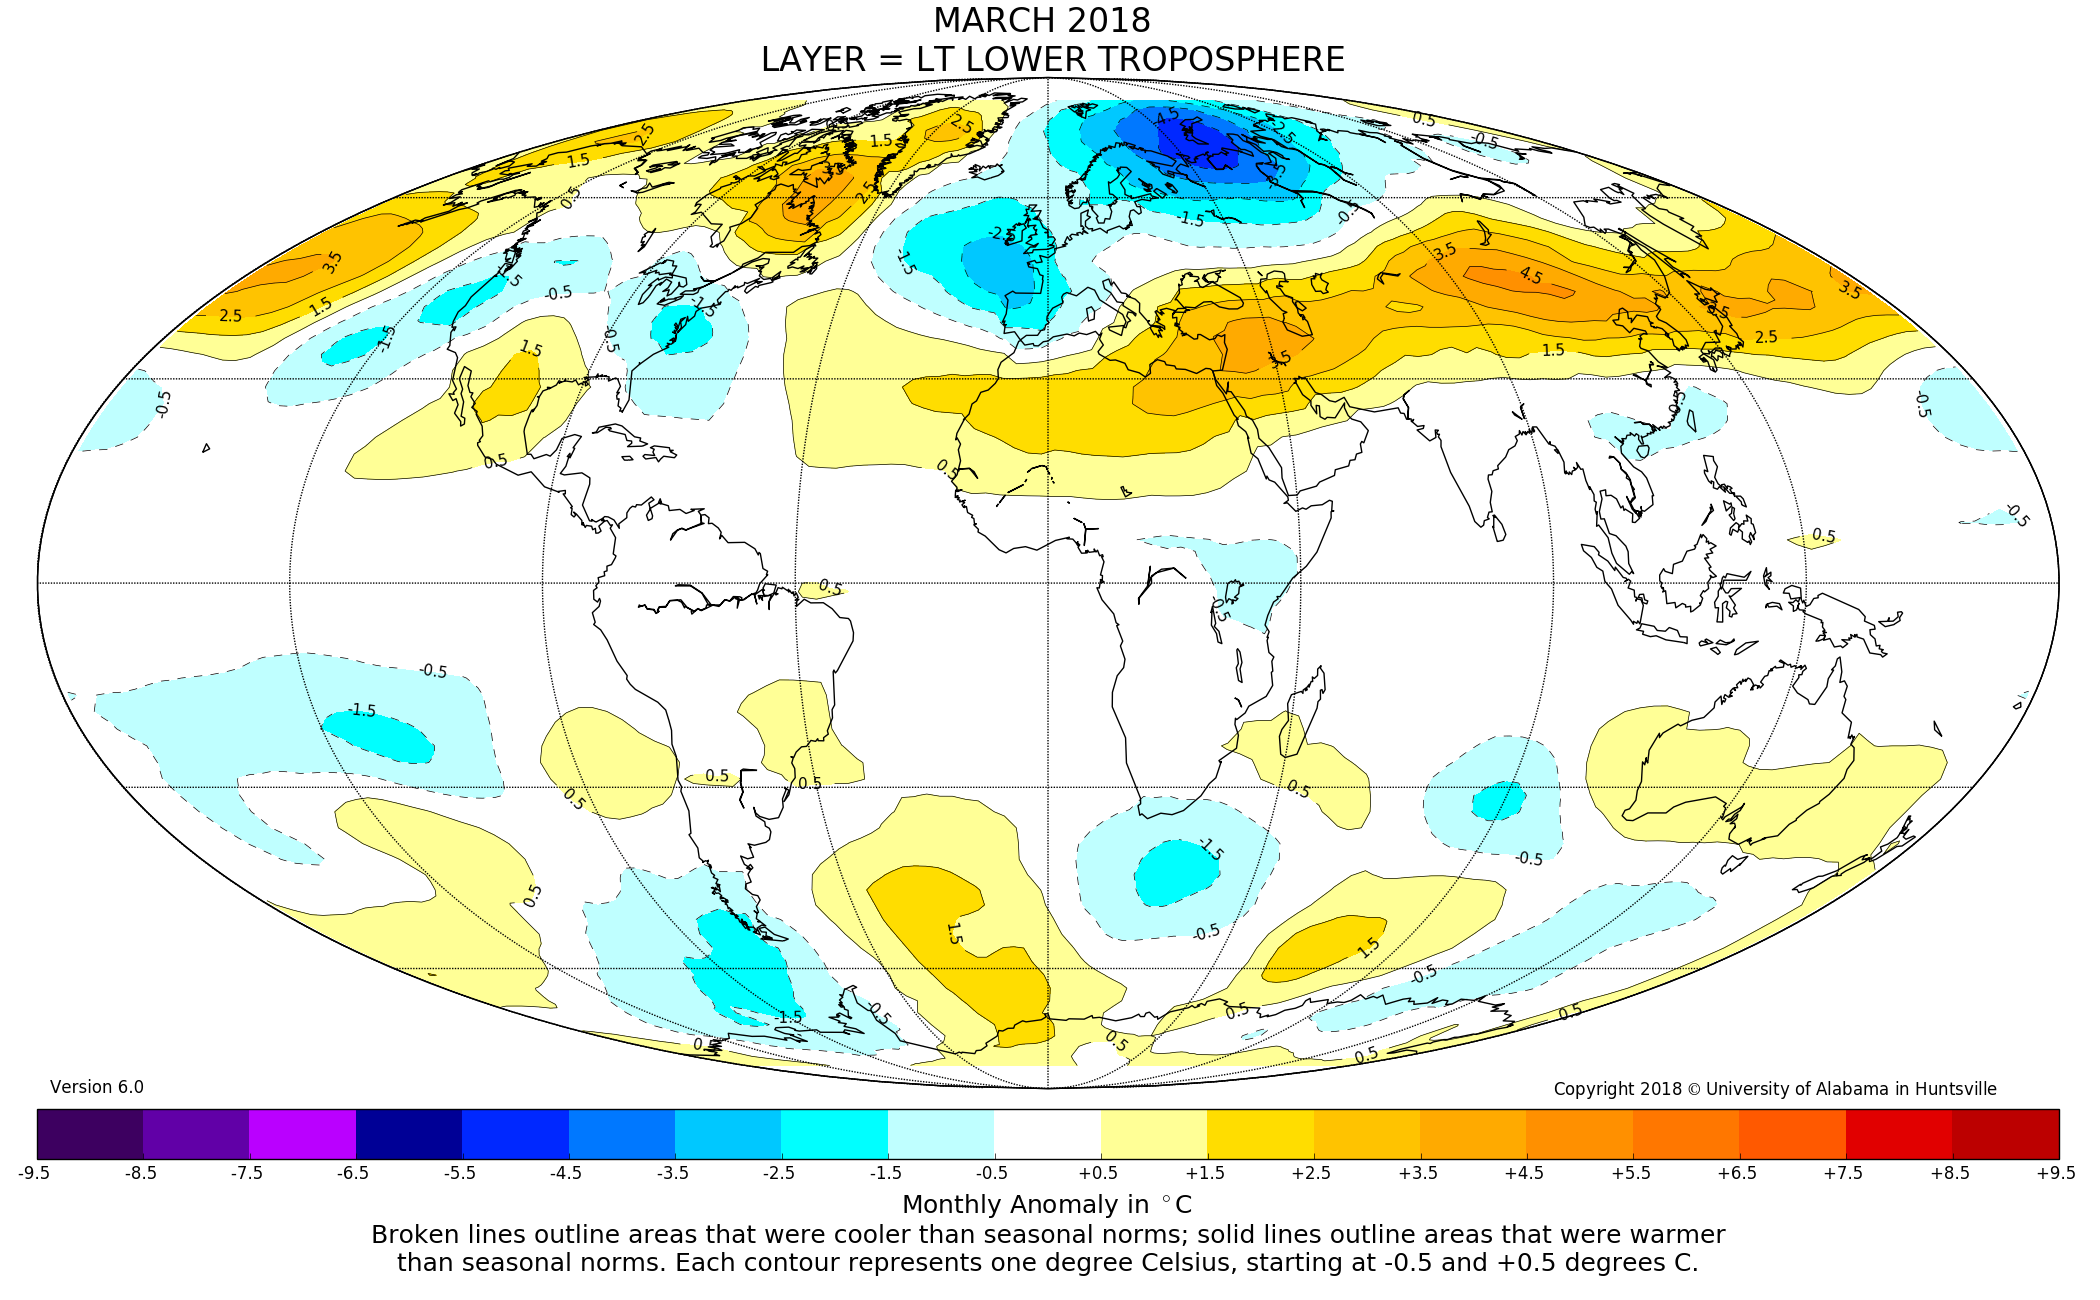
I prefer it for pole-to-pole coverage.
Oops – UAH uses Molleweide. Sinusoidal is simpler mathematically,
https://en.wikipedia.org/wiki/Mollweide_projection
https://en.wikipedia.org/wiki/Sinusoidal_projection
This might not display:
Looks like the NCEP hot spots are Arctic and Antarctic where we have limited coverage, or am I wrong?
Yes, as usual, they can “infill” with non-existent so-called “data” to guarantee the “warming trend” will continue.
Strange how the biggest positive anomalies are in the Arctic and Antarctic, where there are the fewest thermometers.
Strange how the biggest positive anomalies are in the Arctic and Antarctic, where there are the fewest thermometers.
This is a satellite measurements, thermometers are not involved.
The satellites don’t measure all the way to the poles.
Satellites measure pretty close to the poles. However, there is a ground-based thermometer at the South Pole.
This is a satellite measurements, thermometers are not involved.
No it’s not Although with every fiber of their beings, NOAA wants to obviscate Dr. Maue’s NCEP ‘s origins, they are in fact land based station data extrapolated over vast distances depending upon the whim of the less than trust worthy.
https://www.ncdc.noaa.gov/data-access/land-based-station-data
what has really caught my attention over the last couple years is how the variability has markedly decreased.
Come on Lord Monckton, bring your Pause calculation back to WUWT!
I second that. By eye the pause looks like c16 years, but Monckton does a proper calculation using the data and least-squares. Squeak up, Christoper!
No – the trend since 2002 isn’t flat. The 13 month running mean will give you a clue about that. You can just select a local max from 2002 and compare it with a local min form 2018 and claim there is a no trend. I make the trend since Jan 2002 about 0.12 deg per decade.
Are you sure? Only a long pause is interesting.
“Are you sure? Only a long pause is interesting.”
If history repeats itself, he will start when there are 7 years of rapid cooling.
Using Monckton’s definition of a pause, and assuming he would switch from RSS 4 to UAH 6, the pause is currently 3 years and 1 month old, as the trend since then is negative.
If you want longer you can go back to 1997, but then you get a trend that is +0.71°C / century.
Of course, non of this has had any appreciable effect on the underlying trend.
Quite right. And extrapolating a little further, if anomalies in UAH stay at this level until the end of the year, then the most recent mini-pause will creep over 4 years in length. The trend starting at any of the previous 428 months will remain positive.
However, lovers of Monckton’s carefully cherry-picked Long Pause are in for a disappointment, UNLESS, the anomaly drops to -0.57 next month, and stays there until December, in which case we will see him piping up. That will bring the trend since December 1997 to below zero, and he will be able to proclaim a 21-year pause.
Any bets?
Literally ALL the anomaly is in the Arctic and Antarctic. Oh there is a few warmer pockets in Australia and Europe but they are not enough to offset the extreme cold in North America.
Sooooooo, I have some questions.
1. If not for that nice warm pocket in the Beaufort Sea and the warm pockets in the Ross Sea and the Weddell Sea, what would the anomaly be for the month of April?
2. Where did that warmer (not warm, this is anomaly after all) air over the arctic and Antarctic come from? Specifically?
3. Look at all that cool anomaly in Africa and South America at the equator. Does a cool anomaly equator and a warm anomaly poles have an explanation?
I think that the warmer air around Antarctica is due to the heavy north/south surface wind mixing which has been taking place down there for some months now. The flip side to that has been cooling at mid latitudes, imo.
Hottest April record for Australia.
You believe BuMet?
When convenient.
And yet SH down -.13C. ??? And most of SH anomalies (colour maps)not showing warmth..???. Since most of SH is ocean, warmth must be confined to land. I assume these average daiky temps are simply max-min/2., so impacted by higher night temps.
So will the heavy rain winter of 2016/17 lead to a temp spike over the next 3 to 4 months due to clear sky phenomenon, or is the only reason why global temps typically spike within approximately 20 months after West Coast heavy rain winters due to the solar cycle coming off of the minimum and moving to a first peak? In this case there is no way that solar can be involved as the minimum is just getting underway, and it is now 15 months since the winter of 2016/17.
Conclusion to the above, global temps will either fall or rise from here depending on the true cause of the 20 month temp spike after the theoretical West Coast flood cycle, imo.
Looks like no warming since 1998. Massive increases for 2016 and 1998, and smaller increases in other years, but many years below the 0.2 degree positive anomaly. More and more it looks like the temperature ratchets up a bit and then is – roughly – constant for 20 years or more.
Still warm but colder then last year. Do not forget the 1981-2010 averages are high in comparison to earlier periods.
I still say by the summer of 2018 global temperatures will be at a 0 deviation from the 1981-2010 averages but to get to say some serious cooling is taken place the global temperatures at a minimum would have to fall to -.20c or more below the 1981-2010 averages.
Global overall sea surface temperatures are trending down, now slightly below +.20c deviation from averages as opposed to north of +.30c deviation from the averages this past summer.
So you are predicting an anomaly of 0.0 degrees by this summer?
A zero anomaly, bad for my garden maybe, but needed to stop this AGW scare.
But real evidence that the pause has returned will be some anomalies of -0.25 or so.
And a definitive cooling would be some anomalies of -0.5.
Any predictions for those numbers? When?
Meh, we won’t see -0.2. I’d be surprised by any negative value. A statistical analysis might reveal what is expected without an asteroid strike.
Well, I certainly expect to never again see a negative anomaly.
No matter what the weather might actually do.
Take a look at the long term trend from at least 1800. Then remember that the data is crap outside N. America, Europe and a few major centres in the Southern Hemisphere. Evaluate that gradual rise in temperature and then assume a reversion to that trend line.
Zero man made change, gradual and beneficial warming for most of the planet. Multiple shorter term natural variations within that long term trend. Nothing we can do and nothing to worry about yet.
Try to figure out what warning signs to be aware of that will precede the next glaciation and what we can do about that, because that is the very real, longer term threat. Not this piddly bit bit of beautiful warming.
Oh yeah, the Socialists, too. Worry about the Socialists because they are on then verge of taking the field with the most dangerous operating manual in history.
http://ocean.dmi.dk/arctic/meant80n.uk.php
where is that deep red arctic spot on this graph?
+1
Since your graphic starts at the 80th latitude northward, the other warm area must be between 70N and 78N above Russia between the East Siberia Sea and the Laptev Sea, in the area of the New Siberia Islands.
Probably Russian measurements from a thermometer that was moved indoors to prevent it from freezing and make it easier to read without putting on a coat and going outside (;-)
maybe the answer is here:
“Russia is the fifth-largest emitter of greenhouse gases in the world. Yet the plan it submitted under the Paris agreement to reduce its greenhouse gas emissions by 2020 is one of the weakest of any government and actually permits Russia to increase carbon pollution over time.”
from
https://insideclimatenews.org/news/06022017/russia-vladimir-putin-donald-trump-climate-change-paris-climate-agreement
Probono: Soshulists don’t mind the lies of other soshulists, but the western ones are not as good at it. There is an adoration of China by the Champagne soshulists and China is trading off on that goodwill by doing nothing, indeed they are busy building coal plants even in Africa and Russia is piping China gas. They believe we are fools.
And such is the Farce that is called the Paris Agreement
Both the anomaly graph and the anomaly map continue to bother me, especially when used in the news media and on the internet. Most people do not even understand what temperature anomalies are. For most people they only see the word “temperature.” A graph that ranges from -0.7 to +0.9 C with anomalies ranging from -0.5 to +0.88 C also accentuates any deviation from the average. How many people know what the Earth’s average temperature is? If I tell you it is getting hotter with no perspective/ no real reference you have one vision. If I tell you the average is 14 degrees C (57 F) you have a completely different view of any problem. We are not really talking about any great change in the Earth’s average temperature, especially when the extremes are from +56 degrees C to -88 degrees C. The map shows parts of the Northern Hemisphere at +5.0. If the Arctic average winter temp is -50 then -45 is still pretty dang cold and nothing much is melting. It makes a huge different in people’s perception of the problem depending on how it is presented and graphs, charts and maps are often the most potent. The Wall Street Journal put out a little book on how to read and also how to use graphs to make a point as well as how graphs are misused.
Why dont we never get the absolute temperatures and depicted at a properly scaled global map (not in K but say -20 to 45 C, 15 C being the color white), is it too difficult?
ChrisB, Apparently it is too difficult. Of course for the CAGW crowd it would never do since it would not make global warming appear to the average person as a catastrophic threat.
Other than 0C being freezing (32F) and 273K (273.15K) are the same Freezing Point of Water.
Each additional 1C or 1K are equal measures … 1K above freezing is 1C above freezing, 10K above freezing is 10C above freezing
ChrisB May 1, 2018 at 11:00 am
Why dont we never get the absolute temperatures and depicted at a properly scaled global map (not in K but say -20 to 45 C, 15 C being the color white), is it too difficult?
Apparently not too difficult:
https://earthobservatory.nasa.gov/GlobalMaps/view.php?d1=MOD11C1_M_LSTDA
“Why dont we never get the absolute temperatures and depicted at a properly scaled global map (not in K but say -20 to 45 C, 15 C being the color white), is it too difficult?”
You wouldn’t see -20 to 45 °C for UAH. These are lower troposphere temperatures. When they used to produce a daily global average in absolute, the temperatures were about -26°C. Basically, for satellite temperatures, “absolute” reflects the altitude at which they are measuring, not climate.
Here’s RSS showing absolute temperatures
http://images.remss.com/data/msu/graphics/tlt_v40/medium/global/ch_tlt_2018_03_v04_0.png
That cannot be right: I know for a fact that I evaporate every single time it gets any more that purple hot.
And I have not evaporated yet.
Menicholas,
You evaporate at 7°C?
Maybe the Quiet Sun Solar Wind isn’t sending enough carbon to the Earth. This would cause a reduction in the amount of CO2 formed in the atmosphere; thereby, causing a CO2 shortage. This would, according to CO2 theory, result in cooling.
sarc…
I’ve come to accept I’m simply too stupid to understand what an average global temperature is.
“I’ve come to accept I’m simply too average to understand how stupid an average global temperature is.”
There, fixed it for you. ;-D
Awesome!!! 10 *
Me too. I am still trying to find the average temperature for the inside of my house. Any tips on how I do that?
John: its easy. If you want a warming house, take all measurements near heating ducts. If you want a cooling house, take all measurements near cold water pipes. If you don’t get what you want simply adjust the numbers.
I guess the average is pretty high, well over 1000K integrated over the volume of the Earth.
“This is because polar air, particularly in winter, is very dry, and therefore small changes in enthalpy drive large changes in temperature.”
-Javier, below
There is your answer about the reality of an average. It works only to some extent.
The map by Dr. Maue may be accurate, but is very misleading. It’s a Mercator projection…ie the North Pole and the South Pole are spread all the way across the map. If each are pulled back into a single location depicting reality, the amount of red in the Arctic and Antarctic is much less alarming.
Murray Snyder May 1, 2018 at 9:37 am
The map by Dr. Maue may be accurate, but is very misleading. It’s a Mercator projection…ie the North Pole and the South Pole are spread all the way across the map. If each are pulled back into a single location depicting reality, the amount of red in the Arctic and Antarctic is much less alarming.
It is not a Mercator Projection, it looks more like a Patterson.
Looks to me like uniform lat/lon (but aspect ratio not 1)
Dr. Maue’s map shows a large red/brown (warm) area north of Siberia, and a large blue/green (cold) area north of Greenland, Svalbard, and western Russia. Due to the high latitude, the distance between meridians is very small, and both areas are relatively small and close to each other.
Regarding the cold snap over North America, if April showers bring May flowers, what do April snowstorms bring? Lousy crops?
I couldn’t be less alarmed regardless.
If 0.2C is all the alarmists can point to as a global warming increase on the average for a 40 year period of heavy man made CO2 production; doesnt this disprove the CAGW theory? What happens if the satellites result gets back to 0 anomoly? When will the alarmists admit we don’t have a problem?
I count around 44 ppm over the last 21 years added into the atmosphere. So agreed, where is the warming from that huge record setting increase.
They’ll claim adjustments,,,. And go back to surface records with all their adjusted and homogenized data sets with GISS in the lead,..
i thought the warming in the troposphere was supposed to be 3 fold over the surface temps ? anyone claiming to measure the earths average temp over the course of a year to 0.2c is kidding themselves on ,imo.
Statistically speaking, .2C is within the margin of error. Well within. But people are still trying to tell us that we MUST embrace CAGW.
You know, in the corporate world, an engineer would get fired for that sort of malfeasance.
Just sayin’.
FWIW, I don’t think there is a problem but your analysis is a bit screwed. The ZERO anomaly doesn’t relate to the start of the data. It is the mean temperature for the 1981-2010 period. If you look at the graph the longest period when the temperature anomaly is above ZERO as much of the time as it is below is in the mid to late 1990s, so we can say, broadly speaking, that April 2018 is about 0.2 deg C warmer than it was 20 years ago. But we still need to be careful about drawing too many conclusions from this months or previous months reading since we don’t know if this the true background temperature anomaly or if we are currently in a dip.
This would be proof positive of a malign heat “intelligence” that is finding ways to dodge the CO2 molecules in the air to get to space. The Exxon knew theory of evil corporatism and tax milking predicts this.
Most of that warmth (?) is due to the +AMO which is also why you see the warmer values in the Arctic. This effect is minimized over the summer months. It will be interesting to see if we can keep ENSO neutral conditions this summer as that should give us a truer reading.
Average temperature (wiggle, wiggle…)
Global Warming!!! (have a giggle… };>) )
Give it time. Cooling is on the way from below and above.
http://www.climate4you.com/images/NOAA%20SST-NorthAtlantic%20GlobalMonthlyTempSince1979%20With37monthRunningAverage.gif
http://www.climate4you.com/images/NOAA%20SST-SouthAtlantic%20GlobalMonthlyTempSince1979%20With37monthRunningAverage.gif
http://ocean.dmi.dk/arctic/meant80n.uk.php
http://climate4you.com/
a) Time-depth temperature diagram along 59 N, 0-800 m depth, across the North Atlantic Current.
b) Average temperature along 59 N, 30-0W, 0-800m depth, corresponding to the main part of the North Atlantic Current, using Argo-data.
Noting repeat of cool summer in 2018 from 2009 episode
While I realize local weather isn’t climate, we’ve had a long, cold winter here in the upper Midwest of the NA. Most lakes are still ice covered which means they will set all time records for latest ice out. Our fishing opener is going to a tough one. 🙂
The coldest month in to months! Must be “global cooling” caused by humans holding their breaths all at once to stop emissions. Let’s try it again- all at once now!,..