You think we had a bad winter here in the USA? Look at Japan where they have walls of snow 56 feet tall (almost the height of a 6-story building).
There’s an avalanche of tourists coming to the Tateyama to see the walls of snow.
This spectacular mountain route, reopened on Sunday after being closed for five months during the winter, expects to receive a million visitors.
The Tateyama Kurobe Alpin Route is a major tourist attraction in Japan.
These large white walls are located in Murodo, at the highest point of the route at an altitude of 2,450 meters and are known as “yuki no otani”.


It has been a rough winter full of snow all over the northern hemisphere, as this newest NOAA-20 satellite image shows:
With stunning clarity and unsurpassed detail, the newest polar orbiting satellite in the NOAA fleet, NOAA-20, took this image of the North Pole. The satellite passed over this area of the Earth at least 14 times to capture it.

The VIIRS instrument onboard the satellite created this synthesized view of Earth with the North Pole directly in the center of the image. If you look closely, you’ll see the outline of the North American continent and the Baja Peninsula on the left hand side. Scientists use the data from the VIIRS sensor to create the ‘true-color’ product you see here. Like a photograph, the satellite reads the appearance of clouds, land, vegetation and water to create these images.
This is the image we have of our planet as it would appear if we could take a single photograph of the entire Northern Hemisphere. The swath line shown on the left hand side represents the start and end of the 24-hour period taken by the satellite to create the image.
Meanwhile the amount of snow we have in the USA is puny by comparison, but still impressive by Spring standards.
A late season winter storm brought heavy snow across a large part of the region on Wednesday, April 18th with a wide swath of 6 to 12 inches. The heaviest snow fell across northeast Iowa, far southeast Minnesota, and southwest Wisconsin. Snowfall rates of 1 to 2 inches per hour resulted in slick, snow covered roads for many areas.
…Snowfall Reports (5 inches or more)…
Location Amount
…Iowa…
…Allamakee County…
1 SE Dorchester 10.0 in
Harpers Ferry 6.0 in
6 NE Postville 5.5 in
…Chickasaw County…
New Hampton 8.0 in
Nashua 5.5 in
…Clayton County…
Monona WWTP 5.1 in
…Fayette County…
Waucoma 1WNW 5.0 in
…Floyd County…
Charles City 6.6 in
Nora Springs 6.0 in
Nashua 2SW 5.8 in
…Howard County…
Lime Springs 12.5 in
1 NNW Chester 11.0 in
Riceville 11.0 in
Cresco 1NNW 9.5 in
Cresco 1NE 9.0 in
Cresco 3N 9.0 in
…Mitchell County…
Stacyville 12.8 in
Saint Ansgar 11.0 in
2 SE Mona 10.0 in
Osage 8.5 in
…Winneshiek County…
9 NE Bluffton 9.0 in
3 ESE Bluffton 8.8 in
Bluffton 8.0 in
Decorah 7ENE 8.0 in
1 NNE Calmar 6.8 in
Decorah 6.0 in
Decorah 5ESE 5.8 in
…Minnesota…
…Fillmore County…
Harmony 10.0 in
Mabel 7.8 in
Peterson 1S 7.4 in
6 WSW Harmony 6.8 in
Preston 6.5 in
Fillmore 1W 6.5 in
2 E Whalan 5.0 in
…Houston County…
3 SE Spring Grove 10.5 in
4 SE Spring Grove 10.5 in
Caledonia 8.8 in
5 SE Spring Grove 8.0 in
Spring Grove 8.0 in
Hokah 4NW 7.9 in
Mound Prairie 7.2 in
La Crescent 7.0 in
…Mower County…
Le Roy 12.0 in
Adams 10.0 in
1 SW Austin 9.3 in
Taopi 8.5 in
Austin WWTP 8.0 in
Grand Meadow 7.0 in
…Winona County…
La Crescent Dam 7 7.5 in
3 S Ridgeway 5.5 in
Saint Charles 5.5 in
…Wisconsin…
…Crawford County…
1 SSE De Soto 10.0 in
DESOTO 1SE 10.0 in
Lynxville Dam 7.0 in
Prairie Du Chien 6.5 in
…Juneau County…
Union Center 7.5 in
Mauston 1SE 5.0 in
…La Crosse County…
La Crosse 7.3 in
Barre Mills 7.0 in
3 W Saint Joseph 6.5 in
5 SSE La Crosse 6.4 in
5 NNE Stoddard 6.4 in
1 W West Salem 5.8 in
1 SW Saint Joseph 5.5 in
1 N French Island 5.5 in
2 NNW Onalaska 5.3 in
Holmen 2S 5.3 in
…Monroe County…
Cashton 7.0 in
2 NE Sparta 5.8 in
…Richland County…
5 ESE Ithaca 7.0 in
Richland Center 6.8 in
…Vernon County…
Purdy 11.5 in
La Farge 9.5 in
3 SSW Westby 9.5 in
1 NE Genoa 9.5 in
Stoddard 9.3 in
Viroqua 9.2 in
Stoddard 5NNE 9.1 in
Readstown 9.0 in
4 NNE Westby 8.3 in
Coon Valley 2W 8.0 in
3 NE Stoddard 7.8 in
Hillsboro WSW 7.5 in
1 NW Valley 7.5 in
Westby 3ENE 7.2 in
2 NW Viola 7.0 in
3 SW Hillsboro 6.5 in
https://www.google.com/amp/s/www.cbc.ca/amp/1.4628156#ampshare=http://www.cbc.ca/news/canada/newfoundland-labrador/polar-bear-population-hunt-nunatsiavut-1.4628156
What a wasted opportunity, they could have used the equipment to make the world’s biggest snowboard half-pipe.
Its still supposed to be warmer than average in the US. https://www.ncei.noaa.gov/news/national-climate-201802
Hard to believe.
I’d like to see video of them in the process of clearing that road.
See video attached to
J Mac
April 22, 2018 at 9:46 am
Has there been is a bad weather alert for NE USA for next weekend.?
As there looks like there will be a slow moving low tracking across that area between the 27th-30th. Watch out for the chance of some record breaking late season snowfall.
The numbers are in for my town (central Tohoku).. This winter we had 11.5 metres of snow. The records go back to 1959. Average winter snowfall is 9.7 metres and the maximum was 16.3 metres in 2012. That was fun (not).
These numbers are taken in the town, not up the mountain. Spring is here and the local farmers are setting up to prepare for rice propogation and planting.
Serious question here. How do they know where the road is and how do they cut the snow banks vertical?
See Mark’s comment further down. The ‘snow walls’ are produced artificially by bulldozers operating on the road every spring; they are not cut vertically and the surrounding snow is nowhere near that deep.
All that high albedo, acrross the high latitude northern summer, will add up to a great deal of global cooling. Standby for Arctic sea ice to extend this comming summer and winter.
R
Am I correct in understanding there are mainstream scientists in the US who are saying that this is exactly what the science of global warming aka climate change was predicting,namely “climate disruption”?
I have a quote to this effect from Will Steffen in Australia.
No doubt earlier WUWT posts have dealt with this.
Actually, this is exactly what we once expected–and observed–during periods of global cooling.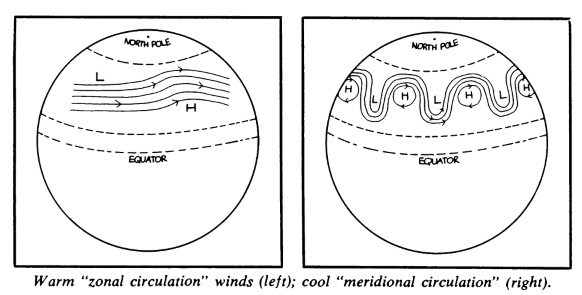

Chilling Possibilities, 1975:
” During warm periods a “zonal circulation” predominates, in which the prevailing westerly winds of the temperate zones are swept over long distances by a few powerful high and low pressure centers. The result is a more evenly distributed pattern of weather, varying relatively little from month to month or season to season. During cooler climatic periods, how- ever, the high-altitude winds are broken up into irregular cells by weaker and more plentiful pressure centers, causing formation of a “meridional circulation” pattern. These small, weak cells may stagnate over vast areas for many months, bringing unseasonably cold weather on one side and unseasonably warm weather on the other. Droughts and floods become more frequent and may alternate season to season, as they did last year in India. Thus, while the hemisphere as a whole is cooler, individual areas may alternately break temperature and precipitation records at both extremes. “
================
United Nations Fisheries and Aquaculture Org (circa 2000)
http://www.fao.org/docrep/005/y2787e/y2787e03.htm
“It was found that “zonal” epochs correspond to the periods of global warming and the meridional ones correspond to the periods of global cooling. (Lamb 1972; Lambeck 1980).”
===============
Feb 2018 – the new “Arctic amplifier” story:
“Climate change, true to the predictions of the past half century [snowfalls are a now just a thing of the past!],has led to faster warming in the Arctic than in the temperate zones. So the temperature difference between the two regions has been lessening.
Research suggests that this reduction in the temperature difference is robbing the jet stream of some of its strength, making it wobblier and contributing to more temperature extremes. ”
(insideclimatenews)
====================
Anything that happens today “was expected” –retroactively via new conjectures–by the high priests of the climate cult.
But that isn’t how a real science works, Herbert.
That is just the neatest thing! I would love to see that much snow in one place! Thanks for sharing the article.
Cool pics, thanks WUWT!
Think the title of this page should be “Thing of the past” in Japan 56 feet high!
If you are going to be intellectually honest here you should point out that the roads walls are artificial in that they are created that high using a snow plow. It is created every year. I’ve been there myself. Whether this year is a record I don’t know. You don’t seem to say. But the implication of the article is that it was unusual to have this much snow in Japan and you then linked it to record snows around the globe. This is a bit dishonest. I see you pointing out this kind of dishonesty (linking unrelated effects to push a narrative) from the other side so it is disappointing to see it here. I remember a climate change advocate using this Japan example in a slide show to show effects of extreame weather. Be honest and explain things for what they are. Not what you want them to be.
If you were going to intellectually honest you would admit that you are making stuff up. Those walls are cut by a tracked hoe using a big bucket on a long arm. The snow is then trucked out. If you look at the photos above you can clearly see the bedding structures formed as the snow accumulated at different rates. I can also see what I think is cross-bedding from drifting. These are primary depositional structures, similar to those that form on my garage roof and become readily apparent in spring.
Opposite my house is the station carpark. This is used to store snow. The ploughs come through and move the snow to the side of the road. After they have finished the blower comes through and pumps it into the carpark. When the pile gets to be about two stories high (as high as the blower can effectively pump it), the pile is dug out and trucked out. This pile looks like mulch and never has bedding structures.
I know how this is done because I have lived in northern Tohoku since 2002. In my town at 80 metres ASL we average about 9.5 metres of snow every winter and can get more than 16 metres. The western slopes of the western mountains get far more than that.
Japan gets this amount of snow from the Lake Effect, with the prevailing NW wind flowing out from the Siberian High, loading with moisture when it crosses the Sea of Japan and dumping when it meets the mountains. The difference between the NA and Japanese sytems is the fetch: across the Sea of Japan is greater than 1,000km, and the Sea never freezes.
Individual locations may have seen colder than average temperatures, but according to the UAH satellite TLT database, both the northern hemisphere and the US lower 48 states were, on average, warmer than normal during the northern hemisphere winter just past (Dec 2017 -Feb 2018): https://www.nsstc.uah.edu/data/msu/v6.0/tlt/uahncdc_lt_6.0.txt
Last winter was the 3rd warmest across the northern hemisphere according to the UAH TLT record, which starts in 1978. The only warmer NH winters since 1978 were those that occurred during the 1997/98 and 2015/16 El Nino events. The fact that this winter occurred during what NOAA has now officially classified as La Nina conditions is all the more remarkable: http://origin.cpc.ncep.noaa.gov/products/analysis_monitoring/ensostuff/ONI_v5.php
Perhaps the combination of La Nina conditions and above average winter temperatures contributed to the snowfall events referred to?
Maybe its just me, but the engineer in me says what could go wrong with cutting a big trench across the slope of a large mass of material with naturally occurring planes of weakness…….
@dean. Excellent question, The answer is yes and no. 🙂 Avalanches generally occur when loosely packed fresh snow lets go. That’s not to say that packed snow won’t collapse too.
What is certain is the snowpack has been building and compacting under its own mass since late autumn. As well as the compaction, the slidy-snowflakes have been sublimating and precipitating as interlocking cubic crystals. That ice mass has tensile strength which is why floating ice sheets remain detached to land, glaciers have snouts and the mass of ice and snow hanging off my roof is trying to crush my eaves rather than falling to the ground. I have to get under the “glacier” with a blade on a pole or get up on the roof with a shovel to cut it. Its serious work.
The definitive part to yes and no is that snow is never stable. It is always mobile: compacting, re-precipitating and flowing downslope. It flows off my garage roof with a 2 degree slope and by spring I’m hacking at the overhanging ice that formed in late December. When I first moved to Japan, I was shocked to see all the mountain road crash barriers as lengths of twisted steel attached to flattened poles. Those ARMCO type barriers are being replaced by steel cables. The cables can restrain a vehicle while allowing the ice mass to flow past. Dealing with Japan volume snow isn’t simple. I’ve put a lot of thought and effort into winter preparation, and every spring I have to make repairs and re-confugure stuff.
“56 feet” is that a typo? About 56mm of snow caused the UK to grind to a halt recently.
Look at the picture. By the way, “yuki no otani” translates as “big snow valley”.
Yeah yeah yeah, but South Australia has been warm.
“There’s an avalanche of tourists coming to the Tateyama”. It is absolutely negligent for tour companies to put that many people on a slippery hill above a city. How many injuries and deaths were there?
Meanwhile in Montana… broke our seasonal snowfall record today, and it’s still coming down hard across much of the state.
https://www.weather.gov/byz/2018SeasonalSnowfall
Why do journalist believe buildings are 10 feet per floor?
An apt. bldg., maybe, not typical high rise bldgs.