Holocene Sea Levels were 2 Meters Higher
1. Are Modern ‘Anthropogenic’ Sea Levels Rising At An Unprecedented Rate? No.
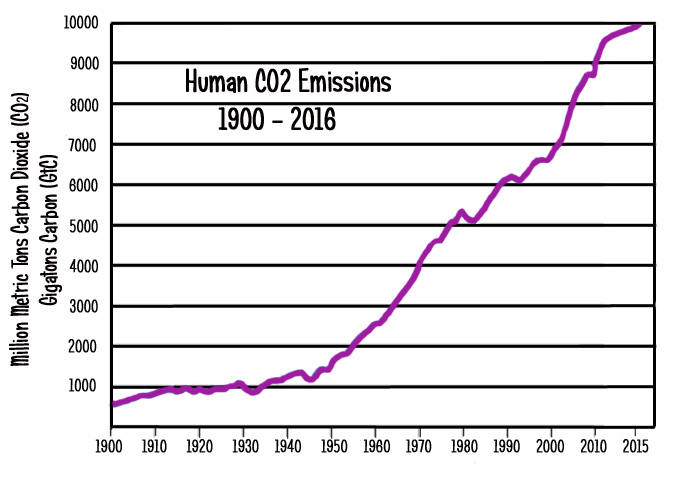
Despite the surge in CO2 concentrations since 1900, the UN’s Intergovernmental Panel on Climate Change (IPCC) has concluded that global sea levels only rose by an average of 1.7 mm/yr during the entire 1901-2010 period, which is a rate of just 0.17 of a meter per century.
During the 1958 to 2014 period, when CO2 emissions rose dramatically, a recent analysis revealed that the rate of sea level rise slowed to between 1.3 mm/yr to 1.5 mm/yr, or just 0.14 of a meter per century.
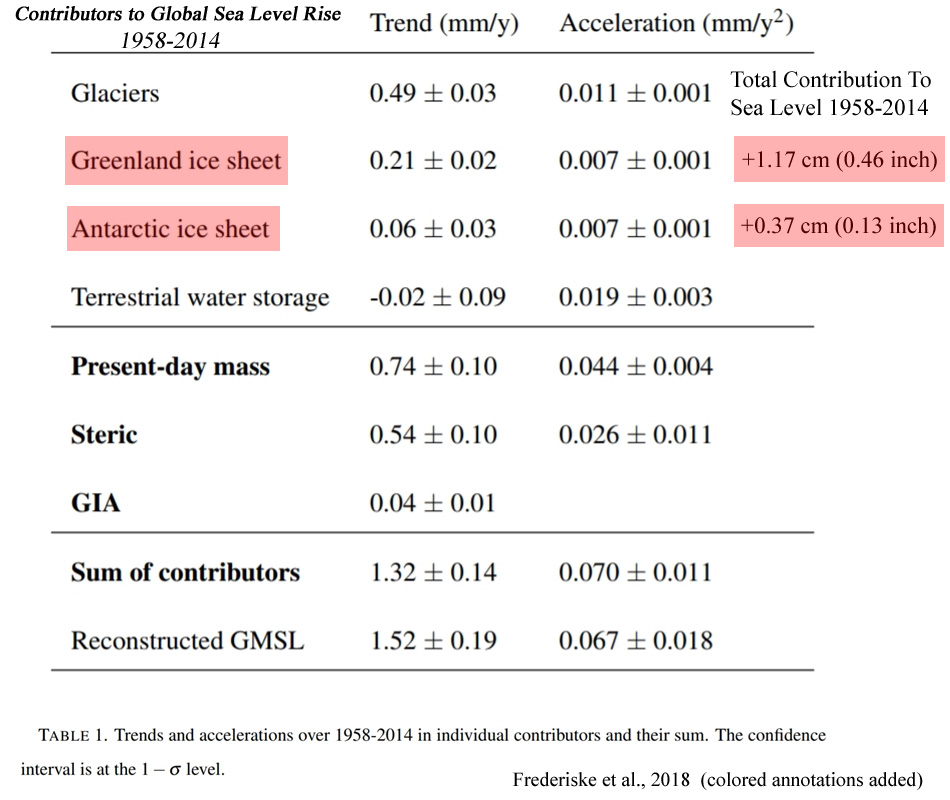
Frederiske et al.,2018 “Anthropogenic” Global Sea Level Rise Rate (1958-2014): +0.14 of a meter per century
“For the first time, it is shown that for most basins the reconstructed sea level trend and acceleration can be explained by the sum of contributors, as well as a large part of the decadal variability. The global-mean sea level reconstruction shows a trend of 1.5 ± 0.2 mm yr−1 over 1958–2014 (1σ), compared to 1.3 ± 0.1 mm yr−1 for the sum of contributors.”
2. ~15,000 – 11,000 Years Ago, Sea Levels Rose At Rates Of +4 to +6 Meters Per Century
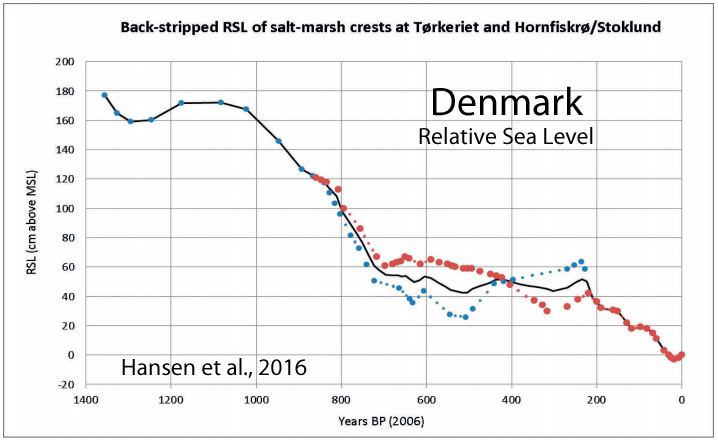
In the past few thousand years, sea levels in some regions rose and fell at rates of + or – 0.5 to 1.1 meters per century. Sea levels during the Medieval Warm Period were+170 centimeters higher than today.
Hansen et al., 2016 Denmark, +1.7 meters higher than present during the Medieval Warm Period

“Continuous record of Holocene sea-level changes … (4900 years BP to present). … The curve reveals eight centennial sea-level oscillations of 0.5-1.1 m superimposed on the general trend of the RSL [relative sea level] curve [relative sea levels ~1.7 m higher than present from 1400 to 1000 years ago].”
Cronin et al., 2017 Global Sea Level Rise Rate: +4 meters per century (14,500 to 14,000 years ago)
“Rates and patterns of global sea level rise (SLR) following the last glacial maximum (LGM) are known from radiometric ages on coral reefs from Barbados, Tahiti, New Guinea, and the Indian Ocean, as well as sediment records from the Sunda Shelf and elsewhere. … Lambeck et al. (2014) estimate mean global rates during the main deglaciation phase of 16.5 to 8.2 kiloannum (ka) [16,500 to 8,200 years ago] at 12 mm yr−1 [+1.2 meters per century] with more rapid SLR [sea level rise] rates (∼ 40 mm yr−1) [+4 meters per century] during meltwater pulse 1A ∼ 14.5–14.0 ka [14,500 to 14,000 years ago].”
Abdul et al., 2017 Global Sea Level Rise Rate: +4 meters per century(11,450 to 11,100 years ago)
“We find that sea level tracked the climate oscillations remarkably well. Sea-level rise was fast in the early Allerød (25 mm yr-1), but decreased smoothly into the Younger Dryas (7 mm yr-1) when the rate plateaued to <4 mm yr-1here termed a sea-level “slow stand”. No evidence was found indicating a jump in sea level at the beginning of the Younger Dryas as proposed by some researchers. Following the “slow-stand”, the rate of sea-level rise accelerated rapidly, producing the 14 ± 2 m sea-level jump known as MWP-1B; occurred between 11.45 and 11.1 kyr BP with peak sea-level rise reaching 40 mm yr-1 [+4 meters per century].”
Ivanovic et al., 2017 Northern Hemisphere Sea Level Rise Rate: +3.5 to +6.5 meters per century (~14,500 years ago)
“During the Last Glacial Maximum 26–19 thousand years ago (ka), a vast ice sheet stretched over North America [Clark et al., 2009]. In subsequent millennia, as the climate warmed and this ice sheet decayed, large volumes of meltwater flooded to the oceans [Tarasov and Peltier, 2006; Wickert, 2016]. This period, known as the “last deglaciation,” included episodes of abrupt climate change, such as the Bølling warming [~14.7–14.5 ka], when Northern Hemisphere temperatures increased by 4–5°C in just a few decades [Lea et al., 2003; Buizert et al., 2014], coinciding with a 12–22 m sea level rise in less than 340 years [3.5 to 6.5 meters per century] (Meltwater Pulse 1a (MWP1a)) [Deschamps et al., 2012].”
Zecchin et al., 2015 Regional Sea Level Rise Rate: +6 meters per century(14,500-11,500 years ago)
“[M]elt-water pulses have punctuated the post-glacial relative sea-level rise with rates up to 60 mm/yr. [6 meters per century] for a few centuries.”
3. Over 70 Papers Affirm Sea Levels Were 2+ Meters Higher Than Now A Few Thousand Years Ago When CO2 Levels Were ‘Safe’
70+ Papers: Sea Levels 2+ m Higher 9,000-4,000 Years Ago While CO2 Levels Were ‘Safe’ (265 ppm) More Here
Before the advent of the industrial revolution in the late 18th to early 19th centuries, carbon dioxide (CO2) concentrations hovered between 260 to 280 parts per million (ppm).

Within the last century, atmospheric CO2 concentrations have risen dramatically. Just recently they eclipsed 400 ppm.
Scientists like Dr. James Hansen have concluded that pre-industrial CO2 levels were climatically ideal. Though less optimal, atmospheric CO2 concentrations up to 350 ppm have been characterized as climatically “safe”.
However, CO2 concentrations above 350 ppm are thought to be dangerous to the Earth system. It is believed that such “high” concentrations could lead to rapid warming, glacier and ice sheet melt, and a harrowing sea level rise of 10 feet within 50 years.
To reach those catastrophic levels (10 feet within 50 years) predicted by proponents of sea level rise alarmism, the current “anthropogenic” change rate of +0.14 of a centimeter per year (since 1958) will need immediately explode into +6.1 centimeters per year.
The likelihood of this happening is remote, especially considering Greenland and Antarctica combined only contributed a grand total of 1.54 cm since 1958 (Frederiske et al., 2018).
It is becoming more and more apparent that sea levels rise and fall without any obvious connection to CO2 concentrations.
And if an anthropogenic signal cannot be conspicuously connected to sea level rise (as scientists have noted), then the greatest perceived existential threat promulgated by advocates of dangerous man-made global warming will no longer be regarded as even worth considering.
Read more at No Tricks Zone
Why don’t they all just admit that they can’t measure sea level to that degree of precision?
Exactly the same “quotient” of error for political measure. Almost like there is a ideological bias, hmmmmmm.
Said it before, will say it again. KR searches out all publidhed papers supporting his (correct, IMO) skeptical perspective, without doing any post peer review QC. This is self evident by actually going and reading some of his cited papers here. Selfevident problematic in comments is the Denmark bog SLR nonsense paper confounding GIA with SLR (true SLR must be preadjusted for vertical land motion, see guest post here “SLR, acceleration, and closure” for details.)
I gave up doing KR QC years ago. Read his stuff with interest, maybe try to cherry pick a few papers he spots to read that are surficially credible. But KR is uncritical IPCC level macrostudy tactics, with which I vigorously disagree. For explicit reasons, read several chapters of my The Arts of Truth ebook.
Ristvan, please define KR QC. Thanks.
Here is the text that I sent today to my new Department in Canada called Environment and Climate Change Canada.
“According to the Wikipedia website there are 800 billion tons of CO2 in our atmosphere with an input every year of (90 billion tons from the oceans, 9 billion tons from burning fossil fuels, 60 billion tons from microbial respiration and decomposition, and 60 billion tons from plant respiration) . The output every year is (90 billion tons from atmosphere to oceans, 120 billion tons from photosynthesis, 3 billion tons from agriculture, and 2 billion tons from mans activities that switch CO2 into the oceans. I dont know what that 2 billion tons represents exactly but since it is small I dont care. Since the total inputs is 219 and total outputs is 215 we have a net input of 4 billion tons which is what the Wikipedia site agrees with. Climate scientists say that the CO2 on average stays in the atmosphere for hundreds of years. They need that statistic to justify having a catastrophic turning point of global warming so that we wouldnt have enough time to cut back as soon as we saw the temperature accelerating. However a child in grade 6 can tell you that you cant have a 27% turnover to a reservoir per year and yet have the individual input to that reservoir remain in that reservoir for hundreds of years. At most the residence time can only be on the order of magnitude of 800 /219 = 3.65 years. Your climate arithmetic does not add up. I have uncovered 100’s of other discrepancies in your supposed climate science which I believe is a religion. “
Actually since 1750, 1.5 trillion tonnes of anthropogenic CO2 has been dumped into the atmosphere. http://cdiac.ess-dive.lbl.gov/ftp/ndp030/global.1751_2010.ems
As a non-condensing GHG, CO2 is persistent.
Using carbon isotope analysis the 40% increase in CO2 over the past 2.5 centuries can be directly attributed to the burning of fossil fuels. The current level of CO2 has not been observed for 3 million years.
OK…now throw away all the data before 1985 or so. It is useless.
And the pre-1985 data is useless because ….
More CO2 means more and healthier plant life. We need to increase our CO2 output, for the good of the planet!
At 550 ppm CO2 affects the nutritional quality of food crops.
https://www.nature.com/articles/nature13179
Higher levels of CO2 result in increased predation by pests.
https://www.ncbi.nlm.nih.gov/pubmed/18375762
Higher levels of CO2 affect human cognition.
ehp.niehs.nih.gov/15-10037
The 3 million year argument is silly. Over the past half billion years CO2 has averaged over 1000 ppm and been over 4000 ppm during an ice age.
The CO2 effect on plant growth is also well document and completely beneficial.
It is this kind of cherry picking that has proven that alarmists are not interested in science.
Our food crops evolved and were domesticated in an atmosphere that never exceeded 300 ppm CO2 for the past 800,000 years at least.
At 550 ppm CO2 affects the nutritional quality of food crops.
https://www.nature.com/articles/nature13179
Higher levels of CO2 result in increased predation by pests.
https://www.ncbi.nlm.nih.gov/pubmed/18375762
Richard M:
“The CO2 effect on plant growth is also well document and completely beneficial”
This oft-repeated idea is symptomatic of the over-confidence people have in their knowledge of a topic. The effect of increased CO2 in nature is very different from that in a greenhouse. It varies by species and environment, and can have a diverse array of effects on the environment in return, positive and negative, from nutrient cycling to regional climate. It’s impossible to know the net impact of all the effects, and it is folly to say they will be completely beneficial.
Another paper that shows that Nils-Axel Mörner has been right all along, by using observation and real data.
Here’s an interesting read I hadn’t seen before:
Technical Report NOS CO-OPS 053
SEA LEVEL VARIATIONS OF THE UNITED STATES 1854-2006
It seems to be where that NOAA statement:
comes from.
“Today’s Sea Level Change Indistinguishable From Noise”
Todays Anthropogenic Global Warming indistinguishable from noise.
All that catastrophic Caterwalling kind of noise.
The computer age and matching education system sure seems blind to the error of very precise nonsense.
Why would anyone put any stock in the musing of Kenneth Richard of NTZ?
https://tinyurl.com/ya9bgc9w
Here is the value of NTZ. It highlights papers that have come out recently. No one has time to sort out all the climate science papers that have been published, so this is one way of finding those papers.
It’s incumbent on the reader to sort out the significance of the findings. Some are of value, some are not. But it is a better source than the MSM which usually hyperventilates at the mention of AGW. Stopping at NTZ is just the first step. It leaves much more work to be done. Most warmists seem to allow themselves to be spoon fed the information that they want to believe without using any critical thinking skills they might have.
NTZ has documented reputation for misrepresenting science and and for using predatory journals. It is the last place I would look. The first place I look is the original published peer-reviewed science.
BTW – did you follow the link provided?
“Most warmists seem to allow themselves to be spoon fed the information that they want to believe without using any critical thinking skills they might have.”
The same could be said around here, could it not? How many readers do you think look at the literature?
The trouble with using a skeptic blog as a starting point is that you are still going to get a biased view of the literature. What’s more, reading the articles is not a harmless pursuit. The more you read an idea presented as fact, the more it seems to be one unless one is mindful of the alternatives. It can be little things that escape one’s vigilance, getting slowly absorbed by the mind. And prejudice is natural, it’s human. I’m prejudiced, and I’d hope knowing that it helps me be a little more understanding, but it’s not easy when comments like yours are so common. I don’t think deniers and skeptics are dumb, and there are many here who know more about climate than I. I think the political has gotten too mixed up with the science resulting in a partisan-based inability to bestow trust where trust is due or discuss the subject constructively.
Kristi Silber
Well, I’ve read some 1,200,000 replies on this web site, 800-900 “of the literature” articles, and few hundred books on various nuclear and particle physics and thermodynamic physics and related scientific and engineering topics, and now have been practicing 40 years of post-graduate “science” … How many have you read?
Why would anyone put any stock in anyone who puts a link to Sow Le Fou in his comment?
The link is to a Google search. There are plenty of other links for you to follow.
Meanwhile click on kenneth_richard in this post ( https://wattsupwiththat.com/2018/04/12/70-scientific-papers-say-todays-sea-level-change-indistinguishable-from-noise/#comment-2789410 )and see where it takes you.
How is it that marine charts, upon which peoples lives depend, show a datum correction for GPS and magnetic declination, but not for SLR?
Until marine charts show a SLR datum correction you can be 100% confident it is not significant.
The reason is simple. Water depth is everything. With a sea level rise shorter routes open up which are worth billion of dollars.
Eg. Malacca straits vs Java straits. 1500 mile savings if you are within the controlling depth. 10 meters under the keel. 1500 miles is a huge saving as it cuts 3 to 5 days off the passage.
A SLR datum correction of 1 foot would allow passage of vessels with 9.8 meters clearance. Currently they must take the more expensive route around Java.
Australia’s CSIRO agree-
“We have used a combination of historical tide-gauge data and satellite-altimeter data to estimate global averaged sea level change from 1880 to 2014. During this period, global-averaged sea level rose about 23 cm, with an average rate of rise of about 1.6 mm/yr over the 20th Century.”
But you can see that a global average like that hides some local variations like the 0.85mm average annual rise for Port Arthur in Tasmania between 1841 and 2000
http://www.cmar.csiro.au/sealevel/sl_hist_few_hundred.html
None of it seems to be murdering seaside real estate prices anywhere reasonably desirable in Australia
The 9 Metre Sea Level Scare charted. ?w=676
I think it’s interesting the way the conclusions of these 70+ papers about climate change in the Holocene are interpreted by many here. Most seem to compare the changes with what has happened so far. I, on the other hand, see this info and think, “Is this what is in store for us?” Looking at past climate oscillations, there often appears to be some “tipping point” that leads to a dramatic reversal in warming or cooling trends, leading to positive feedback mechanism(s) that results in rapid change. It seems to me likely that this has something to do with the interplay of the cryosphere with ocean mixing and currents. Because of the likelihood of a lag time between atmospheric warming and a potential tipping point such as Arctic sea ice melting enough to lead to a slowing or halt of the AMOC, it could be that we have not yet seen the full effect of current warming.
I picked up the latest issue of Scientific American in the airport yesterday, and a quick browse revealed that in the past 3 years, 12 Arctic records have been broken, such as SST and mass and extent of sea ice. It’s very hard for me to understand how skeptics can maintain that this is not significant or problematic.
“I picked up the latest issue of Scientific American in the airport yesterday, and a quick browse revealed that in the past 3 years, 12 Arctic records have been broken, such as SST and mass and extent of sea ice. It’s very hard for me to understand how skeptics can maintain that this is not significant or problematic.”
How long have we had thermometers or the satellite capability to measure these things? How does that stack up against the geological record? The answer is it’s so infinitesimal in the broad sweep of things that to think it’s important to us and what’s more that we mere mortals can change any of it is monumental hubris. I just don’t have that big an inflated opinion of myself and my capabilities and flatly refuse any such pretence. You can please yourself but I can only suggest pride cometh before the fall.
The silence on an ~16-18% expansion in forest cover over 35 yrs due to the greening of the planet is deafening. This fact is the only dramatic climate change from rising CO2 that can be unequivocally demonstrated, but it sits undisturbed as an elephant in the corner of their living rooms for good reason. Along with doubling of harvests, this enormous expansion of habitat confirms CO2 to be an overwhelming net benefit to the planet’s biosphere. Big Oil and coal, should there not be a big cheque in the mail with your names on it.
Moreover, the greening is exponential and, horrors, endothermic (cooling, its main effect coincided with the Pause contributing a little to it – a negative feedback?).
Most surprising of all, this elephant also sits in the sceptics living room! Whatever for? Take away the “cost of carbon” and this sick CO2 puppy is dead. Also SLR is even deader than it seems today. I’ve tried to analyze the greening phenomenon since it was reported in 2012 and have come up with (not updated):
1) 3 trillion trees on the planet
2) 420B new ones with half life of 15 yrs
3) Sequestered ~100Gt carbon over 35 years.
4) ‘Heat’ sequestered = that equivalent of 125% of that from burning 100Gt of anthracite.
I can’t even get sceptics to comment on the idea and we are showing that the outcome is really a “Garden of Eden Earth”. I guess I have to hope a historian will unearth the beginnings of this new dawning. Hey the mods even will likely throw this away!
CO2 is only temporarily sequestered by forests. When trees die, decompose and rot or burn they release the stored CO2. Canada’s forests are now net emitters of CO2.
http://www.nrcan.gc.ca/sites/www.nrcan.gc.ca/files/forest/sof2017/SOF2017_net_carbon_emissions_3_875px_e.jpg
See also – https://wattsupwiththat.com/2018/04/12/70-scientific-papers-say-todays-sea-level-change-indistinguishable-from-noise/#comment-2789334
New trees are largely growing around arid areas (like the Sahel inAfrica) with the lower demand for water resulting from higher CO2. Burgeoning crop harvests in North America are growing on much smaller acreage and surplus land is going to trees.
Yes forests (and add other plant growth and phytoplankton, etc.) eventually come into balance flattening the rising CO2 curve from emissions, net release looks to be well off in the future.
Historically, all but the grasslands and and deserts were forested. Europe and Noth America chopped its forests down to build ships and buildings, make potash fertilizer, and clear land for agriculture. With even lower CO2 in the atmosphere then supporting probably double what we have now, the ‘equilibrium’ is likely not for the next century or two.
Remember, climate science is highly politicized and scientists rely on dire futures to keep the grants coming. You will remember if you have been following this topic more than a decade the fuss caused by the 18yr pause in temperatures. It even caused an epidemic of depression among a number of scientists popularly known as the climate blues which was career ending for many.
Polar bears and penguins are back and as it turns out earlier low estimates of the former arose because of vigorous hunting. Temperatures forecasted in the early hype phase (I had no reason to doubt them back then) turned out to be 200% too high. We’ve passed a dozen tipping points including in 2002 UK Met office’s bemoaning that in a few years, children won’t know what snow is.
Last I heard Canada’s boreal forests are a major carbon sink. Here is a link on peat bogs/wetlands which cover huge tracts of northern Canada (I know from walking through and around countless bogs mapping geology for many years). This from a water fowl ecological site.
http://www.ehjv.ca/2017/02/17/canadas-peatlands-one-worlds-largest-carbon-sinks/
We can trade links forever and pick and choose what we want to hear. I studied paleoclimatology a long time ago before it was politicized and I try to choose literature generally acceptable to my critics and it usually isn’t gov’t sourced needless to say.
You heard wrong about Canada’s boreal forests.
“In 2015, total net emissions of carbon dioxide equivalent (CO2e) from Canada’s managed forest (see sidebar) were about 221 million tonnes (Mt).
Total net emissions are calculated by adding emissions/removals caused by human activities to emissions/removals caused by large-scale natural disturbances in Canada’s managed forest.
Human activities in Canada’s managed forest accounted for removals of about 26 Mt CO2e in 2015, while large scale natural disturbances accounted for emissions of about 247 Mt CO2e in 2015. In this way, the 247 Mt CO2e emissions minus the 26 Mt CO2e removals equals the 221 Mt CO2e net emissions.”
http://www.nrcan.gc.ca/forests/report/disturbance/16552
Peatlands are a CO2 sink and a CH4 source.
https://www.ncbi.nlm.nih.gov/pmc/articles/PMC5513236/
For someone who claims to have studied paeloclimatology, your knowledge of talking points that are dismissive of climate science is rather extensive.
Gary,
“We can trade links forever and pick and choose what we want to hear.”
Well, you can pick and choose what you want to hear, but I don’t – I try to consider all arguments that are backed up by evidence. I don’t believe many of the assertions you are wont to make – and why should I, if you pick and choose like you do? Besides, you rarely provide evidence and I know you make erroneous assumptions.
“New trees are largely growing around arid areas (like the Sahel in Africa)” This is at least partially in response to rainfall. I think you are attributing all the greening to increased CO2, when that is not a safe assumption.
“1) 3 trillion trees on the planet
2) 420B new ones with half life of 15 yrs
3) Sequestered ~100Gt carbon over 35 years.
4) ‘Heat’ sequestered = that equivalent of 125% of that from burning 100Gt of anthracite.”
I see. 3 trillion trees? How did you come up with that number? Depending on what you define as a “tree,” I bet you are off by an order of magnitude. What about the half life? You must have taken a wild guess on this one, too, but in any case it’s a meaningless number when it comes to CO2 sequestration.
What on Earth does this mean, Gary? It’s just a bunch of wild guesses!