From: DOE/LAWRENCE BERKELEY NATIONAL LABORATORY
First direct observations of methane’s increasing greenhouse effect at the Earth’s surface
Scientists have directly measured the increasing greenhouse effect of methane at the Earth’s surface for the first time. A research team from the U.S. Department of Energy’s Lawrence Berkeley National Laboratory (Berkeley Lab) tracked a rise in the warming effect of methane – one of the most important greenhouse gases for the Earth’s atmosphere – over a 10-year period at a DOE field observation site in northern Oklahoma.
These findings were published online April 2 in the journal Nature Geoscience in an article entitled “Observationally derived rise in methane surface forcing mediated by water vapour trends.” The paper indicates that the greenhouse effect from methane tracked the global pause in methane concentrations in the early 2000s and began to rise at the same time that the concentrations began to rise in 2007.
“We have long suspected from laboratory measurements, theory, and models that methane is an important greenhouse gas,” said Berkeley Lab Research Scientist Dan Feldman, the study’s lead author. “Our work directly measures how increasing concentrations of methane are leading to an increasing greenhouse effect in the Earth’s atmosphere.”
Gases that trap heat in the atmosphere are called greenhouse gases, in large part because they absorb certain wavelengths of energy emitted by the Earth. As their atmospheric concentrations change, the scientific community expects the amount of energy absorbed by these gases to change accordingly, but prior to this study, that expectation for methane had not been confirmed outside of the laboratory.
The scientists analyzed highly calibrated long-term measurements to isolate the changing greenhouse effect of methane. They did this by looking at measurements over the wavelengths at which methane is known to exert its greenhouse effect and coupled those with a suite of other atmospheric measurements to control for other confounding factors, including water vapor.


This study was enabled by the comprehensive measurements of the Earth’s atmosphere that the DOE has routinely collected for decades at its Atmospheric Radiation Measurement (ARM) facilities, and conversely, would not be possible without such detailed observations.
The DOE ARM program manages and supports three long-term atmospheric observatories – the Southern Great Plains observatory in Oklahoma, the North Slope of Alaska observatory in far-northern Alaska, and the Eastern North Atlantic observatory on the Azores Islands. The program also deploys three ARM mobile facilities and several ARM aerial facilities. Together, these assets enable scientists to perform highly-detailed, targeted investigations to advance the fundamental scientific understanding of the Earth system.
The researchers believe this type of direct field observation can provide a more accurate and complete picture of the relationship between atmospheric greenhouse gas concentrations and their warming effect on Earth’s surface.
The research was funded by the Department of Energy’s Office of Science.
###
Here is the paper, unfortunately, even though it is funded by tax dollars, it is paywalled, which I consider an abuse of the public trust.
https://www.nature.com/articles/s41561-018-0085-9
Observationally derived rise in methane surface forcing mediated by water vapour trends
Abstract
Atmospheric methane (CH4) mixing ratios exhibited a plateau between 1995 and 2006 and have subsequently been increasing. While there are a number of competing explanations for the temporal evolution of this greenhouse gas, these prominent features in the temporal trajectory of atmospheric CH4 are expected to perturb the surface energy balance through radiative forcing, largely due to the infrared radiative absorption features of CH4. However, to date this has been determined strictly through radiative transfer calculations. Here, we present a quantified observation of the time series of clear-sky radiative forcing by CH4 at the surface from 2002 to 2012 at a single site derived from spectroscopic measurements along with line-by-line calculations using ancillary data. There was no significant trend in CH4 forcing between 2002 and 2006, but since then, the trend in forcing was 0.026 ± 0.006 (99.7% CI) W m2 yr−1. The seasonal-cycle amplitude and secular trends in observed forcing are influenced by a corresponding seasonal cycle and trend in atmospheric CH4. However, we find that we must account for the overlapping absorption effects of atmospheric water vapour (H2O) and CH4 to explain the observations fully. Thus, the determination of CH4 radiative forcing requires accurate observations of both the spatiotemporal distribution of CH4 and the vertically resolved trends in H2O.
Since the paper is pay-walled, I can’t check the veracity of the claims. but just reading over the press release, and looking at the photo and graph, I can make these observations.
- It’s one point on the globe, one measurement site. All they are doing is saying “this site, using a different measurement method, matches data gathered elsewhere”. Is that significant? Probably not.
- They mention two other ARM sites, but don’t provide data for the other two. Why?
- The photo provided looks like pasture land. How do they know what they’ve measured is representative of global trend, and not a local trend due to land use change, or increase in the number of cows?
- There’s a lot of oil and gas wells in Oklahoma, and fracking has been on the rise, perhaps that accounts for some of the increase in CH4.
- They don’t mention that methane has a short residence time in the atmosphere. The atmospheric residence time of methane is approximately 8 years . They leave the reader to think is is a permanent increase.
- The forcing went down slightly from 2002 to 2007 and then rose from 2007 to 2012. Nobody seems to be able to explain why it went down from 2002 to 2007.
- The study ends in 2012 – with just 10 years of data. Why? They don’t make that clear. Did the data start going down? Did the data source disappear?
- The graph below offers a reason for the increase from 2007 to 2012. It has data to 2015, and projections beyond.

From my viewpoint, the study raises more questions than it answers. However, based on the EIA graph above, we’ll probably hear a lot of caterwauling about methane and greenhouse effects in the future.
UPDATE: Reader Lance Wallace has made the paper and the supplemental data available
Full paper here. Also the Supporting Info with data sources
https://www.dropbox.com/s/d1o8x815an3nbqt/Feldman%202018%20methane.pdf?dl=0
https://www.dropbox.com/s/res02btd1udhfv6/Feldman%202018%20methane%20SI.pdf?dl=0
Another “study by scientists” about angels, dancing, and pins. We have to put a stop to the continuing waste of money.
Correct. Just substitute imaginary devils for angels.
Interesting, but rather meaningless.
Full paper here. Also the Supporting Info with data sources
https://www.dropbox.com/s/d1o8x815an3nbqt/Feldman%202018%20methane.pdf?dl=0
https://www.dropbox.com/s/res02btd1udhfv6/Feldman%202018%20methane%20SI.pdf?dl=0
” Also the Supporting Info with data sources”
Thanks Wallace but I don’t find the alleged links to any data in the SI. What have I missed?
What happened in 2007 that would suddenly cause an upswing in the trend?
An abrupt increase in US natural gas production…
https://www.eia.gov/dnav/ng/hist/n9050us2a.htm
If about 5% of US natural gas production leaked into the atmosphere along the way from the wellhead to the consumers, it could account for the entire increase in atmospheric CH4 since 2007. I doubt that wellhead leakage exceeds 1%.
And here I thought it was from AlGores Bloviating over global warming since his first movie went into pre-production
I would have expected that improvements in Russian N.G. fields would have offset any increases from the U.S. By most accounts they were leaking a fantastic proportion of their wellhead production under the Soviet system which demanded primary production quotas while being indifferent to pipeline losses.
My brother was in Albania after the wall came down and saw wooden derricks and lakes of spilled oil. Pretty similar to Russian standards I would think. They had been told that Westerners wanted to steal their technology! Too tragic to be funny.
I don’t think the Russian oil industry has any technology or ideas worth stealing… Nothing is too tragic to be funny… LOL!
Russia has nuclear powered ice breakers which will come in handy when drilling in the Arctic.
Correct C Paul…Because of ALL THAT ICE up there
There was a joke in Soviet times. Kruschev gives a speech in which he promises an airplane will soon be available to every citizen due to increased production mandated by the party. Someone in the audience has the temerity to raise their hand and ask what good that will do for the average citizen.
Kruschev replies, “Say you here there are sausages for sale in Leningrad. You could fly there and get in line!”
Makes me think of California and windmills somehow.
If it exceeds 1%, I am filing a shareholder lawsuit.
Chairman Krudd won the election in Australia ..
could be coincidence.
The upswing in US natural gas is interesting, but could it merely be that a new fracking site was placed upwind of this site in 2007?
All of OK is upwind of this, at one time or another.
Unconventional natural gas al la hydraulic fracturing. See Chesapeake Energy..
The abstract also says that the scientists “must account for the overlapping absorption effects of atmospheric water vapour (H2O) and CH4 to explain the observations fully.” The measurement site in Oklahoma probably has a low average relative humidity, but what about coastal areas (or areas over oceans) where relative humidities are much higher, and the overlapping absorption effect of water vapor would mask, and diminish, the effect of methane?
Perhaps the site on the Azores would have better data on the net effect of IR absorption by methane in a humid environment, but why wasn’t that data presented? Possibly because averaging the Azores data with Oklahoma data would lead to a smaller average methane effect, and the authors prefer allowing the reader to extrapolate the Oklahoma data over the entire globe?
I wonder what the costs of setting up and maintaining such a site. Is it useful enough to have many of these sites? One data point is not very meaningful, but it does allow you to draw the curve anyway you’d like. 😉
Site cost is fairly minimal. Paying attention to the ridiculous conclusions that are emitted from them is Catastrophic Global Wasting!
An abrupt increase in US natural gas production…
https://www.eia.gov/dnav/ng/hist/n9050us2a.htm
If about 5% of US natural gas production leaked into the atmosphere along the way from the wellhead to the consumers, it could account for the entire increase in atmospheric CH4 since 2007.
I doubt that wellhead leakage exceeds 1% of production.
At least they’re using direct field observations rather than guesswork (a/k/a modeling assumptions) as a basis for analysis.
Concur. It’s refreshing to see measurements, not prognostications.
US natural gas production began to increase after 2005, atmospheric methane began to rise in 2007…
However, prior to 2007, there was no correlation between US natural gas production and atmospheric CH4. No doubt, some academic and/or government pinhead will try to blame the post-2007 rise in CH4 on frac’ing.
The “tipping point” is the acute need for something else to hang non-existent warming on.
The methane data show the same trend changes, including the growth re-initiation in 2007, at all latitudes despite there being a significant difference in absolute values:
http://i63.tinypic.com/1tmnuu.jpg
BRW=Barrow, Alaska; MLO=Mauna Loa; SPO=South Pole
The trend “break point” is very clear on this NOAA plot (seasonal cycle removed and on common baseline):
http://i66.tinypic.com/2wgf1n6.jpg
I recommend printing this plot off and drawing a vertical line at 2007. What does it mean? No idea, other than the change occurred virtually simultaneously and therefore must surely be something that is globally-driven rather than local. Also, the 13C data indicates the additional CH4 has a δ13C that is lower than current atmospheric levels, so around -55 or -60 per mil, more in the range of biogenic sources than thermogenic (oil and gas). Having said that, I have not found anything else (other than US gas production) that appears to correlate with the change.
Interesting
Please be aware that AGW based climate “science” has no need or interest in actual facts or reality based science. This type of fact-centred information is blatantly denialist and will not be tolerated in the New Science Paradigm! /sarc
δ13C depletion… The metric that can mean anything.
δ13C depletion … the metric that is NOT declining at “precisely the rate we would expect if this additional CO2 in the atmosphere was appearing there because of combustion [of fossil fuels]”.
I am involved with a longer term research project to measure and calculate methane emissions from manure holding lagoons on dairy farms. It is interesting to note, from the article, that the background methane concentrations here in Canada are very similar to those in the study at slightly over 1.9 ppm. We are obviously out on pasture land as well.
One of those confounding factors of water vapor is that it will reduce it’s GHG effect by a nearly identical amount as they measured from methane, as the temp increase postpones the release of latent heat that is responsible for it to stop cooling in the middle of a clear calm night.
To give an idea of the magnitude of the that confounding factor, here’s it’s a negative 35W/m^2 feedback.
It would actually reduce it because the transition would just delay it until after the extra .6W/m^2 increase was lost to space.
Interesting stuff Mike.
Thanks Greg.
This paper explains the problem
https://www.researchgate.net/publication/253127549_What_determines_the_nocturnal_cooling_timescale_at_2_m
And Dr Gray identifies the same mechanism (I hope this link works)
https://t.co/BtRk2qv4o4 (pdf)
Is that a cow pasture adjacent to the observation station?
No! It’s a pile of pseudo-scientific horse-s#!t in a pasture.
Wasn’t 2007 the year that Mr. Obama announced his candidacy for president? Didn’t his campaign produce an unusual amount of . . . ? If he could make SLR cease, surely he could make CH4 rise . . . sarc, I think. (You asked for something to explain the change in 2007; FWIW, I offer this.)(Of course, I could be wrong.)
Any conclusion where the uncertainty is twice the estimate is automatically suspect.
Rud, and to chart it, as in fig.3, with the lines extending off the edge, is just unprofessional.
Yup. Good point
This ‘scary’ junk result ‘0.003 plus minus 0.006’ (!!!) should NEVER have gotten through peer review irrespective of Willis’ further legit autocorrelation critique, which means a Bonferoni correcytion would say they got nutin.
The only other climate paper this stats bad on its face that I can recall was Dessler 2010b, which purported to use the clear sky/all sky Ceres difference to prove a positive cloud feedback. Except his data plot was a classic no correlation shotgun, and his reported statistical r^2 was 0.02! Savaged it in the climate chapter of The Arts of Truth.
On a quick read I find the following:
• No acknowledgment of autocorrelation or of its effect on the statistical calculations. This is a huge problem. These folks desperately need to put a statistician on the team.
• No link to data.
• The link to “Methods” is broken. They say:
However, that just gives an error message.
Not impressive …
Some research finds the data here.
w.
The link to the methods section is only broken if you use the illegal pdf on dropbox. Looking at the
actual website the methods section is there in full and the links contained within are valid and show where
the data is located. Nor is it clear why they would need to consider an autocorrelation in their analysis.
Which particular bit of the analysis do you think is suspect as a result?
I can’t believe there is any justifiable reason whatsoever for *any* work using public resources to be paywalled or hidden for any reason. Number one, publicly paid data, especially raw, should be public. Number two, *any* work done on it using public money…grants, salaries, etc should likewise be completely transparent and public. Public money, public product. *PERIOD*.
Why isn’t this the default position?
One theory is that by charging for it, the cost to the taxpayer is less…
HUH? It’s the journal publisher which is cashing in , not the research group or their academy, so NO it does not make it cheaper for the tax payer.
Methane, being highly reactive, is likley not well mixed in reality.
Deep oceans and deserts, except around seeps, will mot produce much.
I wonder how close the measurement sites are to gas production, feed lots, or swamps?
Termites, if I recall correctly, still introduce more methane into the atmosphere than humans.
“Likely not well mixed in reality”. Really? How many termite mounds are there in Antarctica?
Sorry if my response was a bit blunt, but look at the plots I showed above – the methane levels are inreasing everywhere at the same rate and we do not have a clue why. And no, I do not think local emissions have anything to do with it.
Overheard at the local branch of Activists’R Us:
Right – we have a new gas to worry about! Ideas, anybody?
What human activity can we blame for it? There must be something out there we haven’t protested yet…
Methane… Hmm.. isn’t that the gas in aerosols?
Let’s have a look… Butane… well, that sure sounds like Methane – so yes, let’s get them banned…
Looking at the data, most methane seems to be natural. it comes from swamps…
We can’t do anything about that. We want to bring wetlands back. Isn’t there any time humans create methane?
Well, we do fart…
Great! Let’s start a Twitterstorm about that!
…particularly after a vegetarian meal….
Oh! Damn!
OMG! It’s the Vegans that are causing Climate Change!
How many times does it have to be said? – you cannot trap heat! Heat is a transient phenomenon.
…Bet you can tax it…
How many times does it have to be said? – you cannot trap heat! Heat is a transient phenomenon.
How many times does that meme need to be debunked? A pullover traps heat.
If you wish to be exact about the discontinuity in methane you need to use a different method (cusums)
Thanks for the data link, Willis.
I have identified the first major discontinuity in methane values occurring at December 2006. Thereafter it oscillates on an annual basis, at concentrations averaging somewhat above the (steady) value before 2006, with a further sustained but oscillating higher concentration starting in late 2012
Honestly, methane for global warmers is a bit like smoking tobacco. They just can’t give it up, yet they know it doesn’t really do much. But when there are other things wrong with their world, they keep returning to it for comfort. As an ex-smoker I’m not moralizing, but they do seem to want to blame it for other things that are wrong in their world when there is no simple blame to be apportioned elsewhere.
Human methane emissions dindu nuffing, and never will. And if someone, somehow, showed it to be nearly as bad as they wish, then human emissions could in fact be easily scaled back by the use of nuclear power etc as anthropogenic methane in the atmosphere returned to baseline in a few decades or less. For people proclaiming the end of the world, there is nothing worse than a problem that could be quickly fixed if it really did turn out to be a problem.
It is simply impossbile to detect the warming impacts of methane, because it can be done even for carbon dioxide. In figure below is a graphical presentation of the contributions of GH gases. The absorption peak of methane is totally covered by water as it does so in great deal also for CO2. Therefore, in the present atmosphere, the relative strenghts of GH gases in comparison to CO2 are: H20=11.8, CO2 =1, O3=0.78, N2O=0.14 and CH4=0.109. It means that water is 108 times more powerful GH gas than CH4.

What could explain the the positive trend (if any) in the temperature? In a figure belowe is the trend of Total Precipitable Water (TPW) in the atmosphere and the UAH temperature trend. There is a positive trend in TPW since 2005. We do not know the reason, because the UAH temperature had no positive trend. During the temperature increase period from 1979 to 2000, the TPW trend was slighly downwards against the positive water feedback theory of AGW and IPCC.
Internal variability, the ocean cycles, same reason El Nino years are warmer than others years just by moving warm water from one place to another.
If land distribution was equal, there’s be less of it, but there’d still likely be some.
Water vapor levels change very dramatically from place to place.
Some places (the tropics) have an over abundance. Some places (deserts, the poles) have almost none.
So they have detected that CH4 is an LWIR absorber when it is actually in the atmosphere. But it i still speculation that an increase in trace gases that have LWIR absorption bands in the Earth’s atmosphere have any effect on climate. After all good absorbers are also good radiators and in the torposphere in terms of heat transfer, conduction and convection prevail over LWIR absorption band radiation It is the non-greenhouse gas molecules that trap heat more than the so called greenhouse gas molecules because the non-greenhouse gas molecules are such poor radiators to space.
CO2 captures energy, then transfers it to the other molecules in the atmosphere.
At the top of the atmosphere, at the ERL, the energy is then radiated to space. The only way the earth loses energy is by radiating to space, by radiative transfer. The RATE of the transfer is a function of Height of the ERL. By adding GHGs to the atmosphere we raise the ERL. Radiation from a higher height ( because we have a negative lapse rate) means the radiating will happen from a cooler location and will therefore happen less rapidily. GHGs govern the rate at which radiation is lost to space. The earth cools less rapidly, ie
is WARMER than it would be WITHOUT the GHGs
Except when it comes from the surface Stevo.
And the ohter molecules transfer heat energy to CO2 which radiates some of it to space. It is the non-greenhouse gases that are more likely to retain more heat energy because they do not have LWIR radiation bands. Remember a good absorber is also a good radiator so the so called greenhouse gases are better LWIR radiators to space than the non-greenhouse gases. Heat energy transport in the troposphere is dominated by conduction and convection and not LWIR absorption band radiation.
A real greenhouse does not stay warm because of a radiant greenhouse effect caused by trace gases with LWIR absorption bands. A real greenhouse stays warm because the glass limits cooling by convection. It is a convective greenhouse effect that keeps a real greenhouse warm. So to on Earth. Gravity and the heat capacity of the atmosphere combine to limit convective cooling of the Earth’s surface. As derived from first principals, the Earth’s convective greenhouse effect keeps the Earth’s surface on average 33 degrees C warmer than it would otherwise be. 33 degrees C is what has been derived from first principals and 33 degrees C is what has been observed. Additional warming from a radiative greenhouse effect has not been observed on Earth or anywhere else in the solar system for that matter. The radiative greenhouse effect is science fictiion so hence the AGW conjecture is science fictiion as well.
The height of the ERL is a function of the mass of the atmosphere and gravity. The only way to increase the height of the ERL is to increase the mass of the atmosphere and it does not matter whether the added gas has LWIR absorption bands or not. If CO2 had any effect on climate them the increase in CO2 over the past 30 years should have caused at least a measureable increase in the dry lapse rate in the troposphere but that has not happened.
ERL “effective radiation level” . Whenever I see words like “effective” I know someone doing handwaving science or cooking the data.
What Mosh just posted is circular logic. ERL is *by definition* the theoretical equivalent where the radiation temp matches the outgoing radiation. So saying this level being raised is the cause of the warming does not inform anything. There is a change in outgoing radiation THEREFORE the calculated ERL is changed.
The temperature lapse rate allows the conversion of radiation observations to a theoretical ERL which is a derived value not an observation.
The action of transferring energy from a CO2 molecule to other molecules and back again takes time.
The longer this energy stays thermalized in the atmosphere, the warmer the atmosphere is.
The hiatus lives! And triumphs over all! Since there is no warming, it is established that neither CO2 ( which is increasing), nor methane ( which is also increasing), nor any other gas ( including water vapour), which may be increasing-causes Global Warming,aka Climate Change.
All that is left is for the Socialists to shut up.
Once again, corrupt researchers play with words while disguising their actions:
If these were pure observations, the word derived would not be necessary. Derivation appears to be a substitution for contrived.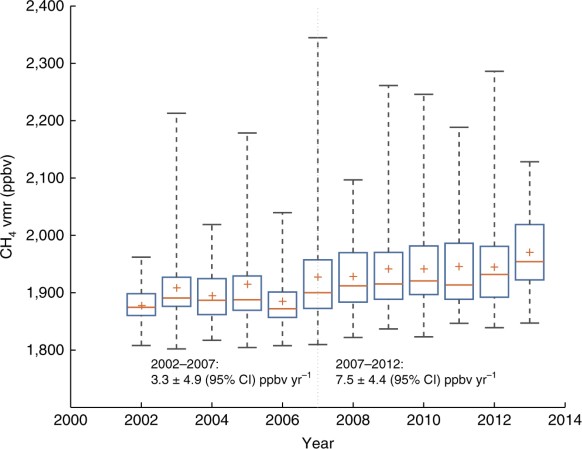
The graphs above show an allegedly alarming rise over a short period. Only, those charts cover an extremely short period of time, truncating rather abruptly around 2013-2014.
Then there is the puzzling approach that splits a short record, 2002-2013 into two trend lines; i.e. 2002-2007 & 2007-2013.
Meanwhile, elsewhere in the CAGW world, alleged researchers refuse to consider a change in trends where Arctic sea ice bottomed around 2007. Instead they demonstrate obstinate unwillingness to identify trend changes over a shorter time-frame.
When one considers supporting observations:
That supposedly alarming trend looks to be interpretation of observed ranges and variability into an alleged trend. Where “parts per billion volume, (ppbv)” and “confidence levels (CL)” drive a contrived derived trend.
It is curious why an alleged DOE study took a number of years for analysis and release; ended observations in 2013. Why isn’t this data current?
Then analyzing and deriving the data for five years until a preferred result is derived…