Guest Post by Willis Eschenbach
One of the enduring questions in climate involves what is usually called “cloud feedback”. When the earth warms up a bit, the clouds change in response. The question is the direction of that response. Does the change in clouds amplify a warming, or does it reduce a warming? Here’s Dr. Roy Spencer on the subject:
The total amount of CO2 humans have added to the atmosphere in the last 100 years has upset the radiative energy budget of the Earth by only 1%. How the climate system responds to that small “poke” is very uncertain.
The IPCC says there will be strong warming, with cloud changes making the warming worse. I claim there will be weak warming, with cloud changes acting to reduce the influence of that 1% change.
The difference between these two outcomes is whether cloud feedbacks are positive (the IPCC view), or negative (the view I and a minority of others have).
So far, neither side has been able to prove their case. That uncertainty even exists on this core issue is not appreciated by many scientists!
After some shenanigans, I’ve beaten my computer back into shape, and I’ve found the time to download the latest version of the CERES satellite radiation datasets. This version is called “Edition 4”. “CERES” is an acronym for Clouds and the Earth’s Radiant Energy System. The CERES project is collecting radiation data from three different satellites. The CERES project is online here.
There are two groups of CERES files—the top-of-atmosphere (TOA) datasets and the derived surface datasets. See the “DATA” note at the end of the post for information on where to get the two datasets.
The CERES TOA datasets are the actual measurements of the upwelling and downwelling shortwave (solar) radiation and longwave (thermal infrared) radiation.
The surface datasets, on the other hand, are derived from the TOA datasets along with a variety of other both satellite and surface data.
In previous Editions of the CERES data there have been TOA datasets for what is called the “cloud radiative effect”, or “CRE”. Figure 1, for example, shows the net effect of clouds on TOA radiation. This is at the inherent resolution of the CERES data, which is given on a one-degree latitude by one-degree longitude basis.

Figure 1. TOA net cloud radiative effect. Negative values show net cloud cooling; positive values show net cloud warming.
Note that overall, the effect of the clouds is to cool the system by about -18 W/m2 (negative values show cooling).
Now, clouds have two opposing effects on the radiation in the Earth’s climate system. The first of these effects is that clouds cool the surface by reflecting sunlight back into space. We experience this cooling effect when a cloud covers the sun on a hot afternoon.
The second effect is more subtle. Clouds increase the thermal radiation coming down from above us. We can experience this as well, but usually only on clear winter nights. On those nights, when a low-lying cloud comes over, it instantly replaces our view of outer space with a relatively warm cloud.
Warm relative to what, you might ask? Relative to the infinite heat sink of outer space. From outer space, we get on the order of 3 W/m2 of what is called “cosmic background radiation”. From a low-lying cloud, on the other hand, which is at say a temperature of about freezing, we get on the order of three hundred W/m2 of thermal radiation … and as a result, when clouds come over on a clear winter night you can feel the temperature difference. On such nights, you can feel how the advent of the clouds leaves the surface warmer than it was without the clouds.
So clouds have two opposite effects—less sunshine due to cloud reflections cools the surface, but more downwelling thermal radiation warms the surface. These opposing cloud radiative effects are referred to as the “shortwave” (solar) CRE and the “longwave” (thermal infrared) CRE. The difference between radiation gains and losses is referred to as the “net” CRE.
And the question, as Dr. Roy pointed out above, is this: what happens to the net CRE when the surface warms?
I bring all of this up because there are some new datasets in CERES Edition 4. In the CERES TOA group, there are now measurements of cloud area, cloud pressure, cloud temperature, and cloud optical depth. These are quite interesting in themselves, but that’s another story for another day.
More to the current point, in the derived CERES Surface datasets, there are now datasets for surface cloud radiative effect. In past CERES Editions, there have been TOA cloud radiative effect datasets (shortwave, longwave, and net). But this is the first Edition with surface cloud radiative effect datasets. Here’s the net effect of clouds at the surface.

Figure 2. Surface net cloud radiative effect. Negative values show net cloud cooling, positive values show net cloud warming.
The difference between looking at the net CRE from the top (Fig. 1) and from the bottom (Fig. 2) of the atmosphere is instructive. From the surface, the changes due to the clouds along the intertropical conversion zone (ITCZ, blue line above the Equator) are much larger than from the top of the atmosphere.
And to return to the main question, I thought I’d look at the changes in surface CRE with respect to changes in surface temperature. To do that, on a 1° latitude x 1° longitude gridcell basis I first removed the month-by-month seasonal variations in both the local cloud radiative effect and the local temperatures. Then, again on a 1°x1° gridcell basis, I calculated the trend of the local net CRE with respect to the local changes in temperature. Figure 3 shows that result:

Figure 3. Change in surface net cloud radiative effect for a 1°C increase in surface temperatures. Negative values show increased cooling in response to surface warming.
Now, this is a most fascinating result for a variety of reasons. First, note that the global average change of CRE with temperature is 0.0 W/m2 per degree C. This might explain why there is so much debate even as to the sign of the change in cloud radiative effect with increasing temperature.
Next, I have argued for a long time that the effect of clouds and thunderstorms in the tropics is to regulate the temperature. I have provided a variety of evidence showing that on a daily basis, when the tropical ocean is cool, clouds form later in the day and in fewer numbers. This allows the sun in to heat up the ocean. On the other hand, when the tropical ocean is warm, clouds and thunderstorms form earlier in the day and in greater numbers. This both cuts down on incoming sunshine and cools the surface directly in a variety of ways. See “Air Conditioning Nairobi, Refrigerating The Planet” for a discussion of surface cooling.
Figure 3 clearly shows that my hypothesis is correct. In the tropics, as the surface warms, the clouds act to increase their cooling effect. Not only that but in some areas, the effect is very strong. Over the “Pacific Warm Pool”, the warmest part of the world’s oceans shown in blue in Figure 3, there is a very strong cap on further warming. For each degree of warming, the clouds cool the surface by up to -20 W/m2.
Next, Figure 3 shows the problem with global averages. As a global average, the change in the surface net CRE per degree of surface warming is zero … but in the all-important tropics, the change in the CRE is strongly cooling.
Next, Figure 3 shows an additional reason why it has been hard to determine even the sign of the change in the CRE with changes in temperature—it’s negative over the ocean and positive over the land.
In assessing all of this, note that these month-long averages obscure what is actually happening on the ground. The temperature regulation actually occurs on a minute-by-minute basis, and only where and when the surface temperature exceeds or drops below a critical local temperature threshold. So when the cumulus cloud formation temperature is exceeded at say eleven AM in the tropics, the emerging clouds immediately reflect hundreds of watts per square metre of solar energy back to space. The cooling and warming occur as needed, when needed, where needed in order to maintain the temperature within a narrow range. The figures above show the month-long averages of these very precise, threshold-based, and discrete interventions in the evolution of the temperatures.
Anyhow, I think that’s all the scientific fun I’m allowed to have in a twenty-four-hour period … here, it’s been raining off and on all week. I’ve been marveling at the plants growing up between the bricks on the patio.

The surprising part about those plants is that after the rain, they’ve captured an amazing amount of water on their leaves.

Here’s a closeup:

Almost every leaf has managed to intercept and hold some water. I rate that as an amazing trick, a solar collector that doubles as a water catcher … note how the leaves are arranged so that the upper surfaces are flat and level, which keeps the drops from rolling off.
One last fun fact to make it all even stranger. The flat and level arrangement of the leaves shown above is not permanent, far from it. At night, this same plant folds its leaves up. The three two-lobed leaves of each head fold inwards, and the lobes fold back outwards so that what is the upper surface in the picture above becomes the inner surface. This cuts the surface exposed to the outer air in half, thus conserving both heat and internal water throughout the night.
Then the three-leaved head folds over so that the leaves hang down vertically. This reduces the profile of the plant and buries the heads down among the lower stems and foliage, which cuts down on wind-chill and thus also reduces overnight heat loss.
Astounding.
My best to you all on this amazing planet, where even the commonplace is extraordinary,
w.
My Usual Request: When you comment, please quote the exact words you are discussing. I can and am happy to defend my own words. I cannot defend you attacking something you think I said.
DATA: The CERES TOA dataset is available here and the surface dataset is available here I simply downloaded everything, which is about three-quarters of a gigabyte for the TOA dataset and about 0.9 gigabytes for the surface dataset. However, each individual dataset is only about 50 Mbytes, and you can download just what you wish.
DATA INFO: The CERES TOA datasets are as follows:
toa_sw_all
toa_lw_all
toa_net_all
toa_sw_clr
toa_lw_clr
toa_net_clr
toa_cre_sw
toa_cre_lw
toa_cre_net
solar
cldarea_total_daynight
cldpress_total_daynight
cldtemp_total_daynight
cldtau_total_day
The CERES surface datasets are as follows
srf_sw_down_all
srf_sw_down_clr
srf_sw_up_all
srf_sw_up_clr
srf_lw_down_all
srf_lw_down_clr
srf_lw_up_all
srf_lw_up_clr
srf_net_sw_all
srf_net_sw_clr
srf_net_lw_all
srf_net_lw_clr
srf_net_tot_all
srf_net_tot_clr
srf_cre_net_sw
srf_cre_net_lw
srf_cre_net_tot
There is no CERES surface temperature dataset. In lieu of that, I use a direct conversion of the CERES surface longwave upwelling all-sky radiation dataset to temperature by means of the Stefan-Boltzmann equation. I have checked this converted temperature dataset against various other temperature datasets (HadCRUT, Reynolds SST, UAH MSU, TAO buoys) and found it to be in very good agreement.
Abbreviations: sw – shortwave; lw – longwave; clr – clear sky conditions; all – all sky conditions; cldarea – cloud area; cldpress – cloud pressure; cldtemp – cloud temperature; cldtau – cloud optical depth; cre – cloud radiative effect; up – upwelling; down – downwelling; tot – total lw + sw
Discover more from Watts Up With That?
Subscribe to get the latest posts sent to your email.
This is what I was taught in school in the 1970s. It is not new. When explaining the temperature profile of the tropical day, ‘your’ hypothesis (including thunderstorms) was detailed as the workings of the tropical day.
The only difference is that back in the 1970s, we were being told about global cooling, and the teacher never suggested that cloud feedback acted as a control to stop global warming. Just merely how the tropical day unfolds, and why the tropics have the sort of climatic characteristics they have.
I just this hour flew into Bangkok from the south at high noon. I had an excellent window seat, and we were flying at 35,000 ft over about 2/3 cloud cover most of the 2 hour flight. One thing that was very obvious was that not only was the top of cloud cover not uniform, but it ranged in color from bright white to a darker grey. I can only imangine that this has some net difference in overall Albedo, the brighter white clouds reflecting more of the sunlight and the darker grey clouds absorbing more solar insolation? Does that heat water vapor in the cloud if it is much darker?
And the top of the cloud deck is not a table top. It is jagged up and down cloud and with billowing thunderheads rising above the Deck. Maybe I am picking nits with this, but it would appear to me that it is a little more complex than just a matter of square miles of cloud cover reflecting the Sun 🌞 light, and or assuming that that all clouds reflect the exact same amount of insolaton. And at different latitudes, it would be a different angle of incidence.
So am I on to something here or was it all really just optical illusions from my perspective? If it is relative, how in the world could you even begin to rationalize the data, let alone collect it in a meaningful way that would add more precision to the equation?
My gut instinct tells me it is just simple common sense what you hypothesis is correct for day to day weather as previously described that is always in the process of establishing climate. The big driver in overall long term climate has to be solar insolation in where Earth is in relation to solar forcing. I. E. Milankovitch Cycle, is what drives climate on millennial time scales. But in the shortest cycle, that changes yearly with retrograde Precession, forever shifting solar insolation as to the mechanics of that process. Per example, in a human lifetime that slips retro one full degree in about 72 years. So solar insolation in 1650 at the peak of the LIA is not in the exact same location today as it was then.
A Precessional Winter is only about 5000 years long, and when combined with the other longer term cycles of obliquity and eccentricity wherein if conditions are ripe and there are sufficient ‘hammers’ to cause significant temporary cooling, then I believe the Northern Hemisphere can slip into an ice age in one single season. The snow over Canada and norther Europe just doesn’t melt one year, and Albedo takes over and presto, welcome to the beginning of an ice age as 3 feet of snow pack turns to slush and re-freezes to ice and just keeps building year after year before flowing a bit further south. Maybe many false starts, but sooner or later it sticks, and for about 100,000 years of varying intensity. I dread the day that winter comes.
Willis , this shows that there is no negative or positive feedback on average from clouds as CRE is 0 on global average.
Then I think we can suggest that water vapor increase caused by temperature increase, is offset by albedo. This is primarily because the water vapor is clouds. Do you agree ?
[Isn’t this Slayer stuff? . . . mod]
The dreaded ‘Back Radiation’
In the recent article Friday unfunny: How one obnoxious fool caused Dr. Roy Spencer to throw in the towel on his blog I was intrigued about the banning of Doug J. Cotton. So I took it upon myself to read the claims by Cotton. I came across this posting on Tallblokes blog . I have to agree with his emphasis on the second law of thermodynamics.
The point relates particularly to back radiation. I have been stumped frequently by claims that it’s not as cold under a cloudy night sky than a cloudless night sky. Roy Spencer claims here the proof of this back radiation is demonstrated by using a hand held infra red thermometer pointed skyward at clouded and clear skies.
There is a mechanism in the (infra red) transmission which may have been overlooked. When I drive my car at night, on an unlit road, the road ahead is illuminated by my own headlights. Everything I see is as a result of the light reflected from the objects illuminated. The spectrum of returned light has the same spectral components as the transmitted light.
I turn now to fog detectors. Fog detectors consist of a coded light source (infra red) transmitting into the air and a sensor looking for reflected (infra red) light. The amount of reflected light is an indication the amount of fog. The light is reflected off the water droplets (and dust and stuff) in the air. The reflected light has the same spectrum as the transmitted light.
Further : Rainfall radars. Here we have transmitters working in the radio frequency range emitting pulses and awaiting their reflection from water droplets.
So over the entire spectrum from radio to optical frequencies water droplets reflect the incident radiation
We are so accustomed to the behaviour of reflected heat rays that we use it in cooking foil and emergency foil blankets.
Can it be that the ‘back radiation’ we all experience on cloudy nights is simply the surface radiation emitted skyward being reflected back to the surface. Its infra red temperature would indicate it is at a higher temperature than the cloud temperature. Mirrors do not heat up during reflection of incident rays. Clouds don’t either. Clouds do not absorb and reradiate reflected energy, if they did the temperature of the cloud could be measured by an infrared thermometer. Cloud reflection is also seen while flying during day time with the tops being white, the colour of the incident radiation the sun. Our eyes are visible ray sensors our skin is an infra red sensor.
With this explanation I can hold on to the Second law of Thermodynamics and accept that ‘back radiation’ (reflection) does occur from cold clouds.
PS Mr Cotton does have a particular style of blog contribution. I have the highest regard for Dr Roy Spencer.
“Can it be that the ‘back radiation’ we all experience on cloudy nights is simply the surface radiation emitted skyward being reflected back to the surface. Its infra red temperature would indicate it is at a higher temperature than the cloud temperature”
Excellent point.
The surface temperature is always warmer than the cloud temperature due the cloud’s higher position along the declining lapse rate slope unless there is an inversion layer present in which case a cloud layer will stop further radiative cooling but will not warm the surface any further. That is why fog created by radiative cooling beneath clouds that move in subsequently can remain in situ indefinitely until horizontal advection introduces air with different characteristics.
I have previously mentioned that the reason why infra red sensors show a rise in temperature when a cloud moves in is because the sensor then focuses on the cloud temperature at the cloud’s lower warmer height along the lapse rate slope rather than at a higher colder location along the lapse rate slope when the cloud is absent.
Sadly, I have also been banned from Roy’s site for pointing up a flaw in his meteorology knowledge although I respect him as regards other matters.
aidclear January 19, 2018 at 2:34 am
I’m sorry, aidclear, but you’ve taken a step too far. On the basis that SOME frequencies are easily reflected, you’ve concluded that ALL frequencies are easily reflected.
No, I’m sorry, but it can’t be reflection. The reason is that low-level clouds are essentially a black-body for radiation at the frequencies of longwave infrared radiation. Yes, light reflects well. And shortwave infrared reflects passably.
But longwave infrared requires a special surface to be reflected. You can do it, for example, with highly polished aluminum. But it’s hard-most surfaces absorb almost all of the incident IR. Even bright white new snow, which reflects most of the incident sunlight, absorbs 99% of incident longwave IR. 99%! Only one percent is reflected.
My bible for many things climatish, including the emissivity (which is equal to the absorptivity at any given frequency) of common substances, is Geiger’s The Climate Near The Ground, first published sometime around the fifties when people still measured things instead of modeling them. He gives the following figures for IR emissivity (absorptivity) at 9 to 12 microns:
Water, 0.96
Fresh snow, 0.99
Dry sand, 0.95
Wet sand, 0.96
Forest, deciduous, 0.95
Forest, conifer, 0.97
Leaves Corn, Beans, 0.94
and so on down the line to things like:
Mouse fur, 0.94
Glass, 0.94
You can see why the reflection isn’t happening … the IR is getting absorbed, not reflected.
I must admit, though, that I do greatly enjoy the idea of some boffin at midnight in his laboratory measuring the emissivity of common substances when he hears the snap of the mousetrap he set earlier, and he thinks, hmmm …
But clouds? Clouds don’t reflect more than a trace of thermal infrared. Clouds are the “roach hotel” for IR photons … they can check in, but they can’t check out. Even the small amount that is reflected is almost all reflected at another cloud water droplet. There, another 95%+ of the small amount is absorbed, and the now really tiny amount reflected is almost all reflected at another … well, you get the idea.
My best wishes to you,
w.
makes me wonder: how is the cloud cover affecting the arctic? especially how winter and summer is behaving…
this incomplete crude NOAA graph is -to me- already telling a big story:
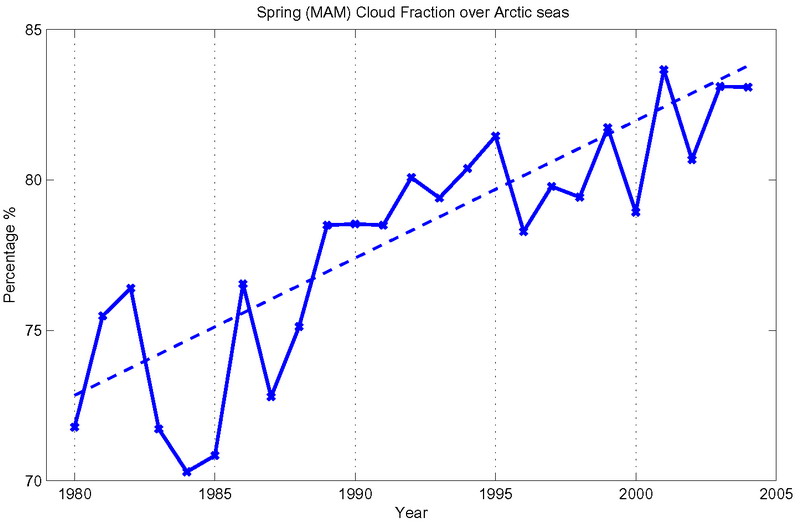
this may explain the warmer temperatures there as the big cooling is more shielded and the increase matches nicely with the global arctic ice decrease…
to add: i know it’s only spring, i know it’s incomplete, i know it’s very crude and no methods are explained on the site (only explenation: https://www.pmel.noaa.gov/arctic-zone/detect/climate-clouds.shtml )
however the rise does correlate exactly with the drop in sea ice.
futhermore where CO2 “should cause the melt, clouds can’t do it and the other way around (greenhouse theory one greenhouse agent would make the other agent inert if they share the same IR bands which clouds and CO2 do)
that might be a serious invetigation….
“This cuts the surface exposed to the outer air in half, thus conserving both heat and internal water throughout the night.”
true of water, but wrong about heat. Plants generally HATE heat, even though they like the sun. Heat is bad for most of their process (notable exception: the drying of their seeds), and good for the process of their enemies (mold, insects and other animals etc.)
The folding/unfolding of leaves is water controlled: the size of some cells depends on their water contain, while the size of other close cells is keep constant. This cause a bending in a side or the other.
The striking thing is, the yellow patches (+12 W/m²) for “TOA net Cloud Radiative Effect” are deserts: Sahara, middle east and Iran, Australia, Namibia, Antarctica coast.
Why would clouds net increase TOA radiation in these places? Makes no sense, to me. Rather, it looks like this is not an effect of clouds, but an effect of the conditions that also make clouds appear.
That is a very good question.
Willis: In your article there’s a missing “https:” in front of “wattsupwiththat.com/2013/03/11/air-conditioning-nairobi-refrigerating-the-planet/”, making it non-clickable.
Thanks, fixed.
w.
Mr Eschenbach, you kow how I love to be pedantic, so can you check this statement for me please.
You said “Warm relative to what, you might ask? Relative to “. From outer space, we get on the order of 3 W/m2 of what is called “cosmic background radiation”.
Surely as you have so often said in the past, apart from a very small window to “the infinite heat sink of outer space”, shouldn’t clear sky be looking at all the CO2 in the Atmosphere instead?
Only when there is no CO2 can we get a direct view of outer space at 3K.
Let’s try that again.
Mr Eschenbach, you know how I love to be pedantic, so can you check this statement for me please.
You said “Warm relative to what, you might ask? Relative to the infinite heat sink of outer space. From outer space, we get on the order of 3 W/m2 of what is called “cosmic background radiation”.
Surely as you have so often said in the past, apart from a very small window to “the infinite heat sink of outer space”, shouldn’t clear sky be looking at all the CO2 in the Atmosphere instead?
Only when there is no CO2 can we get a direct view of outer space at 3K.
A C, you are correct. The view to outer space is not unimpeded, there is still CO2 to consider. However, CO2 is far from being the dominant GHG, that would be water. And on a cold winter night, humidity is usually very low.
Still, I could have been clearer.
w.
Mr Eschenbach, I couldn’t even get a couple of lines correct first time, so a minor error like that in your extensive report is chicken feed.
But it does mean that the loss of Energy in a clear sky (Desert) shows the effectiveness of H2O in comparison to CO2.
Willis:
A minor, perhaps pedantic, correction on this issue. It doesn’t negate your overall point at all.
To quote your exact words, as requested:
The cosmic background radiation is exactly equivalent (to within our measurement capabilities) of a blackbody at 2.725 +/- 0.001K. This gives us a radiative power flux density of:
Q = 5.67×10^-8 * (2.725^4) = 0.000003 W/m2
So it is 3 microwatts per square meter, not 3 watts. But what’s a factor of a million between friends?
(By the way, we know about this radiation from a ~3K source because it was absorbed by objects at ~300K. How is that possible?…)
Interestingly, the power flux density we get from starlight is about the same 3 uW/m2 as the background radiation. Also insignificant to the earth’s energy balance.
As I said, it is not important to your main point here, but I thought I should point it out in the interests of accuracy.
Willis — I don’t disagree at all with your ideas about tropical cumulus. Have you ever tried to expand your thesis to address the quasi-permanent cloudbank off the West Coast of the US and similar temperate coastal areas? Your Figure 3 suggests that it’s affect is neutral or perhaps very slightly warming. Of course, the nature of the “marine layer” and the ocean under it is vastly different than the tropics. Still it seems it ought to fit into the same general framework in some fashion.
Hi Willis and thank you for all your very good work in your recent posts on the impact of clouds.
In a (sort of) related post excerpted below, I and others have “bounded” Transient Climate Sensitivity in the range (approx.) +/- 1C/(2xCO2). The MINUS 1C is for the Global Cooling period from ~1940 to ~1977 and the PLUS 1C is for the Global Warming/Pause/El Nino era of satellite measurements from ~1979 to ~2017.5. My calculation of -1C is approximate, whereas the calculation of Christy and McNider (2017) of +1.1C is more precise.
If I read your post correctly, you conclude that on a full-Earth scale basis, “the global average change of CRE with temperature is 0.0 W/m2 per degree C for the period Mar2000 to Feb2017. This time corresponds to the Pause period and then the recent strong El Nino warming, which was at its peak circa Jan2016. Earth is still cooling from that El Nino peak, and I expect will cool considerably more over the next ~~6 months or so, based on the ~4-month lead of Nino34 temperatures vs UAHLT temperatures.
I wonder if the lingering warming of the 2016 El Nino is affecting your calculations. For example, would the “average change of CRE with temperature of 0.0 W/m2 per degree C” be significantly different if you calculated from Mar2000 to Jan2012, when UAH LT for both times was ~0.0C?
Best, Allan
https://wattsupwiththat.com/2018/01/17/proof-that-the-recent-slowdown-is-statistically-significant-correcting-for-autocorrelation/comment-page-1/#comment-2720277
[excerpted]
I recently ran a rough analysis of the Transient Climate Sensitivity (TCS) for the period 1940 to 1977. As you may recall, this was a period of (natural) global cooling, even as atmospheric CO2 strongly increased, according to the IPCC.
I chose this time period because 1940 is the time when fossil fuel consumption strongly accelerated, and 1977 is the time of the Great Pacific Climate Shift, when the PDO changed from cooling to warming (on average).
I used HadCrut3 Surface Temperatures (ST’s), although HadCrut4 would give similar results.
I made the same basic assumption to Christy and McNider (C&M2017) – similar to that of the IPCC, that essentially ALL the global average temperature change was caused by increasing atmospheric CO2. C&M2017 concluded that for the climate satellite era (1979 to mid-2017) the Transient Climate Sensitivity for the Lower Troposphere (LT TCS) is PLUS 1.1C/(2xCO2).
I calculated that the Transient Climate Sensitivity for the Surface Temperatures (ST TCS) for 1940-1977 is about MINUS 1C/(2xCO2) [cited herein as AMM2018].
Repeating, both C&M2017 and AMM2018 use the IPCC assumption (which is HIGHLY questionable, to be very polite) that atmospheric CO2 is the primary driver of global climate, and calculate a Transient Climate Sensitivity of +/- 1C/(2xCO2). This is a VERY LOW TCS, whether positive or negative, such that there is NO real global warming (or cooling) crisis caused by increasing atmospheric CO2.
CONCLUSION
The IPCC’s global warming scare is caused by a greatly exaggerated, false assumption of the magnitude of TCS/ECS, an assumption that is unsupported by the evidence.
Furthermore, a rational person must reject as false the IPCC’s basic assumption that alleged runaway global warming is driven by increasing atmospheric CO2, unless one is also prepared to conclude that the same increasing atmospheric CO2 ALSO causes global cooling.
Interesting, on the previous thread on Dr Gray’s work DWR54 quoted BEST Global Land only RAW Data as showing 1.3C increasing trend from 1946 to 2017.
So I downloaded the data and the Trend for your period of 1940-1977 is -0.1C.
So Best’s Raw data does not even match the Final Hadcrut data, let alone the raw Hadcrut data.
I don’t know how BEST get their Raw data and calculations from but they are wierd to say the least
I agree that Cooling from 1940 TO 1977 is about -0.1C
http://woodfortrees.org/plot/hadcrut3vgl/from:1940/to:1977/trend/plot/hadcrut3gl/from:1940 to:1977
But why do you compare this period to 1946 to 2017?
AC I wrote:
“I agree that Cooling from 1940 TO 1977 is about -0.1C.”
Correction:
If one goes far enough back in the datasets, the cooling from ~1940 to ~1977 could equal about 0.2C, rather than 0.1C.
Depends on how many “adjustments” you want to accept in your data. 🙂
Regards, Allan
“I chose this time period because 1940 is the time when fossil fuel consumption strongly accelerated, and 1977 is the time of the Great Pacific Climate Shift, when the PDO changed from cooling to warming (on average).”
 ?zoom=2
It didn’t “strongly accelerate” from 1940.
 ?zoom=2
The world was in the middle WW2 for one.
It was the years following it and really ~1960 for CO2 acceleration. However (see below), that is only half the story as -ve forcings need to be considered as well.
As such I have pointed out that there was a lot of atmospheric aerosol in the years up to around the 1970 as industrial activity accelerated after the war. That you do not accept observational evidence of that is not (of course) scientifically valid.
The period also covers the change from the +ve PDO/AMO combination into the -ve PDO phase. Which as we can see below gave a sig NV cooling which the weak (at that time) Anthro GHG forcing could not counter.
Look at the forcings, In 1940 there was ~ 0.6 W/m2 of +ve forcing. When aerosols thinned by ~ 1970 we see total anthro forcing really take off, such that today we have around 2 W/m2 of radiative forcing. Around 3x more.

In short, you chose exactly the most inapt period to calculate your TCS.
ToneB:
Here is the evidence that Fossil Fuel Consumption strongly accelerated starting about 1940, as I stated.
https://www.facebook.com/photo.php?fbid=1557530314324525&set=a.1012901982120697.1073741826.100002027142240&type=3&theater
Your nonsense about Aerosols was previously refuted as cited below, in my conversations with Dr. Douglas Hoyt – you ignored that.
Anthony has asked me to discontinue my conversation with you. Let’s do that – you are a chronic bullsh!tter and I am tired of your falsehoods.
****************************************************
https://wattsupwiththat.com/2018/01/17/proof-that-the-recent-slowdown-is-statistically-significant-correcting-for-autocorrelation/comment-page-1/#comment-2720683
Toneb: I cannot be bothered with you – you keep changing your story, there are huge gaps in your illogic, etc.
You are not addressing my points, you are merely writing false propaganda for the imbeciles who might believe you.
RE your BS about Aerosols: Read these conversations between me and Dr. Douglas Hoyt.
“Almost every leaf has managed to intercept and hold some water. I rate that as an amazing trick, a solar collector that doubles as a water catcher … note how the leaves are arranged so that the upper surfaces are flat and level, which keeps the drops from rolling off.”
“The surprising part about those plants is that after the rain, they’ve captured an amazing amount of water on their leaves.”
Does the fury solar collector (cat) also catch an amazing amount of water in its fur?
“Note that overall, the effect of the clouds is to cool the system by about -18 W/m2” – I do not think so!
I analyzed the records of 462 stations in the US reporting both cloud condition and temperature over the years 2015 & 2016. These are over 10 mio records. Adjusted for location, season and daytime the result looks like this:
CLR 13.24
FEW 13.89
SCT 13.74
BKN 13.73
OVC 12.97
(sky condition and temperature in Celsius)
http://i736.photobucket.com/albums/xx10/Oliver25/rangliste%206.png
The data hereto are far from perfect, the cloud condition would only be reported to an altitude of 12.000ft (it’s about air traffic). So there are two major factors for which I could not adjust the result.
1. These indications only cover low clouds. Low clouds are meant to have a low GHE and a much more negative CRE.
2. Rain. Rain has a chilling effect and is strongly associated with clouds. Strong cloudiness will on average show lower temperatures because of rain.
http://i736.photobucket.com/albums/xx10/Oliver25/rangliste%20prec.png
Even if we give that rain-chill just a minimal weighting, we end up with the indication that radiative forcing of clouds must be positive. Something like this maybe..
http://i736.photobucket.com/albums/xx10/Oliver25/rangliste%207.png
Anyhow, clouds do not cool the planet, but rather have a neutral, or more likely, net heating effect. This fact makes the GHE-theory obsolete.
[Please confirm the five abbreviations above are Clear (skies), Few (clouds), Scattered (clouds), Broken (clouds) and Overcast. And then what each number represents, and how it was derived. .mod]
The graphs are no longer available as the site has not been administered for a long time.
But I suggest you have a good read at this site.
http://gustofhotair.blogspot.co.uk/
Thanks! Too bad the graphs are gone, which makes it very to “read”. I have taken the data from the ncdc which provides all the records on this page..
https://www.ncdc.noaa.gov/data-access/quick-links#loc-clim
I would love to have such data on Australia. You have any idea where I could find them?
The Temperature Data is available from the Australion BOM site, however it has been very much “adjusted” like the USA data. So you need to try and find Raw data.
There are a couple of people who may be able to help you starting with
http://jennifermarohasy.com/
If you read her latest posts you will see that she has been fighting BOM to try and get to the bottom of their shenanigans. You will also see references to other posters also looking at thier data.
PS, did you use Raw or Final data in your US study?
I’m not entirely sure what I’m looking for, but the internet archive https://archive.org has a number of archived copies of the gustofhotair blog. Here’s a copy from 2013 that certainly has some graphs although they may not be the ones you’re refering to https://web.archive.org/web/20130218083224/http://gustofhotair.blogspot.co.uk/
@Osborn Raw as sushi! Anything else would be pretty useless. Under “QCLCD ASCII Files” they have the raw data of all stations for one month. I used c code to extract all the relevant stations (yet a couple GB) and then some routines to calculate the averages.
I looked up the BOM site, but what they offer looks pretty messy, and there is no direct data access as I see it.
@mod Right, that is just what the abbreviations mean. I am trying to write a consistent summary of all the results, and I am at about 4000 words right now, and I am not finished yet. It might be a bit hard to put all the details hereto in a few sentences.
However, if someone is interested I am very much willing to share all details, including the data and the code. In fact I would love to have every discussion thinkable.
Two problems. CRE leads temperature, and both are increasing.
My main problem with these analyses is using absolute surface temperature instead of factoring in relative humidity. Temperature is only factoring in the average translational kinetic energy of the air at the surface and completely misses latent heat. If relative temperature and barometric pressure were the data of choice for climatology instead of temperature, I think we’d know a lot more about the climate.
There is also the point that they do not measure the Temperature of the “Surface” on Land, but they do at Sea.
Perhaps the Surface should be measured at the same time as the Air at 1.25m or 2m wherever it is actually read.
Hi Willis,
Further to a previous article you wrote dec 22/17 where I raised the issue of back conduction as opposed to back radiation. I’m boondocking and rarely have reliable access to the internet so my replies are often much delayed.
Your position as I understand it is that there is little surface warming due to conduction because hot air rises leading to a one-way process. I have no wish to hijack this post, so I’m not looking for a reply.
back radiation from CO2 also cannot net warm the surface. it is also a net one way process. it works (ghg effect) by slowing down the cooling of the surface. my point was that conduction and convection mimic this process.
as with radiation, at the molecular level there is a great deal of energy being exchanged between the atmosphere and the surface in both directions all the time. It is only when you look at the net exchange that it appears one way.
In both cases, when the surface is cooler than the atmosphere, there can be a net flow of energy from the atmosphere to the surface. but in both cases, even when the surface is warmer than the atmosphere, energy is still flowing from the atmosphere to the surface. whether it be via radiation or conduction.
also. as can be readily demonstrated on a pool table, a slow moving ball can speed up the motion of a fast moving ball, so long as the slow moving ball is moving slower after the collision. thus at the molecular level, a cold molecule can warm a hotter molecule via conduction.
Willis,
You wrote:
“… note that the global average change of CRE with temperature is 0.0 W/m2 per degree C. This might explain why there is so much debate even as to the sign of the change in cloud radiative effect with increasing temperature.”
That is entirely consistent with the best observational estimate of ECS as 1.8 K. But how wide a range would be consistent with your result? That is, how large are the error bars? A range from -1.0 to 1.0 W/m2 per degree C would correspond to ECS ranging from 3.7 to 1.2 K.
Willis Eschenbach December 22, 2017 at 10:56 am
ferdberple December 22, 2017 at 6:02 am
This process is one-way, by which I mean it doesn’t work in reverse.
============
from a previous post dec 22. my internet is down for weeks at a time.
Willis,
the same argument applies to LWR. every second of the day at a molecular level vast amounts of energy and momentum are transferred from the atmosphere to the surface via conduction. I expect it is orders of magnitude greater than solar energy. And at the same
time vast amounts of energy are transferred from the surface to the atmosphere.
It is only when you average each of these molecular collisions out (statistical thermodynamics?) that you see a net outflow from the surface to the atmosphere.
LWR by the same token is also a one-way process. When you average out the LWR radiation you get a one-way process from the surface to the atmosphere.
As such, I still believe there is a serious point to be made that back conduction is an analogue to back radiation, except that the energy exchange occurs via a virtual photon rather than an electromagnetic photon. As such, if back radiation causes a net warming then back conduction much cause the same.
ps: a quick experiment on a pool table will confirm that a cold molecule (slow moving ball) can heat (speed up) a warm molecule (faster moving ball) so long as the slow moving ball is travelling even slower after the collision. As such, at a molecular level a cold molecule can heat a warmer molecule via conduction. It is only when we aggregate the individual molecules that cold objects cannot heat warm objects.
Exactly.
The surface temperature enhancement above S-B is a consequence of conduction and convection NOT DWIR.
DWIR exists but is a consequence (not a cause) of the increasing temperature as one descends along the lapse rate slope. Thus it has NO additional surface warming effect.
The thermal effect of DWIR is already baked into the lapse rate slope which is itself caused by conduction and convection within a declining density gradient created by gravity.
I am finding that increasing numbers of contributors to this site and others are getting the picture at last.
Stephen Wilde January 20, 2018 at 9:56 am
Stephen, there’s a post in the list above called “A Matter Of Some Gravity“. In it I prove, not assert but prove, that if there are no greenhouse gases in the atmosphere of a planet, not only your proposed mechanism but NO proposed mechanism can bring the surface above the S-B temperature.
The proof is simple. It is a “proof by contradiction”. In such a proof we assume that your claim is true, and we see where that leads. Here’s the short version of the proof, long version at the link above.
Consider a blackbody planet in space, heated evenly from outside at a constant rate. By definition, the only way for the planet to lose heat is by thermal radiation from the surface to space. The atmosphere can’t radiate, no GHGs.
Now, consider what happens IF your or any other proposed mechanism is able to raise the temperature of the surface above the S-B temperature. Here’s the critical question.
At that elevated temperature, how much will the surface (and hence the system) be radiating to space on a constant basis?
According to Stefan-Boltzmann, the answer is, THE SURFACE IS NOW CONSTANTLY RADIATING MORE ENERGY THAN IT IS RECEIVING!
And that’s not physically possible. You can’t have a system which constantly radiates more thermal energy than it receives. It’s a violation of the laws of thermodynamics.
That is the proof by contradiction that your statement I quoted above is simply wrong. If it were true, it leads to a contradiction, so it can’t be true.
The surface can’t go above the S-B temperature unless there is something to absorb some of the outgoing radiation. As long as the surface is the only thing radiating, it can’t go above S-B. Only when the surface is radiatively decoupled from the total outgoing radiation by the action of the GHGs can the surface go above the S-B temperature. The GHGs absorb some of the outgoing radiation, so the total amount emitted to space is equal to the total amount of incoming energy.
Finally, you close with:
As my daughter used to say to me, “In your dreams, Dad” … in general, people here at WUWT know that the poorly-named “greenhouse effect” is real and that it is the reason we’re above S-B temperature.
But that’s not the question. The question is whether a small (~ 1%) change in downwelling radiation from a doubling of CO2 will perforce change the global temperature.
I say no, it will be offset by a small (~ 1%) change in cloud onset times and durations and optical thickness and the like, and the temperature will be basically unchanged.
Regards,
w.
Willis,
Your closing statement about the triviality of the effect of additional DWIR from additional human CO2 is fine but you are still wrong about the thermal effect of conduction and convection at the surface.
I explained your error in some detail in a previous post and do not wish to go into it all again here.
Basically, a surface at a temperature of 288k beneath a convecting atmosphere does not radiate to space at 288k. A portion of the available kinetic energy is used to sustain ongoing convective overturning via conduction.
A lot of contributors to this site and others are saying much the same thing.
Willis:
If you want to get under the skin of cloud behaviour may I suggest you look at the properties of water rather than concentrating on the radiation aspects which of course are also important.
Three most salient properties here are:
1) Gaseous water is lighter than dry air. (check the molecular weights)
2) Water has very high latent heats.
3) Evaporation takes place at constant temperature. (Try boiling your kettle above 100C at sea level.)
A quick look at the steam tables tells us that for every kilogram of water evaporated from the surface some 680 WattHrs. of energy is eventually dissipated into the atmosphere at varying heights, some reaching up to the top of the Troposphere as Cirrus clouds where the remaining energy is dissipated into space. ( That is why the ice is formed until such time the weight and gravity returns it all back to earth.
This movement of energy takes place upwards oblivious of GHGs and is powerful.
The process is the Rankine Cycle roughly described as: Surface evaporation. = The boiler.
Rising up through the atmosphere = The piston – work done against gravity. Condensation = The condenser at high altitudes. Rain/ice etc. = The feed pump, driven by gravity and the inherent potential energy. And lastly the Feed Heater as energy is collected from the atmosphere on the way down.
The whole process is a fine balance between the vapour pressure of water at the current temperature and the Partial Pressure of the gaseous water determined by Dalton’s Law.
and is occurring on a second by second basis at all altitudes with evaporation and condensation taking place sometimes within the same cloud.
(Lenticular clouds are a good example of this.’
The third property is important here as the evaporation takes place at constant temperature thus upsetting the normal relationship between energy and temperature, which can confuse modelling calculations.
Further: Should an increase in energy happen then the cycle accelerates rather than utilising more water. ( Power Station recycle the water, not like steam trains).
All in all I reckon it is water that provides the global thermostat and has dealt with all those changes in radiation inputs over the years remarkably well; but is somewhat better at cooling things rather than keeping us warm.
Just thought you would be interested
My regards to you and your cat.
cognog2 January 19, 2018 at 3:42 pm
I’ve written at some length about how the light water vapor forms the alternate fuel for the thunderstorm. The thunderstorm is able to make its own fuel. Storm-generated winds increase evaporation and make low-density air, which then rises into the heart of the thunderstorm carrying the latent heat of the water aloft.
You might enjoy my post “Air Conditioning Nairobi, Refrigerating The Planet“.
True, and I include that in all relevant calculations.
Sorry, but if I understand you this is simply not true. Consider what happens when you sweat. The sweat evaporates, and the evaporation of that water cools your skin.
So is your skin at 100°C? I don’t think so … I think what you mean is that water has a pressure-dependent boiling temperature that it will not exceed in liquid form. However, some amount evaporates at most any temperature.
In any case, you pushing me to look at the properties of water is … well … some years too late. In my research I deal with all kinds of properties of water—thermal, change-of-state, density, relative and specific and absolute humidity, partial pressure, radiative, evaporative, salinity, freezing point, the list is long.
Best regards,
w.
Many thanks for your response Willis. Appreciated. I go along with your comments on thunderstorms etc. and Am sure you probably have much more detailed knowledge on that than I do
Two salient points:
Re: Lighter than air:
Consider a Cirrus cloud at the top of the Troposphere. We have tonnes of ice at some -50C.
How did it get there? This ice radiates energy to space with a temperature differential of some 200C and grows in consequence until such time its weight prevails and it returns to earth. The water involved started out at some 10C in liquid form.
Hence the energy differential of some 680 WattHrs/kg. all of which has been dissipated either within the atmosphere or into space.
This all happens oblivious of GHGs and is a continuous process known as the Rankine cycle.
, involving large amounts of energy.
Your thunderstorms are a good example of the process at work where the energy is sucked up from the surface dissipated in the clouds with the water carrier returning to earth thus depleted of the energy as rain etc.
It takes a lot of energy to raise tonnes of water 40,000 ft against gravity.
Re: sweating.
My steam tables inform me that at 14.7 Lb/sq.inch the vapour pressure of water is 0.1781 Lb/sq.inch at 10C. Evaporation therefore takes place of the Partial Pressure of water in the atmosphere is less than this and will continue until the two pressures are in balance.
This occurs on the skin when we sweat and is happening at say the 10C as illustrated and why we have difficulty in cooling ourselves in high humidities and resort to fans to keep cool.
The process prevails right up through the atmosphere at often very low temperatures and pressures and operates at constant temperature at this micro level.
So, all in all, in trite terms I am contending that the Earth sweats to keep cool, just like you and I irrespective of pesky CO2.
My regards
(sorry- don’t seem to be able to proof read this so bear with me on errors)
Willis:
Loved your article on matters of gravity etc.
We appear to be singing from the same hymn sheet. I just suppose that my perspective comes from my steam training in the navy, thus hooked on the Rankine cycle ; so tend to express things differently.
My best regards and will raise my next glass of Vodka to you.
PS: I think something has gone wrong here. I think I am replying to Willis; but WordPress is telling me I’m talking to Frank. Apologies to both – not sure how to fix it.
Willis, I am curious whether you thought about the role of biological systems in cloud formation. One would think that where there is lots of vegetation, rising temperatures would result in more clouds due to increased evapotranspiration, whereas over deserts the effect would be minimal. If so, and in light of your hypothesis, deforestation might be a bigger contributor to climate change than emissions, especially since biotic condensation nuclei form larger droplets than abiotic nuclei, facilitating the formation of clouds rather than haze. Places where there has been massive deforestation often experience less rainfall, higher surface temperatures, and “humid drought.” Anyway, I did not see on your map any obvious correlation between biome (e.g. desert, rainforest…) and cloud radiative effect.
“So clouds have two opposite effects—less sunshine due to cloud reflections cools the surface, but more downwelling thermal radiation warms the surface.”
Why didn’t you mention the radiation emitted from clouds to space (as opposed to reflected) as a third effect ? (Don’t mean to nitpick, I’m just struggling with the subject matter)
There are so many mechanisms and pathways in weather & climate, but I condense it down to this: the hydrological cycle is very responsive to surface temperature, and the water vapor it liberates can easily transport away by convection surplus heat from radiative forcing. I believe it is the latent heat held in Earth’s oceans and soil moisture, and the low altitude clouds thus formed, that keep the surface 33 deg F warmer than an airless world. Radiative forcing is easily dominated by convection, as CO2 is easily dominated by H2O. Relative humidity must be a dynamic interdependent variable in any model that hopes to predict surface temperature.
Willis wrote: “But this is the first [CERES] Edition with surface cloud radiative effect datasets”.
I presume you realize that satellites in space can’t directly measure the amount of DLR reaching the surface from cloudy (or clear) skies. To predict the amount of DLR emitted by clouds, one needs to know the altitude/temperature of the lower cloud surface, which isn’t visible from space. These datasets are the output of reanalyses constrained with data from CERES and other sources of data.
Willis also wrote: “Warm relative to what, you might ask? Relative to the infinite heat sink of outer space. From outer space, we get on the order of 3 W/m2 of what is called “cosmic background radiation”. From a low-lying cloud, on the other hand, which is at say a temperature of about freezing, we get on the order of three hundred W/m2 of thermal radiation … and as a result, when clouds come over on a clear winter night you can feel the temperature difference. On such nights, you can feel how the advent of the clouds leaves the surface warmer than it was without the clouds.”
When we look up at the clear sky, we do not see only 3 W/m2 of cosmic microwave background radiation. We see about 270 W/m2 of thermal infrared emitted by GHGs in the atmosphere. (US Standard Atmosphere with no clouds). As you said, this value increases up to about 380 W/m2 when very low clouds are present, partially because low clouds are much warmer than the average GHG emitting to the surface and because clouds emit a blackbody spectrum while the GHGs in the atmosphere don’t absorb or emit in the atmospheric “window”. The values are from Modtran. The other link is to some of Roy Spenser’s experiments with infrared thermometers.
http://www.drroyspencer.com/2013/04/direct-evidence-of-earths-greenhouse-effect/
http://climatemodels.uchicago.edu/modtran/
Willis wrote: “Figure 3 clearly shows that my hypothesis is correct. In the tropics, as the surface warms, the clouds act to increase their cooling effect. Not only that but in some areas, the effect is very strong. Over the “Pacific Warm Pool”, the warmest part of the world’s oceans shown in blue in Figure 3, there is a very strong cap on further warming. For each degree of warming, the clouds cool the surface by up to -20 W/m2.”
When you are considering the surface energy balance, you need to take into account both radiation and convection. If clouds are forming, latent heat is being released and the lapse rate and therefore convection could be decreasing. So clouds are blocking SWR at the same time convection could be removing less heat from the surface of the ocean.
Certain aspects of Willis’s thermostat hypothesis might need refining. If there is any wind blowing to mix the top of the ocean, SWR doesn’t warm the surface of the ocean appreciably. The most common diurnal range for SSTs is only about 0.3 degC, which isn’t likely to drive a lot of convection during the daytime.
http://journals.ametsoc.org/doi/full/10.1175/JCLI3999.1
SWR arriving at the surface of tropical islands can cause a large increase in temperature, at least until the onshore breeze initiated by rising air begins to limit warming. Eventually clouds form and block SWR. So the thermostat hypothesis could apply in the vicinity of tropical islands, but perhaps not in the open ocean.
The diurnal cycle of precipitation shows a similar trend. Over land, the most precipitation falls in the afternoon. Over ocean, the most precipitation falls in between 3:00-6:00 am (when radiative cooling has lowered their temperature the most.
http://journals.ametsoc.org/doi/full/10.1175/2009JCLI2890.1