From the “children just won’t know what snow is” department and political cartoonist Rick McKee of the Augusta Chronicle. He drew this in 2014, but with all the scrambling by climate scientists to explain our current record cold snap, this is still germane today.

and more, no wait, less snow, more, no wait less humidity, less, no wait more rain, more, no wait fewer Hurricanes.
Any theory that cannot be falsified is not a theory.
It appears the theorists have falsified themselves!
While you guys are nattering on, I have a real issue with online forecasters like Accuweather. They are currently posting articles that imply that their ‘Real Feel’ temperature calculations are the actual temperature, which is not true. Their ‘Real Feel’ result frequently does not coincide with the wind chill, which is more accurate, and they are implying that ‘Real Feel’ counts for more.
Here’s a link to their current article on winter forecasts for the central USA including the Midwest: https://www.accuweather.com/en/weather-news/piercing-cold-blast-to-feel-subzero-in-central-northeastern-us-in-time-for-2018/70003687
If you read that, you’ll see their emphasis on ‘Real Feel’. It’s my view that they are misleading people, intentionally or otherwise in this article, never mind their implying that this winter’s weather is somehow abnormal, when it is not.
Now, how does one get them to stop doing this and just report the weather and the forecasts accurately? They don’t like criticism at all.
Crackuweather.
If they wanted to create an actual “quantifiable” measurement system they should concentrate on the heat energy (enthalpy) of the local atmosphere. However that would require the general populace to understand concepts like relative humidity, atmospheric pressure, latent heats of phase change, and all that other sciencey stuff that couldn’t be bothered with in high school.
Humans do not feel temperature. We sense heat flux through our skin, which is a more important adaptation as the flow of heat in/out of our bodies is far more important in controlling our internal core heat. Heat transfer rates are also very important. That is why when one “feels” items of equal temperature, one may feel colder than the other, such as between water and air. The heat transfer (convection) rate to dry vapors (air) varies between 0.5 – 1000 (W/(m2K)). The heat transfer rate to water is between 50 – 3000 (W/(m2K)). Water can “feel” 10 times colder than air of equal temperature. If you jump from a 22 °C room into a 22 °C pool it will feel damn cold! Which is why we evolved to realize that if we stay in cold water we will die.
So, if we really wanted to give people something meaningful perhaps we need a better name for:
Joules/kilogram
(more intelligent meterologists wouldn’t hurt either)
I generally use weather.gov for near term forecasts and Joe Bastardi for forecasts that are way out there. (Weatherbell.com is doing quite well with their analogs this fall and winter.)
There are actually issues with the way windchill is measured. It uses a hot wire (as in many automotive Mass Airflow Sensors) and measures the energy lost from air movement and compares it to a calibration chart for heat loss in still air at the temperature indicated by the thermometer. So, if the temperature is -25 C and the hot wire indicates -42 C, it is announced as -25 C, -42 C with the windchill. As windchill is more or less a people problem, some brave volunteers stood in frozen wind tunnels to measure how quickly heat flowed from exposed skin as freezing cold air was blown past them.
The results of these tests did not match the hot wire methods for changes in heat loss, so more tests must be done to accurately measure wind chill, but that requires more brave volunteers.
Wind chill charts and ‘Real Feel’ are to be used as guidelines when outdoors. They don’t have to be absolutely accurate to provide useful information. When participating in winter operations, we had to pay particular attention to the wind chill charts we were given. Especially when the actual temperature was in the -10 to -45 degree F range. Going number 1 and number 2 out of doors in those conditions took planning if you wanted to prevent frostbite to the real personal parts of your anatomy. To me, it doesn’t matter what you use as long as you take the necessary precautions to prevent cold injuries.
This “Real feel” is a subterfuge to actually do the opposite.when the thermometer says thirty below they want to deligitimize it and have people think that its really not that cold, it just feels that way.
Apparently, a select group does not acknowledge the truth of falsifying.
So is any theory, like CO2/warming, that isn’t backed up by any hard evidence in the peer-reviewed literature.
Dont you get it yet? Climate change causes everything bad about the climate and we the left decide what is bad.
Ps im not left.
It’s simple: Everything bad is caused by Climate Change.
What don’t you understand?
Climate change and social injustice. And the hard right. And fascism. And corporate greed. Only by voting for the Liberal Left can this be sorted out properly.
Leo
the ‘hard right’ is something like the UK Libertarian Party which promotes small government, low taxes, a peaceful society, and personal freedom.
Any other ‘manifestation’ of the right is either left, or fascist influenced violent oppression of the individual.
It was, after all, the American Democratic party that historically demanded slavery be accepted; and the UK labour party that currently demonstrate anti Semitic behaviour; the very things the American Republican party was established to oppose.
The supposed far right march with prominent swa*tika’s, an image of the left as Hi*ler was a socialist.
Leo, their is no liberal left anywhere. There is the authoritarian Left. Only the speed at which they take your freedoms varies. “Liberals” are currently trampling on the 1st Amendment in US colleges. Anti-Semitic “Liberals” voted with Muslim states to condemn the US over Jerusalem. “Liberals” dress in black and bash women with clubs and mace them.
Tony had this one up at his sight, Might make Leo have a thought.
You forgot the all-important closer:
And it’s all your fault! *
* … if you have the wrong political leaning.
The solution to global warming is simple, We toss all the believers in climate change into a volcano as a sacrifice to the climate gods. And the climate gods will stop us from hearing all the dire warnings about climate change! See Simple! 😉
Global warming causes ‘it’ ! …. It is kinda like “is” is !
I think we can now just called it what has now become under Komrade Gore et al, which is Klimate Fr@ud!
Oh no, that won’t do at all. That’s honest.
I posted this on another post but since it seems to fit with other CAGW super-sciency theory I’ll add it here again.
Why, in the face of this unrelenting planetary fever is this winter very cold?
Because, just as it has before, the heat is hiding deep in the ocean again. That is its safe space.
Someone told me today about how winters are supposed to be colder due to CO2…uhg CO2 is magic.
It is amazing how people can totally twist reality in their heads and never even blink.
Memory states plainly, “I did that thing.”
Pride responds indignantly, “I would never have done such a thing.”
Eventually, memory grows weary and falls silent,
but pride never tires and never stops talking.
Ted Kennedy and his supporters in a nutshell.
Hell, anybody that supports people like the Clintons falls into that category.
Obviously the way to stop more Global-Warming-Coldness is to burn more Green.
Ain’t gunna’ happen under Trump. (Glad I have a snowblower!)
Did you say “Green” or “Green’s” If it’s Green’s…Well that will work. 😉
And all weather events are a danger to life these days certainly if they have been given a name. How did we ever manage to survive without the help of these weather forecasters. It seems like we are going to have a bit of a “Magic Roundabout” going on in the UK soon.
https://www.msn.com/en-gb/news/uknews/uk-weather-latest-storm-dylan-bears-down-as-forecasters-warn-of-potential-for-injuries-and-danger-to-life/ar-BBHuA9x?li=BBoPWjQ&ocid=wispr
Guess we should all get used to flurries named Fred.
I resemble that!
Fred Brohn on December 30, 2017 at 7:26 am
I resemble that!
In what way do you resemble a flurry?
Today in Surrey, we have Reasonably Normal Day Aline.
Tomorrow we expect Rather Wet (In Places) Day Bertram.
Sometime next week, statistically, we will have Reasonably Normal Day Carabao and, maybe, Dolores.
There really is no end of fun to be had helping the Met Office with their kiddies’ amusement; remember to start each month with ‘A’ again.
Auto – the spirit of Christmas may have worn off a bit!
[Not ‘spirits’ – I’m a red wine man!]
Reginald the Partly Cloudy Day is on his way, run for ya loives!
Or breezes named Barbara…
And when the glaciers start moving through Canada and begin their move across the border, it will still be called climate change and mankind will still get the blame.
Yeah. They’ll say Trump should have built the wall further north.
Bite your tongue. I live in Canada and I don’t want a glacier in my backyard – thanks anyway. The forecast for New Year’s Eve in Toronto is -26°C (w/o the wind chill); normal is -8°C. The city has planned for abbreviated New Year’s celebrations at city hall because of the extreme cold. Bring back global warming!
I thought all Canadians lived in igloos cut out of glaciers. Well live and learn.
But please don’t forget – we need that -26 to really be about -28 degrees – as per the recommendations of the Intergovernmental Panel on Climate Change (IPCC) – then all will be good with the planet again in 100yrs
GoT fans will respect the utility of “The Wall”.. “Winter is coming!!”
I think a definitive journalistic response is this one by Sean Thomas for the Daily Telegraph in 2013.
https://cbdakota.wordpress.com/2013/06/21/climate-scientists-know-big-scarry-words/
Excerpt: – “Here come de heap big warmy. Bigtime warmy warmy. Is big big hot. Plenty big warm burny hot. Hot! Hot hot! But now not hot. Not hot now. De hot come go, come go. Now Is Coldy Coldy. Is ice. Hot den cold. Frreeeezy ice til hot again. Den de rain. It faaaalllll”.
Ah, OK….I see Anthony has covered this before….. Hahahahahaha…. We really must just keep laughing at them.
https://wattsupwiththat.com/2013/06/19/hump-day-hilarity-big-kahuna-warmy/
“For a final word, I turned to the greatest climate change scientist of all, Dr David Viner, one-time senior research scientist at the climatic research unit of the University of East Anglia, who predicted in 2000 that, within a few years, winter snowfall would become “a very rare and exciting event”.
However, he was trapped under a glacier in Stockport, so was unable to comment at the time the Telegraph went to press.”
Hahahahahahahahahah……Oh dear…phew.
Our current weather was predicted quite well in advance by weatherbell and Joe Bastardi in the free updates.
The best predictors are still the analogous years, and models based on those combined observations.
Our weather man will often show us two different models when forecasting. He’s great about saying “the models are all over the place so we just don’t know yet”.
For today, the models missed by a mile. Temperature dropped 20 degrees in two hours, not the predicted 10 hours or so. The low was dropped to even lower as it got colder and colder. Weather timing is a definite mystery to the models. They can get the cold, the wind, but the timing……
Sounds like your weather man isn’t a weather man.
RAF terminology in WW2 for a met man was “the guesser”
Another Ian
Based on my reading I am actually impressed by how accurately the allied meteorologists were able to forecast weather with the limited tools they had compared to now.
Just rereading the book ‘Combat Crew’. It is IMO the definitive work for getting through to the reader just what the crews of the B-17’s in the 8th Air Force in 1943 went through. The author, John Comer, was a flight engineer (combat position top turret) that kept a journal and does a great job of explaining all the challenges and events in all aspects. He was on both of the legendary Schweinfurt raids. The bottom line is that no matter if it was a Fortress or a Lancaster, or any of the various other types of heavy bombers, there were one heck of a lot of ways to die other than being shot down by fighters or flak.
Those were real men, RAH. Thank God.
And I’m an atheist.
Allied weathermen forecast that there would be a brief break in stormy weather during June, 1944.
German weathermen didn’t. This was one of the reasons why Rommel was willing to leave the coast to attend his wife’s birthday party.
I believe Bastardi is a weatherman in the mold of Drexel University’s, Dr.Frank Davis of WPVI ABC 6 out of Philadelphia PA. His predicting accuracy was 92% and was unmatched during his tenure. Understand that his forecasts were before computers and models. Dr. Davis knew the five major weather systems that effected SE Pennsylvania and like Joe was a student of weather history.
Just spent Christmas (Oops, the festive season, gag) in Winnipeg, where anthrogloarming ensured temperatures colder than both Mars and the North (oops again), Festive Pole. Good to know I have myself to blame.
And please, spare just one minute, to think of the Polar Bears. One minute the ice is melting, next its a zillion below, the horror, please send WWF $ to protect their environment as seen on TV adverts (whatever that means)
Poor Polar Bears.
Poor us.
Is that a real statistic, Jones, or fake news?
Hi Dave, dunno about when Al was born (may have been far higher population then of course with more primitive tracking methods of the day…dunno) but the current figure appears appropriate but seemingly with a wide variability in estimates.
https://polarbearscience.com/2014/02/18/graphing-polar-bear-population-estimates-over-time/
https://polarbearscience.com/2015/05/31/global-polar-bear-population-size-is-about-26000-20000-32000-despite-pbsg-waffling/
I’d be grateful if you have an authoritative source for data over 50 years ago? (rather than my random meme).
From the graphs, it appears 1960 bear populations estimates ranged from a low of 5,000 to a high of 15,000. Compare that range to the approximately 30,000 bear numbers of today.
I don’t care when Al was born, but Polar Bears seem to be doing rather well under global warming.
Polar Bears live on land and hunt on the edge of the sea ice, for their favourite baby seal menu.
When the sea ice is abnormally extreme, like in the late 1970s, of course the polar bears have problems hunting..
So much further to go to get to the ice edge.
Dave Fair
It’s been restrictions on hunting that have resulted in the numbers of polar bears increasing. Being over hunted by this planets top predator is far more dangerous to most species than “climate change” in the shorter terms.
Are you trying to say that there are greater threats than global warming, RAH?
I’m told that, under Obama, the generals said that global warming is the premier security threat to the U.S. That fat guy with the funny haircut having nukes and ICBMs doesn’t rate a mention?
Thanks Mr(Ms?) Jones for providing me with a very funny cover for my next New Year greetings card.
September 2017 http://siberiantimes.com/other/others/features/lunch-arrives-on-wrangel-island-and-230-polar-bears-show-up-for-the-feast/
http://siberiantimes.com/upload/information_system_52/7/1/7/item_7175/information_items_7175.jpg
http://siberiantimes.com/PICTURES/OTHERS/Polar-bears-Wrangel-island/ins1.jpg
Utterly fascinating !!!
If the trend continues, Al Gore will be changing his name to Dick Bigger and peddling . . . well, I think you can figure out what he will be peddling.
Bovine Scat?
Or, as in the Life of Brian, the Latin form is Dickus Bigus.
In that case, Peyelut, gravitas has taken over his neither regions.
Gore is a climate change icon because we are told it is so.
I have a gweat fwiend in wome called Bigus Dickus!
Transposition is a bitch, Jer0me. Mea Culpa.
Welease Woger
I am Brian!
It was so cold … restaurants had to stop serving metal cutlery. Some people walked around for days with spoons or forks stuck to their tongues!
It was so cold … hitchhikers were holding up pictures of thumbs!
It was so cold … chickens were running into Kentucky Fried Chicken and begging to use the pressure cooker!
It was so cold … when I dialed 911, a recorded message said to phone back in the spring!
It was so cold … the optician was giving away free ice scrapers with every new pair of eyeglasses!
It was so cold … kids were using a new excuse to stay up late: “But Mom, my pyjamas haven’t thawed out yet!”
It was so cold … the travel agency was advertising tropical vacations in Igloolik!
It was so cold in Times Square … pickpockets were sticking their hands in strangers’ pockets just to keep them warm!
It was so cold … the squirrels in the park were throwing themselves at an electric fence!
It was so cold … Grandpa’s teeth were chattering – in the glass!
It was so cold … the rats in Manhattan were bribing the alley cats for a snuggle.
It was so cold … we had to chop up the piano for firewood – but we only got two chords.
It was so cold … I forgot about “Global Warming”. 😎
That is a good one, thank you.
It was so cold … climate scientists had their hands in their OWN pockets!
I nod my head to the greater wit.
I remember a movie on such Richmond….. Hitchcock does it again!
http://www.filmsite.org/posters/tocatchathief.jpg
PS I think there are some who keep track of and save humorous comments.
I think this rates as a classic.
“Richmond December 29, 2017 at 8:53 pm
… climate scientists had their hands in their OWN pockets!”
Climate scientists with hands in pockets feel cocky all day.
Ouch! The wags are out in force.
“It was so cold … climate scientists had their hands in their OWN pockets”
Well that certainly is an interesting way of describing global negative-warming’s effect on the climate clique circle jerk.
It was SO cold last night … I slept in the refrigerator. It was the warmest place in the house.
It was SO cold last night … all the naughty kids asked Santa for another lump of coal.
It was SO cold last night … all the politicians stopped talking. They wanted to keep all the hot air for themselves.
It was so cold the kids had pee-sickles hanging from the bed.
the CAGW mob decide who can call weather climate and who cannot:
29 Dec: PBS Newshour: Fact-checking Trump’s tweet about cold weather and climate change
Michael Oppenheimer: It’s impossible to say what was in the president’s mind, but he probably was trying to confuse other people about the reality of climate change.
This cold snap is weather. Weather is what you experience day to day. Climate is the long-term average of weather over periods of years, decades, centuries or even longer.
Let me give you an analogy from the stock market. It’s perfectly possible for the stock market to be rising due to understood factors like favorable economic forecasts, and yet to decrease significantly for one day, several days, a month or even several months. That happens all the time, even though the long-term trend might be continuing thereafter.
It’s the same thing with climate change. The Earth’s temperature is going up. It’s been going up for about a century. That increase is due to the buildup of the greenhouse gases caused by — by and large, by the burning of coal oil and natural gas…
So there’s a long-term trend of warming. This cold snap says nothing really about that long-term trend. And that trend will continue until we make a radical reduction in the emissions of carbon dioxide and other greenhouse gases…
John Yang (PBS): So, given that distinction, do scientists see a connection between climate change and episodes of extreme weather?
Michael Oppenheimer: Yes, some episodes of extreme weather can be tied directly to the buildup of the greenhouse gases caused by human activity.
For instance, the incidents of extreme heat has increased and episodes of heat waves are increasing faster these days than they would without the buildup of greenhouse gases. And that connection has been made clearly. Similarly, incidents of very high water at the coasts, which is related to flooding, for instance, when a storm comes along, has been tied in some cases to the buildup of the greenhouse gases through its effect on sea level rise.
So, overall, there are some episodes of extreme weather that are directly related to the human buildup of greenhouse gases…
https://www.pbs.org/newshour/show/fact-checking-trumps-tweet-about-cold-weather-and-climate-change
Defund PBS.
“Michael Oppenheimer: It’s impossible to say what was in the president’s mind, but he probably was trying to confuse other people about the reality of climate change.”
I don’t know about Trump and what he knows about climate change, but Michael Oppenheimer was definitely trying to mislead people with his statement. For one, it has been generally warming for over 200 years, not 100 years. It is impossible for to blame CO2 even for the warming trend underway 100 years ago, but it is close enough that he can pretend that it might have done something. He must know better.
Secondly, the only way you can tie warm episodes to man-made climate change is by assumption. This is just confirmation bias: “If anything we expect to happen actually happens, then it confirms our reasoning for it to happen was correct.”. This logic is obviously false, but Mr. Oppenheimer has no trouble trying to use it to mislead people.
Finally, the best scientific evidence for sea level rise indicates that it is rising at the same rate as last century, with no discernable acceleration. Put simply, there is no evidence that increasing atmospheric CO2 is accelerating sea level rise. There is no evidence that CO2 is causing sea levels to rise faster, and Oppenheimer is, once again, assuming it is so and talking about it as a fact.
It is quite apparent that Oppenheimer is deliberately misleading people about climate change reality, by confusing his personal desire that humans be blamed with scientific knowledge.
Sympathy to you poor freezing souls in the North of the Americas, but just what or who is PBS and Mr Oppenheimer?
Apologies for my ignorance
Happy Hogmany to you all
I think the Michael Oppenheimer in question is a volcanologist who certainly should, given he has written a good general survey about notable eruptions, be a bit more cautious than the wild attribution of human causation to something that is decidedly lacking in any definitive scientific evidence.
Waterside~ PBS is the Public Broadcasting System, sort of the US version of the BEEB.
And Oppenheimer? He’s an insult to the one who helped build the Bomb. Hopefully not related.
PBS = Public Blathering System.
“This cold snap is weather. Weather is what you experience day to day. Climate is the long-term average of weather over periods of years, decades, centuries or even longer.”
Is 17 years long enough to be climate? When I check NOAA’s Climate at a Glance page (https://www.ncdc.noaa.gov/cag/time-series/us) for year to date min and max from 2000 to 2016 across the contiguous United States, it averages as:
Min
2000-2007 : 41.58F
2008-2016 : 41.49F
Max
2000-2007 : 65.43F
2008-2016 : 65.26F
So in the 17 years to 2016, the first half was 0.09F warmer in min and 0.17F warmer in max.
i.e. the first half mean temp was 53.51F and the second half mean temp was 53.37F, so the mean temp in the US has cooled 0.14F over the 17 years to 2016.
In fact, if I stretch back 20 years to 1997, the first 10 years were 0.1F warmer than the second 10 years in min, and 0.03F warmer than the second 10 years in max. i.e. 0.06F cooler mean temp over the past decade than 1997-2006 when the US was at its hottest.
Let me give you an analogy from the stock market. It’s perfectly possible for the stock market to be falling due to understood factors like unfavorable economic forecasts, and yet to increase significantly for one day, several days, a month or even several months. That happens all the time, even though the long-term trend might be continuing thereafter.
The current cold snap sounds like the sort of weather you might expect in a cooling US climate over the past 20 years. What is it about the NOAA figures that I’m not understanding?
“What is it about the NOAA figures that I’m not understanding?”


I don’t see where you gat it from. The trends 2000-2016 are quite positive. +0.26F/decade for max, and +0.41F/dec for min.
Yuck, yuck, yuck, Nick. Start on a La Nina and end on a Super El Nino.
I have a great internet stock to sell you.
That’s a theoretical trend Nick. Apply the real error bars and it’s a nonsense.
I get it from annuals via the link and do the averages myself rather than using NOAA charts.
eg for min and max …
1997 40.68 63.72
1998 42.82 65.63
1999 41.55 66.20
2000 41.21 65.31
2001 41.74 65.64
2002 41.22 65.19
2003 41.40 65.11
2004 41.57 64.61
2005 41.78 65.49
2006 42.08 66.41
2007 41.67 65.64
2008 40.13 64.45
2009 40.60 64.17
2010 41.31 64.66
2011 41.20 65.16
2012 42.88 67.69
2013 40.70 64.15
2014 40.73 64.34
2015 42.71 66.07
2016 43.13 66.69
LOL, There’s Nick, yet again relying on the El Nino effects of 2015/2016
Why no dates, Nick?
What year is that big spike, 2012 ?
You is a funny little fella, nick !!
30 years ago, when I took a course in Weather and Climate, “Climate” was defined as a 30-year average of atmospheric conditions. According to the prof, thirty years was long enough to define the prevailing conditions, as well as including some unusual events (blizzards, droughts, hurricanes,…)
Nick Stokes: If one puts the +/- 0.5 F error bars on that TMAX graph and does a little warming of the past and cooling of the present — all within the boundaries — one can get a negative trend per decade, and be just as statistically significant.
If only you guys would stop using statistics as a hammer and chisel to shape the data into what you want it to be, and instead, use it for its intended purpose of showing the usefulness and significance of what you’ve measured and how you measured it, Using interpolation to create temperatures in areas where no measurements exist, and then using those interpolations as DATA in the equal-area grids — just because you HAVE to have them to get the average global anomaly — should be waving a big red flag in the air signaling THIS IS WRONG.
“There’s Nick, yet again relying on the El Nino effects of 2015/2016”
waclimate chose the years, not me. I’m just checking the arithmetic.
waclimate,
“rather than using NOAA charts”
Your method is subject to the chance of years. 2008 was cold, and you included it in the later part (9 years vs 8). If you comapred 2000-2008 vs 2009-2016 you’d get the opposite. A 0.24 increase in average minimum and 0.05 increase in maximum. It’s just the vagaries of chort intervals.
Nick … I knew there was an uneven division of years from the millennial start year of 2000, which is why I went back to 1997 for a 20 year “climate” evenly divisible for 10 year comparisons.
As per my earlier quoted NOAA stats …
1997 40.68 63.72
1998 42.82 65.63
1999 41.55 66.20
2000 41.21 65.31
2001 41.74 65.64
2002 41.22 65.19
2003 41.40 65.11
2004 41.57 64.61
2005 41.78 65.49
2006 42.08 66.41
Is 10 years : Min average = 41.61F / Max average = 65.33F
2007 41.67 65.64
2008 40.13 64.45
2009 40.60 64.17
2010 41.31 64.66
2011 41.20 65.16
2012 42.88 67.69
2013 40.70 64.15
2014 40.73 64.34
2015 42.71 66.07
2016 43.13 66.69
Is 10 years : Min average = 41.51F / Max average = 65.30F
i.e. min 0.1F cooler and max 0.03F cooler across the contiguous United States over the past decade than in 1997-2006.
The warmer first decade includes 1997 which was before the 1998 ENSO shift, as apparent above with that year’s considerably cooler min and max. When 2017 data is published by NOAA, it’ll be interesting doing a 1998/07-2008/17 comparison without that opening cool year.
You don’t seem to be arguing the accuracy of the annual temps I’ve averaged from the NOAA source.
I’m not sure why there’s not a headline declaring the US cooler over the past decade than the previous decade, based upon the national annual temperature averages published by NOAA.
I do not know this Nick Stokes person, but he sure thinks he is an expert on global warming. My education taught me that X is the unknown quantity and a spurt is a drip under pressure. Enjoy being an Xspurt Nick for the cycle of cold that comes around every few hundred years is due, even the sun is doing its usual sabbatical.
“Impossible” my big white butt. He was trolling the heck of you all, and you Just. Couldn’t. Resist. Responding.
HOW many times have people said ironically, in the midst of a cold snap, “So much for global warming, eh?”
Millions of times, at least. But yet, they just couldn’t let it go. Must be tough to be so thin-skinned.
Why is it, James, that liberals take personal offense at statements of fact?
I have had it with this Global Warming Sting. I need to move from Sarasota to Cuba, or Equador, to escape the chilling results from such. I was to be sweating, not shivering, by all accounts! PFFFFT!
In the immortal words of the MIA Bob Tisdale,,,,,, Burrrrrrrr!
Where is my warm blob now Bob?
Nough said…… dangit….
I miss Bob, ossqss.
Bob last posted on his website in September noting he was still on holiday.
I’m assuming somewhere warm compared to the majority of North America in the deep freeze.
Calling Mr. Tisdale! Calling Mr. Tisdale!
[Please]
CO2, the miracle molecule. Just an increase of 1ppm can result in all types of climate catastrophes.
Snow and frost came to Washington.
http://images.tinypic.pl/i/00953/jh8dh8fbj77n.png
Yep, it’s about time that some people like Dr. Ball, Tony Heller, and Anthony all go testify before a senate committee. That is after some friendly senator opens all the windows and turns down the thermostat in the chamber the night before the hearing is scheduled.
Preferably in January.
Time to redefine the meaning of AGW: Annoying Global Weather
Sorry. The forecast leaves no illusions. La Nińa will help, because there will be less water vapor over North America.
http://www.cpc.ncep.noaa.gov/products/stratosphere/strat_a_f/gif_files/gfs_z100_nh_f240.png
Ren
MORE water vapor would be helpful as far as helping to keep temps warmer. But of course it would also mean more snow.
Ren, but you can not blame the polar vortex this year as in 2014. He still sits loyally and well above the North Pole (or not far from it). The fact that it can be just as cold or even colder without such an event shows already the whole crap of the GAGW.
lt looks like this cold weather in N America is linked to jet stream activity over the mid Pacific. Because it seems that when the jet stream flows across from the SH over to the NH over this area it has a very disruptive effect on the jet stream which flows across the northern Pacific. lt looks like it forces the main jet stream to become much weaker which causes the jet stream to split or bend northwards. This weakening of the jet then allows blocks of high pressure to form along the western coast of the USA. Which in turn helps to form the cold “Arctic blast” weather that N America is now getting. lts given me very real insight into to how La Nina can be linked to cold winters in N America and how this jet stream patterning could be climate changing should it become persistent.
Comrades, what we are discussing here is not just a climate change or the catastrophic climate change it is
the CLIMATE PERESTROIKA
We need Climate Glasnost.
“In a MODEL!”
No, I have only posted graphical representations of current NH temperatures.
I think the headline to this article needs changing from ….
“Friday Funny – the certainty of global warming and warmer, er colder, winters”
To….
“Friday Funny – the certainty of global warming and warmer, er colder, regional winters in central/eastern USA and Canada”
Those of you who have seen my recent posts on this bout of weather will know why
But for those that have not……
http://pamola.um.maine.edu/wx_frames/gfs/ds/gfs_nh-sat1_t2anom_1-day.png
Wow , isn’t it great to see part of the Arctic and NE Russia at -35ºC instead of -45ºC ! 🙂
Off you trot to this nice warm places for your tropical holiday , Tone. 🙂
Toneb seems to be a one trick pony.
Toneb is apparently Tonedeaf.
CO
Copy right infringement I gave him that name 2 years ago!!!!
Very witty RAH.
But if you say so.
Funny int it that -45 becoming -33C isn’t warmer.
But 23 to 35C is.
Funny, a heat wave, anywhere in the world is proof of global warming. But cold spells are always just weather.
Toneb, what makes you think it’s all our fault?
“Toneb December 30, 2017 at 5:43 am
Very witty RAH.
But if you say so.
Funny int it that -45 becoming -33C isn’t warmer.
But 23 to 35C is.
In a MODEL!
Is there anything miracle gas can’t do?
(Apart from making individuals incredibly rich at taxpayer expense)
According to Climate Reanalyzer, “This climate baseline (1979-2000) is used instead of the 1981-2010 climate normal because it spans a period prior to significant warming of the Arctic beyond historically-observed values.“ But they don’t mind including the coldest years since the LIA in their base.
Well, if you stick the +/- 0.5 C error bars on those anomalies, they don’t look so bad. Hardly seems proper to call it “global” warming when it’s basically just the northern hemisphere doing most of it.
And a 1-day average, forsooth. Why not a 1-minute average, it’d be as meaningful.
“Well, if you stick the +/- 0.5 C error bars on those anomalies, they don’t look so bad. Hardly seems proper to call it “global” warming when it’s basically just the northern hemisphere doing most of it.”
Have you not noticed that the NH is stuck to the SH?
And that most of the SH is ocean, which is a massive heat sink, limiting decadal change to oceanic current phenomenon such as the ENSO cycle.
The NH can have vastly larger temp changes on short time-scales due it’s large land-masses, which can both quickly transfer heat to the atmosphere and cool it when (as now) snow covered.
I thought it was the atmosphere trapping the heat and sending it back down onto the land, causing the warming, not the land warming the atmosphere.
The centers of Australia, southern Africa and southern South America are sufficiently far from maritime influence as to be free from their effects. Never heard anyone speak of the sea breezes cooling Alice Springs. The are plenty of places in the NH that are subject to maritime influences that still show warming. Are you really arguing that only the SH is susceptible to ocean cooling, and all the similar sites in the NH are not?
My favorite piece of abject ignorance comes from the Tweeter who claimed that global warming means extreme weather, and this cold snap is extreme weather, therefore it is caused by global warming.
Trump was only paying back those who claim hot summer days are an indication of global warming.
So NOW we hear the global warmists making a distinction they never made before, about weather and climate. It is also true that few, if any, serious researchers deny that the Earth is warming and has been for a very long time. The issue is 1) how much? and 2) why? Even the simple “how much?” is an unsettled question. The “Why?” is very much unknown except that the contribution of CO2 has been exaggerated considerably, perhaps excessively, primarily because it is the most obvious suspect to blame and climate is very much a mystery. And many climatologists don’t want to admit that their science is so primitive that its predictions practically cover every possible eventuality, thus can predict nothing. Any arguments that do not acknowledge these realities are irrelevant.
Arthur4563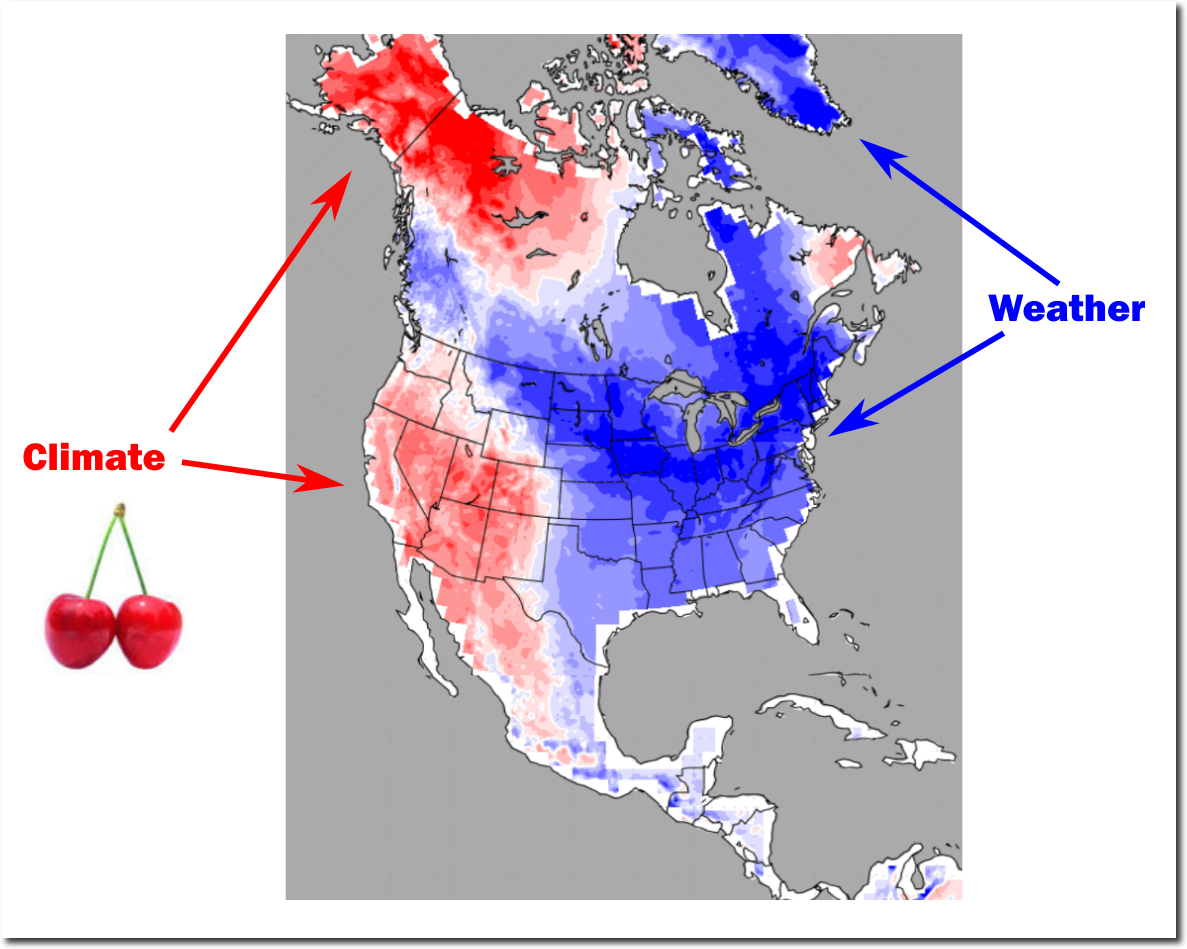
They’ve always made a clear distinction between weather and climate.
Here is an example from Tony Heller:
Is it the weather?
Devils Lake, North Dakota
Current Conditions – F | C As of 6:09 AM on Saturday 30 Dec 2017 (Local Time)
View 1 Active Weather Alert
P Cloudy Partly Cloudy
-27F
Feels Like: -46
Wind Chill: -46 Ceiling: NA
Heat Index: -27 Visibility: 10mi
Dew Point: -33 Wind: 7mph
Humidity: 71% Direction: 300WNW
Pressure: 30.83″ Gusts: NA
ren
At the moment over the Arctic there is a jet stream flow starting in northern Russia and moving over the Arctic and into N America. When you get this flow of the jet stream over the Arctic then l have noticed itcauses intense cold to form over the landmass it flows into.
Right now there is about a foot of cold, white weather on my roof with more accumulating by the moment.