
People send me stuff.
Today my inbox got what some people might describe as an important clue to finding the “holy grail” of climate science. It’s a big step forward, it’s an even bigger step to get those entrenched, invested, and employed in the “CO2 rules the climate” theory industry to accept it. The battle of self-correcting science is about to be fought.
In a few days, I’ll be able to tell you what it is, since it is embargoed, but for now, I wanted to remind you all of this quote from the past:
“The most obvious way for warming to be caused naturally is for small, natural fluctuations in the circulation patterns of the atmosphere and ocean to result in a 1% or 2% decrease in global cloud cover. Clouds are the Earth’s sunshade, and if cloud cover changes for any reason, you have global warming — or global cooling.”
That’s from Dr. Roy Spencer’s book: The Great Global Warming Blunder: How Mother Nature Fooled the World’s Top Climate Scientists
My advice: get a copy between now and Tuesday, and read it.
Also, on the subject of clouds and climate, this analysis by Willis Eschenbach is also well worth reading, because it illustrates the self-regulating mechanism Earth has due to cloud action.
Where The Temperature Rules The Sun

Meanwhile, as hinted at in the title graphic, invest in popcorn futures.
Could there be a “holy grail” of climate science yet to be discovered? It will be interesting to parse that, and the debate that ensues. One thing is certain…the climate the last 150 years has been about as positively conducive to human kind as it it could have ever been. Probably can’t get much better than this.
“Could there be a “holy grail” of climate science yet to be discovered? ”
Yes.
And, in genuine science, once they find it, they’ll realize there’s another one to find.
Obviously hints at clouds, the real and obvious control knob of “climate”, if any. And a major “we still don’t know, so let’s pretend it doesn’t matter” of “settled science”.
Somebody has looked at clouds from both sides, now?
I know that I know nothing
-Socrates
E’2,
Well, the optimum for humans would be to maybe cool the deserts slightly, and melt the frozen tundra to expand the range of arable land for agriculture. It appears that the latter may be happening. The Matanuska Valley in Alaska is famous for its large vegetables. Perhaps the long hours of daylight are responsible for their large size. Opening up the far North to agriculture would allow the production of larger amounts of food for humans.
The question of the optimal temperature for Earth has never been examined, to the best of my knowledge.
C.S.,
Perhaps you should investigate the defining characteristics of deserts:
http://images.fineartamerica.com/images-medium-large-5/1-a-desert-snow-day-saija-lehtonen.jpg
The Earth doesn’t have a temperature.
Is the earth made of matter?
Then it has a temp.
Is the earth made of matter?
Then it has a temp.
micro6500: What is it then? And how did you measure it?
Thermometer on my phone says 32°F?
I bet you even have a temp where you’re at. So it has a temperature.
Re John Hultquist: Geologists find that there are hot deserts and frozen deserts. The picture you post obviously shows a conflicted desert.
Well if we are talkng about Air temps…I would say optimal would be somewhere areound 72F (Im Canadian..ergo my comfort zone is likely lower than many).
Internally, having caved for many years…it 42 deg constant….upper crust of course
Some rather silly comments. The Earth has MANY temperatures. There is no way to average them in a meaningful way because all the processes in the climate are driven by energy-heat and radiation- imbalances(PV=nRT), which are not measured by temperature. You can easily have a situation where the temperature near the ground is 22C and at 50,000 ft. the temperature is -3C and there are no clouds, rain, or significant winds. What is driving that situation? The nearly complete balance of energy in the atmosphere from bottom to nearly top. Does an average temperature of 19.5C, the average temperature have any effect? No.
Having calculated enthalpy, it doesn’t matter.
The Sahara is greening, what more do you want?
The religion of Climate Science is anything but “holy”.
“Grail” on the other hand, is defined as “a cup or chalice that in medieval legend was associated with unusual powers”, but politicians worldwide have used Climate Science to their political advantage, and against the poorest among us.
“Grail” is also defined as “any greatly desired and sought-after objective; ultimate ideal or reward”. Like the Nirvana often sought by the Left but never realized, it always results in Big Government and loss of individual freedom.
http://www.dictionary.com/browse/grail
Neither definition has enhanced the human experience.
Could there be a “holy grail” of climate science yet to be discovered?
I think that you miss the point of ‘climate science’. It’s a way of pushing ones personal agenda.
CO2 bad … CO2 requires ‘’wealth redistribution’ and everything else one can imagine of other systems failed in time.
So does Willis get referenced? Humble pie time?
I bit of a teaser….
Has somebody actually figured out how to adequately model cloud cover?
Can modelling be done to a fraction of 1% accuracy? No chance for that. How do you validate a model without data to the needed accuracy?
Could be a study using actual DATA regarding cloud cover gleaned from satellite imagery and indicating a 2-3% reduction in gobal averaged cloud cover since 1968
+1
What are the error bands involved in that cloud cover data? + or – 0.25 % is needed.
± ; givews ± (without the space)
Not even close!
Best laughs… hand held calculators match super-computer models… 12:28, climate model uncertainty (error bars)… 24:25
“Cloud error is 114 times larger than the variable they are trying to detect”
Dr Patrick Frank has presented his paper to 6 Journals, has had 16 reviewers, 13 of which were modelers. The count is 13 to 3 against publication, all 13 modelers voted against it. All 13 critics were incompetent in their reviews, making basic errors in comprehension.
I’m glad the Earth doesn’t employ the same approach to climate that these so-called “climate scientists” do.
Great video. I memorized the equation and when a Warmologist needs to know how warm it will be in 2085, I’ll use my phone to get the answer. I wonder if there’s an App for that.
I have wondered if the last 150 years of temperature data will even show up on something like the Vostok ice core data far in the future? Small reductions in temperature during the Holocene were not positive for man kind, just think about what it will be like when the Holocene is over.
When the holocene ends human population on the planet will “reset” to the number who are supportable by the resulting climate — likely fewer than 100 million globally but concentrated into areas with the consistently most favorable WEATHER.
Some countries still measure sunshine hours (the UK). Canada used to. But quit.

Very interesting.
The alleged UK temperature increase also coincides with UK population growth and the popoulation’s cumulative heat generating activities.
jaycee
Thanks.
I am not sure that this correlation is causation. It might be.
But –
The UK has been having many – net – emigrants for the years from about 2008 [inflexion point – BY EYE!], yet the Annual Sunshine does not seem to have been increasing proportionately.
UHI is certainly significant locally, but even London is about 750 square miles out of 90,000 for the UK as a whole – less than one percent.
Mind – CO2 is less than one tenth of one percent globally.
Indeed, as I have remarked, more than once – to the nearest one tenth of one percent – there is zero CO2 in our atmosphere.
And yet we are to destroy our energy and economic systems on the say-so of a bunch of activists.
Not at all ‘Joined Up Government’.
Auto
U.K. Population decreased for 30 years, around 1950-1980?
It is interesting and I can’t wait to hear what next week’s news will be.
There’s good correlation between the graph and the CET temperature during the nineties. From about 1990 to 2000 CET (Central England Temperature) rose about one degree, practically in a straight line, precisely when sunshine was incrteasing. But in 2000 CET went into reverse and started to cool at about the same rate, forming an almost perfect sawtooth (although there has been a bit of a warm bump the last few years). Unfortunately the sunshine graph shows no fall after 2000, so the correlation breaks down.
Chris
The swedish SMHI has data from 1983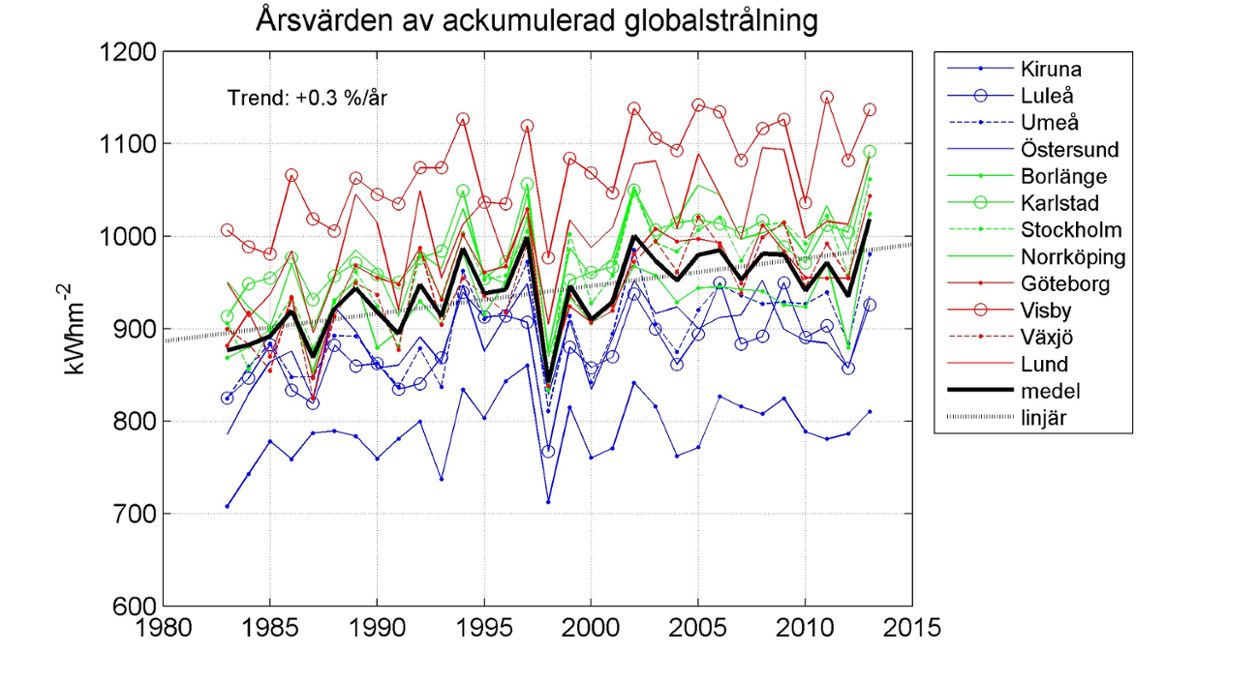
Incoming sunshine +0,3% / year
Popcorn suggested and then you want us to “settle” back? Tease. 😉
If the magnitude of causation implied is as large as claimed then CO2 will be regulated to “miscellaneous.”
Okay, if they found a good cloud model they should detect this.
This is Sensitivity to insolation for N20 to N30 lat (all Air Force surface stations with 360 days of data per year)
The big increase in the late 90 is evidence of a large increase in sensitivity, only place in >23.5 N/S Lat that has it. The warming took place in NH winter, as what I’m checking is how the day to day temp changes, and the negative peak is about Oct, and the positive peak is about March, and the change between these points is fairly linear, under weather effect.
I discuss this here https://micro6500blog.wordpress.com/2016/05/18/measuring-surface-climate-sensitivity/
I suggest this to test to see if what I found in the surface data shows up in the cloud data.
I believe it was caused by the change of state in the AMO.
Back to chart making school for you!
I accept that criticism…… I have been in battle with excel for a while. But, other than units, what is the issue? The units, are power, not rate that is assumed to be over 24 hours, which is not possible, and leads to unphysical models. But they can easily be changed, and that greatly reduces magnitude of sensitivity.
You are winning the battle. Mostly. Still, I prefer to see the ordinate labeled so I can read it at a glance. And I like to be able to see all the lines, not just three out of four. That blue on a grey background–Oy!
Another decent primer on clouds and climate are at GISS. The discussion there is accurate to what we know today on clouds.
https://isccp.giss.nasa.gov/role.html
In that above reference is this quite honest statement about clouds and models: (my bold)
That statement right there is an admissions today’s climate model outputs (and tomorrow’s as well) are junk because they do not properly model cloud processes as the occur in our actual climate.
Look for the rash of dismissal, denial, dissing, anger, pontification, etc from the warmunists.
In other words, someone struck a nerve.
So I took sunshine’s annual hours above and plotted it on top of the CET record. Remarkably similar trends.
Looks interesting. The peculiar thing is that the only real temperature measurements for most of the world are satellites, so Spencer might get heat over persons preferring the surface “records”.
So will Svensmark get the Nobel for his work on Forbush Decreases and the effect of solar magnetic variability on cloud cover/climate, plus Nir Shaviv for the theoretical side of this ?
Water vapor is the dominant effect. Even the UN IPCC models are constructed with this understanding – they just get the cause of the water vapor wrong (their hypothesis has anthropogenic CO2 as the determinant, rather than the natural solar-driven processes).
Water is a troublemaker. It can be present in the atmosphere as a vapor, as a liquid,and as a solid. Climate models on their scale of a 100 km grid are totally clueless.
BINGO. Of course it’s water in all of its states. Latent heat gains when the states change –> moving energy around. The sun directly and indirectly affects water in complex ways. It’s the sun and the water!
Yes, there’s something wrong with assuming there’s no water in the atmosphere at the start.
The albedo runs the climate. The atmosphere cools the earth, not warms it.
Gosh, hmmm, where have I seen that before?
Yes – Albedo, driven by water the sun and water!
It does both, without atmosphere the surface temperature would be ca. 270K
W/o atmos surface would be like moon – 390 K lit side 100 K dark.
Take an argon atmosphere then.
What’s argon have to do with it?
It doesn’t have absorption lines in the ir spectrum.
So what?
Things are looking up for my resurrected Jeep Grand Cherokee with a 6 litre engine. I am going to design a bumper sticker taking credit for rising crop yields and bragging about my Jeep’s ability to drink most foreigners under the table. Maybe it should be in the shape of a burning Tesla.
Nick is going to be confused again since the quote is from 2010 and not this week.
Where is Nick? (hasn’t been ’round stoking the flames of alarmism these days)…
My son recently found a copy of Dr. Roy Spencer’s “The Great Global Warming Blunder” in a thrift store in New Iberia, Louisiana. It was apparently discarded by the South Regional Library of the Lafayette Public Library, which last time I checked lists its copy as ‘In Transit.’ On the cover is attached POLISCI, (also on web catalog) but the Dewey Decimal Number given is 551.6, correct for the Library Cataloging on the Copyright Page, true also for the Library of Congress number QC.
This may be innocent error, Rush Limbaugh’s name on cover aside, but I looked at the library’s cataloging of other climate books, some of which are in the 300s, Social Sciences. This includes Silent Spring, Lomborg’s book, Gore’s books and Spencer’s Climate Confusion. Not sure what all this means, but there are problems down the street, including as I posted getting rid of the National Wetlands Research Center Library, and the possibility that the University there will allow graduation in Biology with little or no Botany.
Spencer’s Blunder book belongs in the Science section, as it has a high percentage of real references, lack of dogma and ideology, and what might be called polemics aimed at Gore, et al, are minimal. I do wish that his list of “Propaganda Methods” had been called Logical Errors. Categories here are not always easily fixed, however, but errors of logic can be taught independent of the politics of content.
Of particular interest to me was the last reference in Chapter 9, Summary and Conclusions, to a paper in Fisheries, published by the American Fisheries Society, of which I used to be a member. They became too political and controlling, but seem to be improving in their science content. The problem we have, as others here have noted, is across broad areas of academics, humanities and even engineering (check out The Bent of Tau Beta Pi ).
His reference was a quote from Lackey, R. T., “Normative Science.” Fisheries 29(2004):38-39.
“…an insidious kind of scientific corruption.” The paper is completely behind a paywall, but I know what has been going on as the fisheries corruption goes back earlier than the climate, I think, at least in some biologists losing their jobs or being transferred.
The similarity is what Spencer correctly shows in identifying causes and effects, in the fisheries case the same failure to consider natural causes, often blaming commercial fisheries. While not altogether innocent, ugly things happened, with one of the worst the destruction (some burned) of antique wooden fishing boats in the EU so they could not reenter the fisheries (P. Lockley. 2000. Decommissioning – A Failed Policy. Maritime Life and Traditions. 7:2-15.). This has not reached the level of climate either in money or exposure, and also has been receiving some correction in the fisheries literature.
It is a great book and I wonder if there was some way to adapt his clever simple model examining radiative and nonradiative feedbacks to fishery collapses. These often involve temperature, the late 70s “Climate Shift” he mentioned recognized (Hayes, M. L., J. Bonaventura, T. P. Mitchell, J. M. Prospero, E. A. Shinn, F. Van Dolah and R. T. Barber. 2001. How are climate and marine biological outbreaks functionally linked? Hydrobiologia 460:231-220).
This has already been emperically shown by Jonathan Lowe back in 2011.
See
http://gustofhotair.blogspot.co.uk/
“I’ve looked at clouds from both sides now
From up and down and still somehow
It’s cloud’s illusions I recall
I really don’t know clouds at all”
-Joni Mitchell
Always liked that song. Should be required for climate modelers.
With apologies to Ms Mitchell, I penned my own lyrics 6 years ago…
Both Sides Now
Woes and blows to warmist scares
Excise schemes now in cross hairs
And weather claxons now despair
I’ve looked at clouds that way
We all know that they block the sun
And rain and snow on everyone
So many things frauds would have done
But clouds got in their way
We’ve looked at clouds from both sides now
From cool and warm, and still somehow
Warmist delusions I recall
They really don’t know clouds at all
Loons and goons with feckless deals
Are busy advancing their ideal
And so their fairytale reveal
We’ve heard them yack away
But now it’s not supposed to snow
So we’re laughing as they eat crow
And polar bears, their numbers grow
Hint: check the Hudson bay
We’ve looked for signs of high tides now
From near and far, no rise somehow
Warmist delusions we recall
They really don’t know squat at all
Tears and fears and feeling proud
To say “It’s bullshit!” right out loud
Dreams and schemes of circus clowns
The crooks’ in disarray
This now transends just acting strange
We shake our heads, they’re so deranged
They’re data’s lost, still unexplained
United Nations way
We’ve heard their crap, their sacred cow
From kin and news and still somehow
It’s Mann’s delusions I recall
He really don’t crap at all
I’ve looked at clouds from both sides now
From cool and warm, and still somehow
Those warmists really are dirt balls
They really don’t know clouds at all
Hold the flights to France!
Let them go! Just don’t let them come back!
About a month ago, I noted that CERES was showing a sharp decrease in solar radiation reflected back to space (clouds or land or ice reflecting solar radiation or Albedo for short). This is the first time that a trend started to show up in CERES (at all really) – lower Earth Albedo.

.
I went and got the newest numbers from CERES. The decline in short-wave solar reflected is NOT in the cloud numbers, it is in the “Clear-Sky non-cloudy” conditions. So, more of the solar energy is being absorbed by either the atmosphere (non-cloud) or by the surface (water or land or ice).
This is actually a large enough drop to warm the Earth in a substantive manner.

Bill
Important to state that the systematic error in Ceres is still +/- 2.5 W so these figures are sunny-day.
W/m2 that should be
“the ‘holy grail’ of climate science”
Pardon me, but this kind of poetry just make me believe in climate science even less.
Andrew
Meh, I’m sick of popcorn. I’m investing in Fiddle Faddle futures instead.
I have some chili popcorn seasoning I’ve been saving for that special popcorn occasion. 😉
There is interesting related research and data at the Institute for Atmospheric and Climate Science of ETH Zurich, led by Martin Wild, senior scientist specializing in global dimming and brightening. In contrast to the satellite imagery, ETH is compiling changes in sunlight incident on surface sensors. An overview with links is here: https://rclutz.wordpress.com/2017/07/17/natures-sunscreen/
Dr. Wild’s money graph is this one:
Figure 2. Changes in surface solar radiation observed in regions with good station coverage during three periods.(left column) The 1950s–1980s show predominant declines (“dimming”), (middle column) the 1980s–2000 indicate partial recoveries (“brightening”) at many locations, except India, and (right column) recent developments after 2000 show mixed tendencies. Numbers denote typical literature estimates for the specified region and period in W m–2 per decade. Based on various sources as referenced in Wild (2009).
Japan temperatures 1998 ->

But is also flat from 1950 – 1990

There is a slight step up between 1990 – 998, which , iirc, is present in many Asian countries.
https://seawifs.gsfc.nasa.gov/OCEAN_PLANET/HTML/peril_oil_pollution.html
Oil smooths the surface, reduces wave action and generates fewer salt aerosols.
Now, I wonder what the result of that could be.
JF
How can there be a “Holy Grail” when “the science” is already settled ? 🙂
The “Holy Grail”of climate science is a massive annual grant in perpetuity with peer review by friends in on the scam.