Map of the Gila River watershed-drainage basin — located in New Mexico and Arizona. By Kmusser (Self-made, based on USGS data.) [CC BY-SA 2.5], via Wikimedia Commons
Guest essay by Eric Worrall
Lecturer in Physical Geography Michael Singer has noticed that climate hasn’t brought greater precipitation, as Trenberth predicted it would – but he still worries about the impact of climate change on watersheds.
How understanding regional rainstorms will help the world manage climate change
Lecturer in Physical Geography (Hydrology and Geomorphology), Cardiff University
…
There is a theory in physics that tells us that a warmer atmosphere can hold more moisture (~7% more per 1°C increase), so we might expect that places with increasing temperatures will experience more water evaporation from the land, and also experience heavier rainfall. But we don’t have great evidence of more intense rainfall for many places across the world, even though the upward temperature trends are compelling for much of the globe.
It is actually very difficult to observe trends in rainfall, because we often rely on data and model outputs that are at the wrong scales. Global rainfall datasets and output from climate models are typically resolved on timescales of days or months and at spatial scales larger than most river basins.
…
In general, scientists have had a poor understanding of how a warming climate will affect the magnitude, timing, and spatial patterns of rainfall. Yet these aspects of the climate system are fundamental to assess the sustainability of water resources and even flood risks, especially in drier parts of the globe.
…
Several years ago, I came across a rich dataset on rainstorms for a place called Walnut Gulch, a watershed – an area of land that separates waters flowing into different rivers – near the city of Tombstone in south-eastern Arizona. The US Department of Agriculture has been collecting detailed information about every single storm that occurred from 1954 until the present day at 85 separate gauging locations. We already knew temperatures had been rising here, increasing by ~2°C in a matter of decades. And this trove of rainfall data enabled us to examine whether there were trends in rainstorms that corresponded to the rising temperatures.
Map of the Gila River watershed-drainage basin — located in New Mexico and Arizona. By Kmusser (Self-made, based on USGS data.) [CC BY-SA 2.5], via Wikimedia Commons
We were surprised to find that even while total rainfall slightly increased over this period and more rainstorms occurred over time, each storm was less intense and lasted longer. This means that less rainwater has run off the landscape into rivers since the 1950s, so more of the water from the sky has returned to the atmosphere and less of it contributed to regional water resources.
In other words, the theory which predicts heavier (more intense) rainfall due to warming does not hold for this region. We believe it breaks down here and in other dry environments because there is not enough moisture in the landscape to evaporate and satisfy the higher demand of the atmosphere. Our findings also suggest that water resources in this desert region may become increasingly strained due to changes in the regional climate.
…
The rainfall study quoted by Michael Singer is a 2011 Trenberth study;
Changes in precipitation with climate change
Kevin E. Trenberth*
National Center for Atmospheric Research, Box 3000, Boulder, Colorado 80307, USA
*Email: trenbert@ucar.edu
ABSTRACT: There is a direct influence of global warming on precipitation. Increased heating leads to greater evaporation and thus surface drying, thereby increasing the intensity and duration of drought. However, the water holding capacity of air increases by about 7% per 1°C warming, which leads to increased water vapor in the atmosphere. Hence, storms, whether individual thunderstorms, extratropical rain or snow storms, or tropical cyclones, supplied with increased moisture, produce more intense precipitation events. Such events are observed to be widely occurring, even where total precipitation is decreasing: ‘it never rains but it pours!’ This increases the risk of flooding. The atmospheric and surface energy budget plays a critical role in the hydrological cycle, and also in the slower rate of change that occurs in total precipitation than total column water vapor. With modest changes in winds, patterns of precipitation do not change much, but result in dry areas becoming drier (generally throughout the subtropics) and wet areas becoming wetter, especially in the mid- to high latitudes: the ‘rich get richer and the poor get poorer’. This pattern is simulated by climate models and is projected to continue into the future. Because, with warming, more precipitation occurs as rain instead of snow and snow melts earlier, there is increased runoff and risk of flooding in early spring, but increased risk of drought in summer, especially over continental areas. However, with more precipitation per unit of upward motion in the atmosphere, i.e. ‘more bang for the buck’, atmospheric circulation weakens, causing monsoons to falter. In the tropics and subtropics, precipitation patterns are dominated by shifts as sea surface temperatures change, with El Niño a good example. The volcanic eruption of Mount Pinatubo in 1991 led to an unprecedented drop in land precipitation and runoff, and to widespread drought, as precipitation shifted from land to oceans and evaporation faltered, providing lessons for possible geoengineering. Most models simulate precipitation that occurs prematurely and too often, and with insufficient intensity, resulting in recycling that is too large and a lifetime of moisture in the atmosphere that is too short, which affects runoff and soil moisture.
Michael Singer worries that less intense but more frequent rain will reduce available runoff. But the effect of more frequent rainfall on arid regions in a lot of cases is likely to be profound. Intense one off rain events mostly drain away – parched soil often can’t absorb water until it has been soaked repeatedly by rain. But more frequent longer lasting rainfall, in many regions, should make it possible for grasslands and even trees to establish in formerly extremely arid regions. Vegetation tends to establish and protect its own soil moisture – providing there is some moisture available to protect.
These Sinecure..Retentive so-called Climate Scientists, aka Snake-Oil Salesmen and Data Mannipulators, will seize on any vestigial report of “Change” (even if it is from yesterday) to claim that AGW is a threat to humanity.
They are in cahoots with MSM media in a symbiotic relationship based on Sky..Falling Crisis from one minute to the next.
markl
December 9, 2017 5:47 pm
daveburton commented: “Longer, less-intense rainfall events would increase absorption of water by the soil, replenish groundwater, and reduce erosion, compared to the opposite trend. What’s not to like about that??”
Exactly. Common sense. (how did this same response get attached previously???? It was supposed to be a reply to the post quoted)
Perhaps instead of climastrology, we could have a look at what the result on rainfall patterns was when it was warmer in the past?
The only reason one might decide that some unreliable models might be the way to go is if one is proceeding on the fiction that it has not been warmer, much warmer, in the recent past.
We know it has been warmer.
And we have good dendrochronological records of rainfall for that area of the world.
Steve Oregon
December 9, 2017 7:30 pm
The latest Lake Powell elevation projection shows a healthy, stable and even increased level ahead.
So much for the doomsdayers who were so sure the lake was drying up. https://www.ecowatch.com/lake-powell-drought-1974067342.html
….”Further, climate change scientists have painted a bullseye on the Southwest U.S., indicating that it will get hotter and drier, with even less flow into the Colorado River. The lead investigator in the in-progress Colorado report has even said, “I haven’t shown the climate change hydrology because it just scares everybody.”
They just adjust the bullseye to wherever the bullet hits. They’re expert Marxmen… I mean Marxpersons of course.
adrian smits
December 9, 2017 9:02 pm
Question. If the planet is between 7 and 11% greener than it was in 1978 would that not mean that the extra c02 which supposedly caused this is also causing its own negative feedback because greener is cooler?
Dr. S. Jeevananda Reddy
December 9, 2017 9:03 pm
When there is no global warming to recon, how could anybody say global warming influencing the precipitation.
Meteorological department have been publishing the frequency distribution of precipitation under different rainfall ranges.
Also, natural variability in precipitation changes the precipitation pattern in the below and above the average cycles.
At all India level, 2002 and 2009 are severe drought years with 0.81 and 0.79% of the average and temperature gone up by 0.7 and 0.9 oC.
Changes in terrain modifies the rainfall pattern.
Truncated data series show the results what even you wanted. In fact this is what the inter-state river disputes tribunals are doing. To favour a state they select that period of the series and infer conclusions detrimental to other states. This is happening in the Krishna River basin. Here 114 years data series are available to the tribunal but used 47 years that is part of above rainfall period of 132 year cycle. To infer some other unethical issues used 26 years data series. In fact while doing probability estimates, one must test whether the data series follo the normal distribution and skewed distribution [positive or negative]. 114 years data series followed normal while 47 years data series followed positively skewed. Unfortunately central water commission members released a report on 26th November 2017 — followed the same path as tribunal — and used only 30 years data and found mean and 75% values abnormally high.
Dr. S. Jeevananda Reddy
Dr. S. Jeevananda Reddy
December 9, 2017 9:06 pm
To provide more clarity on the above comment of mine,see the note a part of my mail submitted to central water commission of India under ministry of water resources:
Plenty of water in Krishna: A false alarm by CWC
Indian rainfall is seasonal. To conserve water, Rajas and Maharajas built tanks, later on Krishna River: during British rule built Prakashmam Barrage (1857), K.C. Canal (1870), Sunkesula barrage, etc; Nizam Nawab built reservoirs like Rajoli Banda Barrage (1958); after Independence to India the First Prime Minister of India, Pundit Jawaharlal Nehru gave importance to dams as he considered them as modern temples and built Tungabhadra dam (1953), Nagarjunasagar Dam (1967), Bhima Dam (1980), Srisailem Dam (1981), Narayanpur Dam (1982), Jurala Dam (1995), Almatti Dam (2005), Pulichintala Dam (2013), etc. They are providing water for irrigation, drinking, industry and production of power at very low price.
The annual rainfall presents 132-year cycle with 66-years each of the below and above the average pattern of the sine curve. 66-years prior to 1935 presented below the average pattern in which 24 years received Deficit and 12 years Excess rainfall — Deficit means 110% of the average –; 66-years from 1935 to 2000 presented above the average pattern in which 24 years received Excess and 12 years Deficit rainfall. The water availability in Krishna also followed this pattern. The average along with the lowest and the highest rainfall in met sub-divisions of three riparian states are as follows:
Met Sub-division Rainfall, mm
The lowest/year The highest/year Average
Very low rainfall zone and also in rain shadow zones of the Western Ghats, namely Sangly-Bellary-Anantapur zone, more than 50% of the years experience drought.
That means the water availability is highly variable with year to year and follows a natural rhythmic pattern. To achieve sustainability in water availability to different projects, government of India appointed Bachawat Tribunal and [BT] in 1969 and in 1976 it submitted its report. As per this award still Krishna water is distributed among the three riparian states, namely Maharashtra, Karnataka and undivided Andhra Pradesh [UAP]. Later government of India appointed a second tribunal, namely Brijesh Kumar Tribunal [BKT] in 2004/06 and it submitted its report in 2013; but Supreme Court issued stay on this award implementation as it is biased towards UAP.
BT used 78 years data series [1894-95 to 1971-72] which was available to him at that time – all the three riparian states accepted the data series. In this 41 years forms poor rains and 37 years good rains of 132 year cycle. BKT used 47 years data series [1961-62 to 2007-08] though 114 years data series [1894-95 to 2007-08] were available, in which 40 years form good rains and seven years forms poor rains of 132 year cycle – UAP disagreed on using this data. Because of this the mean of BKT is more than BT by 185 tmcft. Though BKT selected 47 years data series but in reality used five different data sets to prove his unethical inferences.
BKT for permitting to raise Almatti Dam height and legalize illegal projects under Tungabhadra along with these two, more water goes as groundwater and evaporation — In the tribunal awards groundwater use is not a part of water available – KBT pronounced that UAP will get 1530 tmcft; and thus even after deducting 230 tmcft allocated to Almatti still UAP will get 1300 tmcft, which is more than 811 tmcft allocated to UAP by BT.
To show how they arrived at 1530 tmcft on an average they used 26 years data series [1981-82 to 2006-07] of Bhima-Krishna River reaching Jurala dam. This was stated to be 932 tmcft on an average. To this added 190 tmcft from Tungabhadra and 350-400 tmcft locally available in UAP. To this if we add the water allocated to Karnataka and Maharashtra it will be 3050 tmcft.
On probability curve of 47 years data series, 3050 tmcft is available at around 24%; but from the 26 years data series [which is part of 47 years data series] probability curve it is available at around 18%. The values at 75% probability and mean are around 2000 and 2400 tmcft; and the same for 47 years data series are 2173 and 2578 tmcft.
Out of the 26 values 8 are below 2000 tmcft and 5 are more than 3000 tmcft; 13 points each are on either side of 2400 tmcft [at 50% probability level] and thus they show that the data series followed normal distribution pattern; and in the 47 values, 28 are on higher side and 19 are on lower side of the mean [2578 tmcft]. It s a positively skewed distribution – because of this mean is available at 58% probability level — and thus estimates are biased. The estimates are reliable only when it follows normal distribution in which mean coincides with 50% probability level. 114 data series follow this. 75% probability means 75 years out of 100 years.
Similar to BKT, Central Water Commission (CWC) used 30 years data series [1985-86 to 2014-15] in which 16 years are in good rainfall period and 14 years are in poor rainfall period. 22 years of 26 years data series formed part of the 30 years. And yet CWC claimed plenty of water available in Krishna River. They say that 2522.52 and 3144.42 tmcft of water available respectively at 75% probability and Mean. 3144.22 tmcft at mean is nearly same as that of BKT arrived to raise the Almatti dam height [3050 tmcft]. If they are correct then more than around 1000 tmcft must enter the Sea most of the years when we look in to the capacity of the dams in UAP. It is not happening.
According CWC the highest water availability of 4165.42 tmcft was in 2010-11. However, even higher value of 4194 tmcft was recorded in1975-76. They say the lowest 1934.89 tmcft was recorded in 2002-03. According to BKT this was shown against 2004-05; and in 2002-03 and 2003-04 recorded 1239 & 1253 tmcft [the lowest observed as 1007 in 1918-19; also 1125 in 1899-1900; 1273 in 1905-06]. That means CWC showed around 700 tmcft more. How can it will be possible when rainfall, water used in Delta and water entered in to the sea are against this inference of CWC. For example:
In undivided AP out of 23 districts in 2002-03 received deficit [< 90% of the average] rainfall in 16/15 districts during the southwest/northeast monsoons — In 2002 and 2009 with severe drought conditions of 81 and 79 % of average rainfall presented a raise of 0.7 and 0.9 oC, respectively at all India level –. . It is also a fact that many years after 2001 Nagarjunasagar Dam wasn’t reached to its full capacity on many years. Also, during 2001-02 to 2005-06 water availability were 1836, 1239, 1253, 1934, 3624 tmcft and Delta received 190, 118, 84, 137 & 187 tmcft against the allocated 181.2 tmcft; and water entered the sea were respectively 111, 13, 12, 23, 1273 tmcft.
All these clearly show it is a false alarm created by CWC and as well BKT to serve the vested interests.
CWC playing game to ask the Supreme Court to lift the stay order on the tribunal order.
Dr. S. Jeevananda Reddy
Formerly Chief Technical Advisor – WMO/UN & Expert – FAO/UN
Tel. 23550480
The warmer world=wetter world (except when it isn’t) argument has always been so oversimplified as to be worse than unhelpful.
If pushed on the matter, I’m sure that even a climate scientist would admit to noticing that much of the evaporation and much of the precipitation doesn’t occur in the same place or at the same time. It is everything that happens in between that is both important and hard to predict. I think they relish the uncertainty really, because it makes it easier for them to get away with claiming whatever they like in their ignorance.
Toneb
December 10, 2017 12:01 am
“Lecturer in Physical Geography Michael Singer has noticed that climate hasn’t brought greater precipitation, as Trenberth predicted it would”
Since 1900, average annual precipitation over the U.S. has increased by roughly 5%. This increase reflects, in part, the major droughts of the 1930s and 1950s, which made the early half of the record drier. There are important regional differences. For instance, precipitation since 1991 (relative to 1901-1960) increased the most in the Northeast (8%), Midwest (9%), and southern Great Plains (8%), while much of the Southeast and Southwest had a mix of areas of increases and decreases.”
If rainfall is an indicator of climate change, perhaps the change in climate isn’t as catastrophic as they’re pretending it is.
TDBraun
December 10, 2017 5:11 am
I don’t see why rainfall in a particular spot on land would have anything to do with the temperature trends at that spot. The weather systems bringing in the rain are mostly coming from off the ocean, which is where temperature trends theoretically might have affected how much moisture the atmosphere was acquiring.
Seems like the humidity readings and sea surface temps over the Gulf of Mexico and the eastern Pacific would be what might hypothetically correlate to rainfall over the Arizona deserts.
Monsoon simply means a seasonal reversal of the wind flow, which leads to an increase in moisture and rainfall.
I think many people perceive it to mean a big storm, but that is not the actual definition of what a monsoon is.
Growing up and until the last year, I’d only heard “monsoon” in reference to places like India and Southeast Asia. “Monsoon Season” was weeks or months of rain. (Think Forrest Gump).
Never heard it reference to anywhere else. Even Wikipedia’s article (at the time I read it) said applying the term to weather patterns in North America was controversial. (Sort of like saying Siberia experienced a “Nor’Easter” or “Santa Anna” winds.)
I first heard in used in reference to the desert southwest when I was there, and saw the term being used by all of the local meteorologists on various news programs in various cities all over the region,
I have since heard it used more frequently and in other places.
For another example, look at the newest modifications to the climate classifications of Florida.
The region of the southeast Florida coast is now listed as a monsoonal climate.
It living here, I can tell you, from October to April or May or so, the predominant wind direction is from the west and northwest, and this is also called the “dry season”.
The rainy season begins at some point in the spring, and is marked by Easterly and southeasterly winds (the trade winds), increased humidity at the lower and mid levels of the atmosphere, and frequent rains, typically daily (although all spots do not get rain on all days, there are usually some showers around).
This is called by everyone “the rainy season”.
If the winds come out of the west in the rainy season, this is called a reverse flow, and the pattern of daily rain is altered, with large heavy showers in the afternoon on the east coast, and typically lighter and shorter morning rains on the west coast. More commonly, when the wind is from the east, there are more often lighter showers in the morning on the east coast, and heavy rains in the afternoon on the west coast.
These patterns repeat, day after day, year after year…although people that have never been here often never are even aware of it.
The usage is not controversial in my learning and experience. This was the textbook definition given when I took several years of classes in physical geography, meteorology, and climatology at USF in Tampa.
Although I have only recently seen the climate of Miami thus classified, it does fit the pattern.
“Tropical monsoon climates are most commonly found in South and Central America. However, there are sections of South Asia, Southeast Asia, Africa (particularly West and Central Africa), the Caribbean and North America that also feature this climate.”
The thing is, for the purpose of climate classification, a precise definition of each climate zone must be given.
Any location that then meets this definition is therefore classified according to that definition.
Since the particulars are carefully defined, areas that are on the edge of being one or the other can then shift with even slight variations in the 30 year averages.
You see, there really is and always has been climate change, as anyone who has studied these things and has a good memory has long known.
I followed your Wikipedia link for “Tropical Monsoons” and searched for just “Monsoons”.
Neither are what I had read a year or so ago. No mention of applying the term to North America as being “controversial”.
But, hey, it is Wikipedia.
Importing disastrous weather terms? 😎
(A layman’s impression.)
The funny part is, no one in Florida or the Caribbean uses the word monsoon to describe the changing rainfall patterns throughout the year. Everyone just says dry season and rainy season.
But it is classified as such according to the official definition.
And in the desert southwest, everyone uses the term to describe the summer rainy season, even though the region does not climatologically meet the official definition.
Also interesting to note that one can look up Koppen Geiger climate maps in several different sources and see various areas listed quite differently, even for the same time period (1901 to 2010 for example).
But such is settled science.
For those of a logical bent who appreciate the value of consistency, it is most unsettling!
Yes, I found the same lack of consistency.
The first thing I did was look up the word in a regular dictionary, knowing from memory what I had learned from textbooks in college, and subsequent readings.
In the first three I checked, it only referred to the southeast Asia monsoon. I suspect that this is where the word originated, and was subsequently applied to any climatic region meeting the definition that was originally defined to match those regions.
Sort of like saltine crackers or Kleenex tissues, the word had a specific origin but now has a broader assignment.
And the various wiki articles do not match up well either, with one declaring that the monsoon climate is most represented in South and Central America, and only lists Asia as an additional area with monsoons.
From the “Tropical Monsoon Climate wiki page: “Tropical monsoon climates are most commonly found in South and Central America. However, there are sections of South Asia, Southeast Asia, Africa (particularly West and Central Africa), the Caribbean and North America that also feature this climate.”
The North American Monsoon page only mentions a reversal of winds in passing, and does not define a monsoon as having that feature as being central to the definition.
If you use a source which describes the Koppen Geiger classifications, the exact definition does not mention wind at all: “Am = Tropical monsoon climate; driest month (which nearly always occurs at or soon after the “winter” solstice for that side of the equator) with precipitation less than 60 mm (2.4 in), but more than 4% the total annual precipitation.”
However, the explanation section of that classification does describe the reason for the above as being due to a change in wind direction. I am pretty sure that a seasonal reversal, or nearly so, is a more complete description. Nearly everyplace on Earth has shifting patterns of winds as the seasons progress. Even the deep tropics with nearly constant weather throughout the year have a shift in winds as the ITCZ fluctuates from north to south and back again.
But we must ignore all of that these days…the science is settled.
With the additional exception of the classification system itself…many do not find it logical of helpful to use a system that classifies the entire eastern US, from central Florida to south Texas and from Nebraska to southern New England as one climate zone. That aint settled neither.
Still looking for the ACTUAL settled stuff.
Taking a look at the way each letter in the Koppen system is defined, it is easy to see why there could be controversy and certainly changes.
“Driest month no more than 60mm but at least 4% of annual total precip”?
That is very specific, and so the map will look different depending on what 30 year period one uses (and I suppose if one uses raw or adjusted data!) and whose rain bucket gets the nod.
And the letters mostly all have the same sort of specificity. Some are even more specific and downright arcane…like the B sub-classifications.
I am wondering how they make a map with .5 degree pixels/grid size. There are not enough rain buckets and thermometer readings to do the whole world to that fineness…not even close.
Can you imagine how long the comments for this topic would be if the science was not already settled?
When I consider the number of contrary points made by the many contributors I have to wonder how any ‘consensus’ could be formed for any climate-related topic.
In case you were serious, in business studies there is a concept called the ‘comfortable clone’ syndrome whereby people hire others of like mind because they are averse to differences to the corporate ways of thinking. This is considered a BAD situation.
At least on this blog there are differences that can be debated without fear or favour (sic – Aussie spelling)
Hi, John.
No, I wasn’t serious. And, yes, I didn’t use a /sarc tag. I thought the “8-)” would commuicate the same.
(Along with “RealClimate,con.)
Sorry for any misunderstanding.
PS You said, “At least on this blog there are differences that can be debated without fear or favour”.
Absolutely correct and something to be thankful for.

These Sinecure..Retentive so-called Climate Scientists, aka Snake-Oil Salesmen and Data Mannipulators, will seize on any vestigial report of “Change” (even if it is from yesterday) to claim that AGW is a threat to humanity.
They are in cahoots with MSM media in a symbiotic relationship based on Sky..Falling Crisis from one minute to the next.
daveburton commented: “Longer, less-intense rainfall events would increase absorption of water by the soil, replenish groundwater, and reduce erosion, compared to the opposite trend. What’s not to like about that??”
Exactly. Common sense. (how did this same response get attached previously???? It was supposed to be a reply to the post quoted)
Perhaps instead of climastrology, we could have a look at what the result on rainfall patterns was when it was warmer in the past?
The only reason one might decide that some unreliable models might be the way to go is if one is proceeding on the fiction that it has not been warmer, much warmer, in the recent past.
We know it has been warmer.
And we have good dendrochronological records of rainfall for that area of the world.
The latest Lake Powell elevation projection shows a healthy, stable and even increased level ahead.
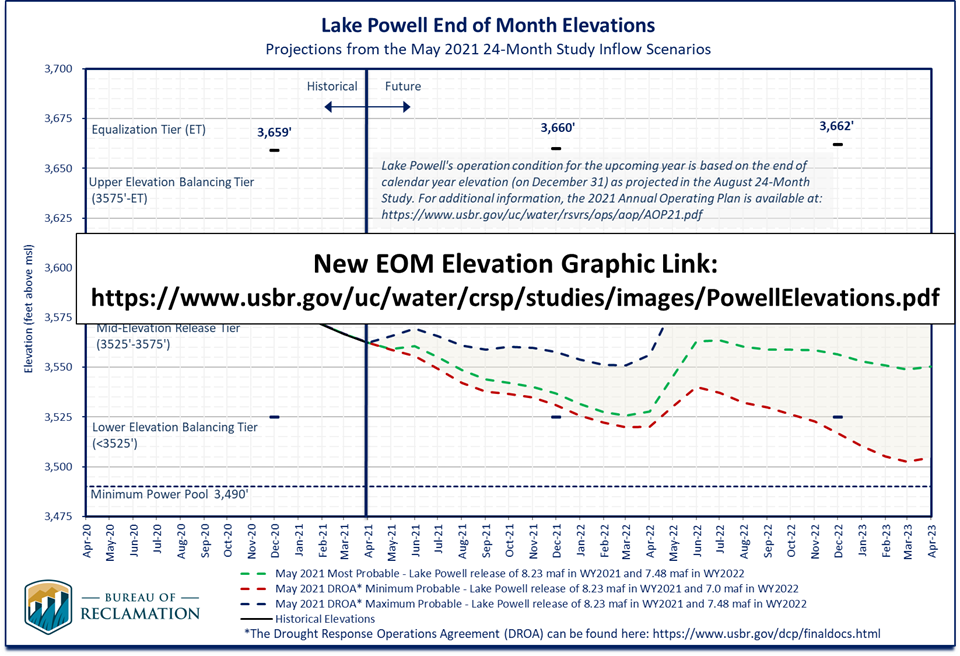
So much for the doomsdayers who were so sure the lake was drying up.
https://www.ecowatch.com/lake-powell-drought-1974067342.html
….”Further, climate change scientists have painted a bullseye on the Southwest U.S., indicating that it will get hotter and drier, with even less flow into the Colorado River. The lead investigator in the in-progress Colorado report has even said, “I haven’t shown the climate change hydrology because it just scares everybody.”
Many more:
https://www.theguardian.com/environment/2015/may/17/lake-powell-drought-colorado-river
https://projects.propublica.org/killing-the-colorado/story/lake-powell-photos
“”climate change scientists have painted a bullseye ”
Well we have seen how accurate their models are, so I’d say that SE US is pretty safe.
They can’t hit the side of a barn !!
They just adjust the bullseye to wherever the bullet hits. They’re expert Marxmen… I mean Marxpersons of course.
Question. If the planet is between 7 and 11% greener than it was in 1978 would that not mean that the extra c02 which supposedly caused this is also causing its own negative feedback because greener is cooler?
When there is no global warming to recon, how could anybody say global warming influencing the precipitation.
Meteorological department have been publishing the frequency distribution of precipitation under different rainfall ranges.
Also, natural variability in precipitation changes the precipitation pattern in the below and above the average cycles.
At all India level, 2002 and 2009 are severe drought years with 0.81 and 0.79% of the average and temperature gone up by 0.7 and 0.9 oC.
Changes in terrain modifies the rainfall pattern.
Truncated data series show the results what even you wanted. In fact this is what the inter-state river disputes tribunals are doing. To favour a state they select that period of the series and infer conclusions detrimental to other states. This is happening in the Krishna River basin. Here 114 years data series are available to the tribunal but used 47 years that is part of above rainfall period of 132 year cycle. To infer some other unethical issues used 26 years data series. In fact while doing probability estimates, one must test whether the data series follo the normal distribution and skewed distribution [positive or negative]. 114 years data series followed normal while 47 years data series followed positively skewed. Unfortunately central water commission members released a report on 26th November 2017 — followed the same path as tribunal — and used only 30 years data and found mean and 75% values abnormally high.
Dr. S. Jeevananda Reddy
To provide more clarity on the above comment of mine,see the note a part of my mail submitted to central water commission of India under ministry of water resources:
Plenty of water in Krishna: A false alarm by CWC
Indian rainfall is seasonal. To conserve water, Rajas and Maharajas built tanks, later on Krishna River: during British rule built Prakashmam Barrage (1857), K.C. Canal (1870), Sunkesula barrage, etc; Nizam Nawab built reservoirs like Rajoli Banda Barrage (1958); after Independence to India the First Prime Minister of India, Pundit Jawaharlal Nehru gave importance to dams as he considered them as modern temples and built Tungabhadra dam (1953), Nagarjunasagar Dam (1967), Bhima Dam (1980), Srisailem Dam (1981), Narayanpur Dam (1982), Jurala Dam (1995), Almatti Dam (2005), Pulichintala Dam (2013), etc. They are providing water for irrigation, drinking, industry and production of power at very low price.
The annual rainfall presents 132-year cycle with 66-years each of the below and above the average pattern of the sine curve. 66-years prior to 1935 presented below the average pattern in which 24 years received Deficit and 12 years Excess rainfall — Deficit means 110% of the average –; 66-years from 1935 to 2000 presented above the average pattern in which 24 years received Excess and 12 years Deficit rainfall. The water availability in Krishna also followed this pattern. The average along with the lowest and the highest rainfall in met sub-divisions of three riparian states are as follows:
Met Sub-division Rainfall, mm
The lowest/year The highest/year Average
Rayalaseema 225.7/1876 1228.3/1874 709
South Interior Karnataka 515.7/1876 1173.6/1882 878
North Interior Karnataka 413.5/1876 1182.1/1892 833
Madhya Maharashtra 344.9/1899 1108.2/1878 735
Marathwada 283.8/1871 1501.3/1892 833
Vidarbha 445.1/1899 1532.4/1936 1094
Very low rainfall zone and also in rain shadow zones of the Western Ghats, namely Sangly-Bellary-Anantapur zone, more than 50% of the years experience drought.
That means the water availability is highly variable with year to year and follows a natural rhythmic pattern. To achieve sustainability in water availability to different projects, government of India appointed Bachawat Tribunal and [BT] in 1969 and in 1976 it submitted its report. As per this award still Krishna water is distributed among the three riparian states, namely Maharashtra, Karnataka and undivided Andhra Pradesh [UAP]. Later government of India appointed a second tribunal, namely Brijesh Kumar Tribunal [BKT] in 2004/06 and it submitted its report in 2013; but Supreme Court issued stay on this award implementation as it is biased towards UAP.
BT used 78 years data series [1894-95 to 1971-72] which was available to him at that time – all the three riparian states accepted the data series. In this 41 years forms poor rains and 37 years good rains of 132 year cycle. BKT used 47 years data series [1961-62 to 2007-08] though 114 years data series [1894-95 to 2007-08] were available, in which 40 years form good rains and seven years forms poor rains of 132 year cycle – UAP disagreed on using this data. Because of this the mean of BKT is more than BT by 185 tmcft. Though BKT selected 47 years data series but in reality used five different data sets to prove his unethical inferences.
BKT for permitting to raise Almatti Dam height and legalize illegal projects under Tungabhadra along with these two, more water goes as groundwater and evaporation — In the tribunal awards groundwater use is not a part of water available – KBT pronounced that UAP will get 1530 tmcft; and thus even after deducting 230 tmcft allocated to Almatti still UAP will get 1300 tmcft, which is more than 811 tmcft allocated to UAP by BT.
To show how they arrived at 1530 tmcft on an average they used 26 years data series [1981-82 to 2006-07] of Bhima-Krishna River reaching Jurala dam. This was stated to be 932 tmcft on an average. To this added 190 tmcft from Tungabhadra and 350-400 tmcft locally available in UAP. To this if we add the water allocated to Karnataka and Maharashtra it will be 3050 tmcft.
On probability curve of 47 years data series, 3050 tmcft is available at around 24%; but from the 26 years data series [which is part of 47 years data series] probability curve it is available at around 18%. The values at 75% probability and mean are around 2000 and 2400 tmcft; and the same for 47 years data series are 2173 and 2578 tmcft.
Out of the 26 values 8 are below 2000 tmcft and 5 are more than 3000 tmcft; 13 points each are on either side of 2400 tmcft [at 50% probability level] and thus they show that the data series followed normal distribution pattern; and in the 47 values, 28 are on higher side and 19 are on lower side of the mean [2578 tmcft]. It s a positively skewed distribution – because of this mean is available at 58% probability level — and thus estimates are biased. The estimates are reliable only when it follows normal distribution in which mean coincides with 50% probability level. 114 data series follow this. 75% probability means 75 years out of 100 years.
Similar to BKT, Central Water Commission (CWC) used 30 years data series [1985-86 to 2014-15] in which 16 years are in good rainfall period and 14 years are in poor rainfall period. 22 years of 26 years data series formed part of the 30 years. And yet CWC claimed plenty of water available in Krishna River. They say that 2522.52 and 3144.42 tmcft of water available respectively at 75% probability and Mean. 3144.22 tmcft at mean is nearly same as that of BKT arrived to raise the Almatti dam height [3050 tmcft]. If they are correct then more than around 1000 tmcft must enter the Sea most of the years when we look in to the capacity of the dams in UAP. It is not happening.
According CWC the highest water availability of 4165.42 tmcft was in 2010-11. However, even higher value of 4194 tmcft was recorded in1975-76. They say the lowest 1934.89 tmcft was recorded in 2002-03. According to BKT this was shown against 2004-05; and in 2002-03 and 2003-04 recorded 1239 & 1253 tmcft [the lowest observed as 1007 in 1918-19; also 1125 in 1899-1900; 1273 in 1905-06]. That means CWC showed around 700 tmcft more. How can it will be possible when rainfall, water used in Delta and water entered in to the sea are against this inference of CWC. For example:
In undivided AP out of 23 districts in 2002-03 received deficit [< 90% of the average] rainfall in 16/15 districts during the southwest/northeast monsoons — In 2002 and 2009 with severe drought conditions of 81 and 79 % of average rainfall presented a raise of 0.7 and 0.9 oC, respectively at all India level –. . It is also a fact that many years after 2001 Nagarjunasagar Dam wasn’t reached to its full capacity on many years. Also, during 2001-02 to 2005-06 water availability were 1836, 1239, 1253, 1934, 3624 tmcft and Delta received 190, 118, 84, 137 & 187 tmcft against the allocated 181.2 tmcft; and water entered the sea were respectively 111, 13, 12, 23, 1273 tmcft.
All these clearly show it is a false alarm created by CWC and as well BKT to serve the vested interests.
CWC playing game to ask the Supreme Court to lift the stay order on the tribunal order.
Dr. S. Jeevananda Reddy
Formerly Chief Technical Advisor – WMO/UN & Expert – FAO/UN
Tel. 23550480
The warmer world=wetter world (except when it isn’t) argument has always been so oversimplified as to be worse than unhelpful.
If pushed on the matter, I’m sure that even a climate scientist would admit to noticing that much of the evaporation and much of the precipitation doesn’t occur in the same place or at the same time. It is everything that happens in between that is both important and hard to predict. I think they relish the uncertainty really, because it makes it easier for them to get away with claiming whatever they like in their ignorance.
“Lecturer in Physical Geography Michael Singer has noticed that climate hasn’t brought greater precipitation, as Trenberth predicted it would”
https://nca2014.globalchange.gov/report/our-changing-climate/precipitation-change
“U.S. Precipitation Change
Since 1900, average annual precipitation over the U.S. has increased by roughly 5%. This increase reflects, in part, the major droughts of the 1930s and 1950s, which made the early half of the record drier. There are important regional differences. For instance, precipitation since 1991 (relative to 1901-1960) increased the most in the Northeast (8%), Midwest (9%), and southern Great Plains (8%), while much of the Southeast and Southwest had a mix of areas of increases and decreases.”
If rainfall is an indicator of climate change, perhaps the change in climate isn’t as catastrophic as they’re pretending it is.
I don’t see why rainfall in a particular spot on land would have anything to do with the temperature trends at that spot. The weather systems bringing in the rain are mostly coming from off the ocean, which is where temperature trends theoretically might have affected how much moisture the atmosphere was acquiring.
Seems like the humidity readings and sea surface temps over the Gulf of Mexico and the eastern Pacific would be what might hypothetically correlate to rainfall over the Arizona deserts.
I would think that rainfall in a desert would only be a problem if you forgot your umbrella. … or if you want it to remain a desert.
PS I thought we now had “monsoons” in that area? Aren’t monsoons intense?
Monsoon simply means a seasonal reversal of the wind flow, which leads to an increase in moisture and rainfall.
I think many people perceive it to mean a big storm, but that is not the actual definition of what a monsoon is.
Growing up and until the last year, I’d only heard “monsoon” in reference to places like India and Southeast Asia. “Monsoon Season” was weeks or months of rain. (Think Forrest Gump).
Never heard it reference to anywhere else. Even Wikipedia’s article (at the time I read it) said applying the term to weather patterns in North America was controversial. (Sort of like saying Siberia experienced a “Nor’Easter” or “Santa Anna” winds.)
I first heard in used in reference to the desert southwest when I was there, and saw the term being used by all of the local meteorologists on various news programs in various cities all over the region,
I have since heard it used more frequently and in other places.
For another example, look at the newest modifications to the climate classifications of Florida.
The region of the southeast Florida coast is now listed as a monsoonal climate.
It living here, I can tell you, from October to April or May or so, the predominant wind direction is from the west and northwest, and this is also called the “dry season”.
The rainy season begins at some point in the spring, and is marked by Easterly and southeasterly winds (the trade winds), increased humidity at the lower and mid levels of the atmosphere, and frequent rains, typically daily (although all spots do not get rain on all days, there are usually some showers around).
This is called by everyone “the rainy season”.
If the winds come out of the west in the rainy season, this is called a reverse flow, and the pattern of daily rain is altered, with large heavy showers in the afternoon on the east coast, and typically lighter and shorter morning rains on the west coast. More commonly, when the wind is from the east, there are more often lighter showers in the morning on the east coast, and heavy rains in the afternoon on the west coast.
These patterns repeat, day after day, year after year…although people that have never been here often never are even aware of it.
The usage is not controversial in my learning and experience. This was the textbook definition given when I took several years of classes in physical geography, meteorology, and climatology at USF in Tampa.
Although I have only recently seen the climate of Miami thus classified, it does fit the pattern.
“Tropical monsoon climates are most commonly found in South and Central America. However, there are sections of South Asia, Southeast Asia, Africa (particularly West and Central Africa), the Caribbean and North America that also feature this climate.”
https://en.wikipedia.org/wiki/Tropical_monsoon_climate
http://www.livescience.com/images/i/000/045/354/original/400x266_07120845_typical-summer-monsoon-usa.jpg?1342133906
https://en.wikipedia.org/wiki/North_American_Monsoon
http://hanschen.org/koppen/img/koppen_all_1901-2010.png
The thing is, for the purpose of climate classification, a precise definition of each climate zone must be given.
Any location that then meets this definition is therefore classified according to that definition.
Since the particulars are carefully defined, areas that are on the edge of being one or the other can then shift with even slight variations in the 30 year averages.
You see, there really is and always has been climate change, as anyone who has studied these things and has a good memory has long known.
I followed your Wikipedia link for “Tropical Monsoons” and searched for just “Monsoons”.
Neither are what I had read a year or so ago. No mention of applying the term to North America as being “controversial”.
But, hey, it is Wikipedia.
Importing disastrous weather terms? 😎
(A layman’s impression.)
The funny part is, no one in Florida or the Caribbean uses the word monsoon to describe the changing rainfall patterns throughout the year. Everyone just says dry season and rainy season.
But it is classified as such according to the official definition.
And in the desert southwest, everyone uses the term to describe the summer rainy season, even though the region does not climatologically meet the official definition.
Also interesting to note that one can look up Koppen Geiger climate maps in several different sources and see various areas listed quite differently, even for the same time period (1901 to 2010 for example).
But such is settled science.
For those of a logical bent who appreciate the value of consistency, it is most unsettling!
Yes, I found the same lack of consistency.
The first thing I did was look up the word in a regular dictionary, knowing from memory what I had learned from textbooks in college, and subsequent readings.
In the first three I checked, it only referred to the southeast Asia monsoon. I suspect that this is where the word originated, and was subsequently applied to any climatic region meeting the definition that was originally defined to match those regions.
Sort of like saltine crackers or Kleenex tissues, the word had a specific origin but now has a broader assignment.
And the various wiki articles do not match up well either, with one declaring that the monsoon climate is most represented in South and Central America, and only lists Asia as an additional area with monsoons.
From the “Tropical Monsoon Climate wiki page: “Tropical monsoon climates are most commonly found in South and Central America. However, there are sections of South Asia, Southeast Asia, Africa (particularly West and Central Africa), the Caribbean and North America that also feature this climate.”
The North American Monsoon page only mentions a reversal of winds in passing, and does not define a monsoon as having that feature as being central to the definition.
If you use a source which describes the Koppen Geiger classifications, the exact definition does not mention wind at all: “Am = Tropical monsoon climate; driest month (which nearly always occurs at or soon after the “winter” solstice for that side of the equator) with precipitation less than 60 mm (2.4 in), but more than 4% the total annual precipitation.”
However, the explanation section of that classification does describe the reason for the above as being due to a change in wind direction. I am pretty sure that a seasonal reversal, or nearly so, is a more complete description. Nearly everyplace on Earth has shifting patterns of winds as the seasons progress. Even the deep tropics with nearly constant weather throughout the year have a shift in winds as the ITCZ fluctuates from north to south and back again.
But we must ignore all of that these days…the science is settled.
With the additional exception of the classification system itself…many do not find it logical of helpful to use a system that classifies the entire eastern US, from central Florida to south Texas and from Nebraska to southern New England as one climate zone. That aint settled neither.
Still looking for the ACTUAL settled stuff.
…or helpful…
Sorry.
Taking a look at the way each letter in the Koppen system is defined, it is easy to see why there could be controversy and certainly changes.
“Driest month no more than 60mm but at least 4% of annual total precip”?
That is very specific, and so the map will look different depending on what 30 year period one uses (and I suppose if one uses raw or adjusted data!) and whose rain bucket gets the nod.
And the letters mostly all have the same sort of specificity. Some are even more specific and downright arcane…like the B sub-classifications.
I am wondering how they make a map with .5 degree pixels/grid size. There are not enough rain buckets and thermometer readings to do the whole world to that fineness…not even close.
Can you imagine how long the comments for this topic would be if the science was not already settled?
When I consider the number of contrary points made by the many contributors I have to wonder how any ‘consensus’ could be formed for any climate-related topic.
That’s because all the “Genuine Climate Scientist” are over at RealClimate,con. 😎
You forgot the tag
In case you were serious, in business studies there is a concept called the ‘comfortable clone’ syndrome whereby people hire others of like mind because they are averse to differences to the corporate ways of thinking. This is considered a BAD situation.
At least on this blog there are differences that can be debated without fear or favour (sic – Aussie spelling)
Hi, John.
No, I wasn’t serious. And, yes, I didn’t use a /sarc tag. I thought the “8-)” would commuicate the same.
(Along with “RealClimate,con.)
Sorry for any misunderstanding.
PS You said, “At least on this blog there are differences that can be debated without fear or favour”.
Absolutely correct and something to be thankful for.