High altitude instrumentation balloon measurements show an increase in cosmic rays since 2015
Since the spring of 2015, NASA’s Spaceweather.com and the students of Earth to Sky Calculus have been flying balloons to the stratosphere over California to measure cosmic rays. Soon after our monitoring program began, we quickly realized that radiation levels are increasing. Why? The main reason is the solar cycle. In recent years, sunspot counts have plummeted as the sun’s magnetic field weakens. This has allowed more cosmic rays from deep space to penetrate the solar system. As 2017 winds down, our latest measurements show the radiation increase continuing apace–with an interesting exception, circled in yellow:

In Sept. 2017, the quiet sun surprised space weather forecasters with a sudden outburst of explosive activity. On Sept. 3rd, a huge sunspot appeared. In the week that followed, it unleashed the strongest solar flare in more than a decade (X9-class), hurled a powerful CME toward Earth, and sparked a severe geomagnetic storm (G4-class) with Northern Lights appearing as far south as Arkansas. During the storm we quickened the pace of balloon launches and found radiation dropping to levels we hadn’t seen since 2015. The flurry of solar flares and CMEs actually pushed some cosmic rays away from Earth.
Interestingly, after the sun’s outburst, radiation levels in the stratosphere took more than 2 months to fully rebound. Now they are back on track, increasing steadily as the quiet sun resumes its progress toward Solar Minimum. The solar cycle is not expected to hit rock bottom until 2019 or 2020, so cosmic rays should continue to increase, significantly, in the months and years ahead. Stay tuned for updates as our balloons continue to fly.
Technical note: The radiation sensors onboard our helium balloons detect X-rays and gamma-rays in the energy range 10 keV to 20 MeV. These energies, which span the range of medical X-ray machines and airport security scanners, trace secondary cosmic rays, the spray of debris created when primary cosmic rays from deep space hit the top of Earth’s atmosphere.
The data points in the graph above correspond to the peak of the Reneger-Pfotzer maximum, which lies about 67,000 feet above central California. When cosmic rays crash into Earth’s atmosphere, they produce a spray of secondary particles that is most intense at the entrance to the stratosphere. Physicists Eric Reneger and Georg Pfotzer discovered the maximum using balloons in the 1930s and it is what we are measuring today.
Source: NASA’s spaceweather.com
So the the AMO influence was caused by co2 from the past in order to make the direct causation line of co2 work now in a short term temp chart by Leif. Science by omission is not science. It’s an undergrad pitfall that needs guidance and correction by academic advisors.
.
My thinking is that if the sun’s polar magnetic field strengths goes lower, you will have more of the most energetic radiation being able to escape from the sun. Luckily, our atmosphere is protecting us by forming [more] ozone, HxOx and NxOx. In its turn, these substances then deflect [more] UV from earth so that less UV goes into the oceans.
Prepare for some global cooling coming up…..
If we get the same increase in minimum sea ice extent during this solar minimum as we got during and after the last solar minimum it is going to be difficult to claim that it is just a coincidence, the AMO is likely correlated to solar radiation.
The weak Sun is the creator and sustainer of every atom, life and planet in the solar system: https://arxiv.org/abs/1102.1499
No, cosmic rays from outside the solar system [and even an asteroid] regularly penetrate to the inner part of the System, e.g. to the Earth, where 30 cosmic rays hit your body very second.
Steven Mosher December 7, 2017 at 7:58 pm
Hey, Steven, good to see you. Are you ever going to answer my question about the sawtooth wave and the scalpel method? I’ve been asking for a couple of years now, over and over, with no answer, but hey, I’m a patient man, I’ll keep asking …
Because so far all I’ve gotten from you are unicorns … well, actually, not even that much …
w.
Touche’ Willis…
In reading my comments, Willis and Leif: I hope I was not snippy. You’re two brilliant people, and I’m always honored that you take the time to spar. My respect for you is high.
Can’t speak for Leif, but for me, your posts struck me as honest attempts to present your case, and honest questions. No problems for me.
Thanks,
w.
I appreciate your comment. Thank you Willis.
I second Willis. But again note that if an effect is invisible, I, at least, would not worry too much about it.
Leif: Agreed… Let the people who “worry much about it” find it. I just say, if they can find it, we learn something. I just am a skeptic, not a denier… so go find it… and I am willing to read their fodder.
JimG1 December 6, 2017 at 7:26 pm
9. It is apparent that CO2 is not the driving force behind climate, since there is poor correlation between CO2 and temperature for the last 20 years and over geologic time periods. More likely the oceans on our 70% water covered world, which absorb heat energy from the sun (for which we have some data), and geothermal energy (for which we have virtually no data), and release it over long periods of time by poorly understood mechanisms that are possibly the real driving force behind climate. These mechanisms are, evidently, not quantified in the climate models. Could enso events be a clue? And yes correlation is not necessarily causation and I understand the weaknesses in many of the proxies used for geologic data.
——————————————————-
Thanks for reminding us all of the real elephant in the room, that CO2 pushers seem to keep ignoring.
Maybe they are afraid of an expanding and contracting outer liquid core within the Earth. Or maybe they are afraid of the amount of CO2 emitted by the oceans because of volcanic eruptions.
There are those that are actively working on the Geothermal heating problem.
“Hillier & Watts (2007) surveyed 201,055 submarine volcanoes estimating that a total of 3,477,403 submarine volcanoes exist worldwide. According to the observations of Batiza (1982), we may infer that at least 4% of seamounts are active volcanoes. We can expect a higher percentage in the case of the count taken by Hillier & Watts (2007) because it includes smaller, younger seamounts; a higher proportion of which will be active. Nevertheless, in the spirit of caution and based on our minimum inference of 4% seamount activity from Batiza’s observations, I estimate 139,096 active submarine volcanoes worldwide. If we are to assume, in the absence of other emission figures for mid oceanic plate volcanoes, that Kilauea is a typical mid oceanic plate volcano with a typical mid oceanic emission of 870 KtCpa (Kerrick, 2001), then we might estimate a total submarine volcanogenic CO2 output of 121 GtCpa. Even if we assume, as Kerrick (2001) and Gerlach (1991) did, that we’ve only noticed the most significant outgassing and curb our estimate accordingly, we still have 24.2 GtCpa of submarine volcanic origin.”
http://principia-scientific.org/volcanic-carbon-dioxide.html/
By WILLIAM J. BROAD JAN. 12, 2016
“”Picture a volcano. Now imagine that its main vent extends in a line. Now imagine that this line is so long that it runs for more than 40,000 miles through the dark recesses of all the world’s oceans, girding the globe like the seams of a baseball.
Welcome to one of the planet’s most obscure but important features, known rather prosaically as the midocean ridges. Though long enough to circle the moon more than six times, they receive little notice because they lie hidden in pitch darkness.””
http://www.nytimes.com/2016/01/12/science/midocean-ridges-volcano-underwater.html?_r=0
“”A main question is to what extent the volcanism changes over time. The old idea was that the eruptions of oozing lava and related activity occurred at fairly steady rates. Now, studies hint at the existence of outbursts large enough to influence not only the character of the global sea but the planet’s temperature.
Experts believe the activity may carry major repercussions because the oceanic ridges account for some 70 percent of the planet’s volcanic eruptions. By definition, that makes them enormous sources of heat and exotic minerals as well as such everyday gases as carbon dioxide, which all volcanoes emit.””
The Correlation of Seismic Activity and Recent Global Warming
One geophysical variable that has been overlooked by both groups is geothermal flux. This study will show that increasing seismic activity for the globe’s high geothermal flux areas (HGFA), an indicator of increasing geothermal forcing, is highly correlated with average global temperatures from 1979 to 2015 (r = 0.785). By comparison, the correlation between carbon dioxide loading and global temperatures for the same period is lower (r = 0.739). Multiple regression indicates that HGFA seismicity is a significant predictor of global temperatures (P 0.1). A compelling case for geothermal forcing lies in the fact that 1) geothermal heat can trigger thermobaric convection and strengthen oceanic overturning, important mechanisms for transferring ocean heat to the overlying atmosphere, and 2) seismic activity is the leading indicator, while global temperature is the laggard.
https://www.omicsonline.org/open-access/the-correlation-of-seismic-activity-and-recent-global-warming-2157-7617-1000345.php?aid=72728
Could it be that the expansions and contractions within Earth’s liquid outer core are following the 100 year (50 yr. rising/50yr falling) solar cycle? P.S. Dr. S., don’t answer that, was just pondering out loud.lol
The mantle rotation pole position. A solar component
July–August 2017
Handled by Vincent Courtillot
“”…we uncover two more components, with smaller amplitude than the three first ones, but well identified, periodic with periods of 11 and 5.5 years, respectively, undoubtedly linked to solar activity. We interpret them tentatively as the result of an exchange of kinetic angular momentum between the atmosphere, in which a flow would be generated by solar activity, and the mantle. The order of magnitude of the required mean winds in the atmosphere computed in the frame of a schematic model is 1 ms−1, compatible with the observed values of the meridional mean circulation..”””
https://www.sciencedirect.com/science/article/pii/S1631071317300652
The Correlation of North Magnetic Dip Pole Motion and Seismic Activity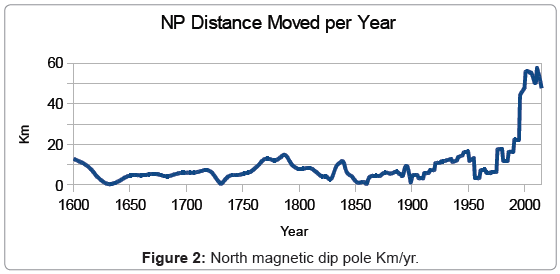
Williams B*
Retired, Gillette, Wyoming, United States
In the above image I don’t think that CO2 or GCR are what done that….
“We interpret them tentatively as the result of an exchange of
kinetic angular momentum between the atmosphere, in which a flow would be generated by solar activity,
and the mantle.”
Carla,
Thank you for the information. Since there are only two sources of energy on our home planet, solar and geothermal, it makes sense that they are intrinsic to the modulation of our climate. Given Leif’s often noted limits on the direct potential effects of solar, which I do not doubt, this does not obviate the potential for solar effects to be “stored and released” over time periods and by mechanisms which we are yet to understand. The obvious store house is the ocean. The geothermal is, of course, the other mostly unknown.
Regards,
JimG1
JimG1
true
if I had the time and the money,
I would really like to know the relationship of the position of earth’s inner core [as apparent from the position of earth’s magnetic north and south pole] and the W/m2 that comes from earth’s inside to the top.
Namely, my investigations showed no warming in the SH over the past 40 years, on average.
Almost all warming took place in the NH.
That should get some alarm bells ringing?
{if the warming is not global it cannot be the CO2 that is doing it!}
Earthling 2
Solar irradiation and the position of earth inner core (geothermal effects) both depend on solar cycles.
We have (years in brackets)
Schwabe (11), Hale (22), Gleissberg (87), Devries / Suess (210), Eddy (1000) and DeBRay (2400)
Like yourself, I also discovered a relationship between the position of Uranus and Saturn, shown here:
http://oi64.tinypic.com/5yxjyu.jpg
I am just not sure yet if the correlation is caused by the position of the planets [gravitationally ] forcing a change in the sun’s solar polar magnetic fields or if it is just the other way around.
don’t bother too much on SSN, rather look at the solar polar magnetic field strengths. Looking from 1972, note that you can draw a binomial from bottom to top (S)and from top to bottom (N) representing the average field strength. (Lowest point was 2014.)
HenryP: Good evening. I saw your post re: Uranus and Saturn that suggests cooling and warming. Do I understand correctly that the earth show have been cooling starting in 2008? The Satellite record shows that from 2008, we’ve warmed 1 degree kelvin. So perhaps I misunderstand. PS, I read your posts with great interest.
Hi Mario
According to me, on a sample of weather stations, balanced to zero latitude, I get that earth started cooling down around the change of the new millennium.
But it is not by much….
https://wattsupwiththat.com/2017/11/30/a-must-read-a-veneer-of-certainty-stoking-climate-alarm/comment-page-1/#comment-2685930
sorry@Earthling2
I forgot to add the relevant graph
http://www.leif.org/research/Solar-Polar-Fields-1966-now.png
The decision on 24 OCT 1945to unite nations and national Academies of Sciences in order to save the world from future nuclear wars after Huroshima and Nagasaki were destroyed on 6 & 9 AUG 1945, in fact destroyed the integrity of science worldwide and prevented understanding of the causes of climate variations. The so-called “Galactic Cosmic Rays” probably come directly from the Sun’s pulsar core, and were recorded as a gradient in cosmic ray exposures of meteorites at the birth of the solar system: iron meteorites > stone meteorites > carbonaceous chondrites
Just a very simple idea, but something I have been commenting on to LIA people for a while. There were 200 years of solar mins, an enhanced period then another min that brought us into the 1800s. If one wishes to opine that the solar activity of the sun is a primary driver, then think about this. The enhanced sunspot activity of the last 200 years may have contributed to the oceans warming and have some influence on the MOC. Where would 200 years of that be stored? Now what is the known effect of decreased radiation over the tropics. Take the extreme event, a volcano like Pinatubo. There was cooling, but then an el nino response and overall a general warm period in the tropical Pacific that ended with the Super Nino and the earths temps reaching a peak. My point. The oceans may have stored energy from the positive sunspot cycle. Decreased incoming radiation may lead to more warm ensos and the first response is warming. In addition, the warming we see is hugely disproportionate, mainly where it is driest and coldest since the increase in water vapor if you look at your mixing ratios will affect where temps are lowest first. A look at the DMI site reveal no summer warming, but winter warming in the arctic, I would venture to say that the warming between the arctic and antarctic circles is far less than warming north and south of it. This, in turn, would have to have an effect on MSLP patterns and the GWO. My guess is that the response is showing in the heavier early season snows in Siberia ( yes its warmer but not warm enough) and Greenland now. Interestingly enough, when I was 8 years old, my dad gave me a book , I believe the name was Why the Weather? that described that warming in the arctic would lead to more snow ( more water vapor, and though warmer, not warm enough so it would not snow,but instead snow more ) later springs and the reversal of the very pattern that was warming, Such things take decades and centuries. But my point is the first response of lower solar may be warming, due to the warmth that may be stored from the higher solar and the release and distribution into the atmosphere where it makes the biggest difference where its cold and dry. In the end, the antics of the ocean and WV, which may indeed have the sun as the conductor, far outweigh that of co2 though an underlying signal may be there, which given the way temperatures bounce up and down in response to the enso, may be no greater than noise Peace out
Joe Bastardi: Great explanation! It makes sense that the cold/dry air has less heat capacity, and so is most prone to warming. As well, heat being stored and released in longer time cycles due to the ocean cycles. The ring leader seems to be the sun, somehow. Latent Heat energy also stores heat so that in fact the stored energy does not raise the temperature of the higher state of the water, but in stead releases it when it condenses. So temperature alone does not tell the whole story.
but in stead releases it when it condenses
On the timescale of climate all that water vapor eventually condenses so the temperature will reflect that properly, making the temperature the one and only story.
Well, OK Leif. You are perfectly consistent and clear.
I am not suggesting that the water will never condense. It’s a question of when. I doubt that we can see a signal in neat 11 year cycles due to so many other confluencing factors.
Integrals with varying factors sometimes 2 and then varying them reveals some correlation. Yes – you can make an elephant’s tail wiggle with enough variables… but it does not take much to show an integral relationship to the sun and so called average earth temperature! But again, in nature which so complex there is no 1 secret factor that one can be used to see through the complexity.
In short there are difficult to predict volcano eruptions, varying ocean circulation, clouds and more clouds, a varying sun (both TSI and larger frequency deltas), changing vegetation albedo, atmospheric albedo including 03, earth’s position and orientation and more including cosmic rays. They (and many more) all have some effect… and unfortunately, they don’t all happen in 11 year cycles. As well our decent records do not all have the same quality over time.
I do not claim to be able to identify and then pretend to tell you that I “know” how to find the “unicorn” as Moser says it :). I do say that tracking ONLY the temperature “as an average”… and then making strong determinations that there is proof that the sun’s TSI did not do it, is woefully lacking. At least in convincing me the sun could not have played a role.
PS – I am a process and machine control engineer. I work mostly as a sales engineer, but still am active in controls projects and control design of many different processes. I am humbled with how much I know I do not know… I am further humbled by brilliant people such as you and Willis. There are things most brilliant people have not figured out yet. But I am hopeful!
the sun could not have played a role
The Sun does play a role to the tune of 0.07 degrees over the cycle.
“The Sun does play a role to the tune of 0.07 degrees over the cycle.” I take your word for it and have no doubt that based on TSI and a static albedo. There are other things I’ve mentioned, that certainly have an affect on albedo.
My Bearded dragon changes albedo based on radiation exposure.The same TSI calculation used to derive the 0.07 degrees would clearly give the wrong answer on the average temperature of my lizard.
I am not suggesting that the water will never condense. It’s a question of when.
The residence time of water vapor in the atmosphere is nine days….
Leif: “Residence time is 9 days” This statement is not in contradiction to my point. If the “humidity of the earth” changes, so does the resulting temperature given an energy input since energy takes a latent form. That is my point. A warmer earth is supposed to be more humid, thus resisting temperature increase.
What it mean is that whatever heat goes into humidity is released to the atmosphere in nine days. As simple as that.
Leif: “What it mean is that whatever heat goes into humidity is released to the atmosphere in nine days. As simple as that.”
That’s a good fact to keep in my pocket. Must be an average… as I know heat can be released much quicker than that.. like almost immediately. Right? Anyway, my point is not changed by this… which is a calculated number based on some average I assume. if ave humidity increases… that is due to more latent heat being trapped, this preventing temperature increase.
The 9 days is a global average. What it means is that whatever goes into latent heat is released in 9 days on average and therefore immediately [from a climate viewpoint] increases the temperature. The energy we get from the sun must be radiated away [at infrared wavelengths], i.e. at a higher temperature if the incoming solar energy increases.
Leif: Thank you. Makes sense. I think, if (on average) the humidity goes up, then the net amount of stored energy increases. It does not matter that it is released in 9 days, what matters is the more energy is being kept away from where it can increase temperature. As the earth cools, and humidity decreases, the latent heat will resist temperature drops.
But all that happens on time scales of days, so is irrelevant for the climate. The temperature is still the relevant parameter for the balance between incoming and outgoing [which are equal] energy. This is why ‘global warming’ is expressed as temperature changes.
Leif: you wrote “But all that happens on time scales of days, so is irrelevant for the climate. The temperature is still the relevant parameter for the balance between incoming and outgoing [which are equal] energy. This is why ‘global warming’ is expressed as temperature changes.
I submit that temperature is a function of energy but certainly not = energy, as you posited. You treat humidity as constant, whereas I state that it is not constant.
My argument is that a warming earth suggests humidity increases. Your statement does not consider where all of the heat is consumed by increases in humidity.
I define delta humidity as not constant. You’re correct only if your statement is that there is no increase in humidity, or again it’s constant.
Could it be that we are both technically correct given precision of our statements?
temperature is a function of energy but certainly not = energy
Temperature is a measure of the average internal kinetic energy of matter and also a [non-linear] measure of the radiant energy emitted by a body. So temperature is a measure of energy.
“So temperature is a measure of energy.”
No… you cannot tell how much energy is there without knowing the mass. So, no temperature is not measure of energy. Just tell me I am right!
The Stefan-Boltzman law https://en.wikipedia.org/wiki/Stefan%E2%80%93Boltzmann_law does not involve any mass.
“The Stefan–Boltzmann law states that the total energy radiated per unit surface area of a black body across all wavelengths per unit time (also known as the black-body radiant emittance or radiant exitance) is directly proportional to the fourth power of the black body’s thermodynamic temperature”.
The kinetic theory of gases https://en.wikipedia.org/wiki/Kinetic_theory_of_gases states
“The temperature of an ideal monatomic gas is proportional to the average kinetic energy of its atoms”.
Again no mass is involved. If two bodies have the same average kinetic energy of their atoms, the will have the same temperature no matter how large [i.e. how much mass] the bodies are.
So, you are not right.
Hoe long shall we continue this silly charade?
“So, you are not right. Hoe long shall we continue this silly charade?”
Leif: Saying the temperature of a body, tells you how much energy is emitted is NOT the same as saying how much energy is contained in the body, which also has some unknown mass. Those are two different things with completely different units.
You can not say, the temperature of something equal’s its energy. You change the words “it’s energy” to “emitted kinetic energy.” That’s a bait and switch argument.
You can say something about energy emitted… but that is not the same statement as energy contained.
Dry air at x temperature has less energy than moist air at x temperature. Are you saying that statement is incorrect?
You also need the mass to determine the total energy (not just kinetic but also potential energy)!
how much energy is contained in the body, which also has some unknown mass.
Since the mass of the atmosphere [and the oceans and the soil] is constant, the mass [which is known] doesn’t matter. The temperature is determined by the incoming energy flux from the Sun [ignoring the tiny (constant) flux from the interior of the Earth]. Whatever goes into latent heat is released as sensible heat in a few days, so global humidity is not important [and eventually depends on the temperature anyway].
Leif: You’re saying a completely different thing than I am saying.
You’re now stuck on “emitted black body energy” to win an argument. But you do not address my statement even closely. Yes of course temperature tells you energy “emitted”. But it tells you nothing about potential or stored energy.
A humid 30C degree area “emits” the same energy as a dry area air at 30C. The humid area contains significantly more energy! And so no, temperature certainly does not tell you how much energy the mass contains. It cannot.
Why is this is charade?
Finally, the point is, if the earth got generally more humid, your climate = temperature statement could not distinguish between the two earths. It assumes it does not matter. And it does matter. Your statement calls them = in terms of climate. That is a woefully incorrect conclusion.
True.. I agree with you, Mario.
Thank you HenryP and Leif:
Leif: I’m trying to keep consistent here. I trust my redirection is not snippy.
Leif, you assert that the moisture of the air is some static average so you can make your statement true. I submit that is a false assumption, which leads to the circular argument that temperature tells the [whole] story, which it does not.
On that basis, looking only at emitted radiation of earth [without knowing the state of its constituents] tells one nothing about the total energy of the earth or any body.
Dang – I am getting a free lesson from Leif and people like you… and so feel honored!
On that basis, looking only at emitted radiation of earth [without knowing the state of its constituents] tells one nothing about the total energy of the earth or any body.
Be careful. The total energy of any body of mass m is E = mc^2 + much much smaller kinetic and chemical energy + potential energy (e.g. depending on the body’s position relative to other bodies) .
What is important for the climate [e.g. for plants and their growing season] is the temperature. That is why we go to great lengths to measure it
Thank you Leif!
I as well think we need to measure temperature. Temperature is “one” of several vitally important metrics to climate. It cannot tell the whole story of climate, as we both agree. The daunting task of measuring the earth’s mass balance of energy is NOT what I’m concerned with vis a vis climate. It’s that thin layer from the surface to the sky in which we live that matters.
Small changes in moisture have dramatic effects on climate. Moisture level dynamic and absolutely not an average or constant. Rather, it swings wildly as climate changes. So assuming it’s constant just gets into circular arguments. I recall in engineering “assume a perfectly frictionless body” That works until friction matters… On Earth, moisture matters!
Small changes in moisture have dramatic effects on climate
But is driven by the temperature resulting from radiative balance. So the relevant parameter to plot and to consider is simply the temperature, which then is the whole story.
As should be obvious, the global humidity varies just like the temperature:
http://www.leif.org/research/Global-Humidity.png
from https://www.climate.gov/news-features/understanding-climate/2012-state-climate-humidity
Thank you again Leif… That’s why they pay you the big bucks (I hope)! Thank you for the lessons… which you’ve allowed me to painstakingly question. There’s a ton of latent heat in all that moisture, which should buffer any cooling that might or might not happen. You’re a patient man.
There’s a ton of latent heat in all that moisture, which should buffer any cooling that might or might not happen
No, there is not, as all that moisture condenses in 9 days. Perhaps you can see here that the temperature and the humidity go hand in hand and that there is no evidence for any extra heat buffering anything which would shift the temperature curve:
http://www.leif.org/research/Global-Humidity-and-Temps.png
This concludes the discussion.
You would agree though that the release of WV into the air and the resultant spreading out of it has more effect where minute increases in WV affect temperatures most, which its where its dry and cold leading to a disproportionate warming. We can directly watch enso SST and resultant warming ( or cooling as we see in the la nina after the lag ) but there is no such linkage to co2 that we can directly track except the cry its getting warmer so it must be co2. But why would you not track and pay attention what you can directly. So is it not the antics of the ocean and water vapor? As far as temps the one and only story, the tracking globally of mixing ratios has always been my argument ( actually Dr John Cahir from PSU) as the real canary in the coal mine as far as climate. Any cutting of the WV from its source and rapid turn arounds can occur, especially since its so warm. The fact is the nature of heat is the warmer it is, the harder it is to get warmer! But cut the source and down it will come. This is why a look at the arctic temperatures reveals that it is WV, as the summers are not warming north of 80 north ( because it takes more to do so when the mean temp is 275k) than when its 250K Its not that co2 has NO effect its that because of larger items around it, its very difficult to say its the climate control knob. Another hint is the fact the nightime lows are warming while daytime maxes for instance over the US have warmed less. One may argue that the range then is decreasing, leading to a more stable climate, especially since warming in the north decreases the zonal potential energy. BTW I am no fan of tranquil weather. Bad for business. If anyone in this discussion should be rooting on extremes, it would be me. Peace out
joe
there is no man made global warming, or its effect is so small that you cannot measure it.
see my reply to Mario.
What paper makes you think that man made warming does exist and what checks have you carried out that there is warming at all, and that it is global?
As a weather man with a great track record… I would say Joe can see through the maze and tell us with great depth of knowledge his opinions… and to me they hold water! Henry, I too think your work is fascinating… and I look forward to your ideas and conclusions to help us try to see through the maze!
Gabro December 9, 2017 at 10:33 am
Willis Eschenbach
Thanks, Gabro. First, I’ll make you the same offer I make everyone. Send me TWO links, one to the paper claiming the detection of solar sunspot-cycle related effects on surface datasets that you think is the strongest evidence for your case, and the second to the actual data used in that study. I’m more than happy to take a look at it.
Second, I don’t “deny” anything, that is a pathetic ad hominem attack that just makes you look like a pathetic noob. Sorry, but that is the reality of folks throwing around accusations of “denial”.
Finally, I’ve been accused of this before … and Leif Svalgaard just posted the best answer, viz:
I don’t make scientific decisions based on the number of papers making a claim. I base it on the quality and strength of the arguments on both sides of the question.
I await your best paper plus data … although if past performance is any guide, only about one of my detractors in fifty actually takes me up on the offer. Funny how that works.
w.
Willis,
It is pointless yet again to present you the facts, since you refuse to accept them.
You’re a true believer, not a scientist. You are impervious to reality.
Real scientists here have shown you hundreds of papers, of the highest quality, but no amount of objective reality will change your set mind. Your obstinate d@nial of reality makes you a zealot.
You’ve been repeatedly shown for years that the solar cycle is visible in temperature, rainfall, storms, tree rings, wind, air pressure, ozone, you name it. But you have your totally baseless beliefs and won’t be budged by any amount of reality.
But just to give readers who might be unfamiliar with your record of evasion, avoidance and inability to accept inconvenient truths, a good place to start would be your reaction to Dr. Reddy’s analysis of rainfall data from Fortaleza, Brazil.
In typical fashion, first you d@nied that there could possibly be a long enough record there to be valid. Clearly, you didn’t even bother to read his paper. When showed that the data went back to 1849, you then simply asserted without any statistical analysis that the good doctor’s 52-year cycle didn’t exist.
https://wattsupwiththat.com/2015/12/10/noise-assisted-data-analysis/
This Italian scientist did the work which you refused to do, for fear apparently of what you might find, and discovered that the data and Redddy’s analysis are indeed statistically significant.
The same MO you displayed for monsoons, tree rings, temperature and precipitation in every other paper from every continent and ocean.
Dee-nial is the right word.
http://www.climatemonitor.it/?p=39988
Forgot the Italian link. In Italian, but graphs make the point, even if you don’t read Italian.
Just as you have ignored, dissed and shined on all of Reddy’s other work:
Dr. S. Jeevananda Reddy
June 28, 2014 at 10:44 pm
I am one of the few working in the area of rainfall patterns over different parts of the globe. My first paper [published in 1977] relate to the dates of onset over Kerala Coast, an important event in monsoon rains. This showed a 52-year cycle. My second paper relates to Mahalapye in Botswana. The precipitation data presented a 60-year cycle — with sub-multiples, amplitude & phase angles; integrated — published in 1981. The Fortaleza precipitation data in Brazil presented a 52 year cycle — with sub-multiples, phase angles and amplitudes; integrated –. This was published in 1984. 1986 published the analysis of Durban in South Africa and Catuane in Mozambique. The precipitation data of Durban showed 66-year cycle and Catuane 54 years — sub-multiples, amplitude & phase angles integrated –. In the case of Ethiopian stations the analysis was published in 1990. They varied from 22 to 44 years cycles. Asmara in present Eritrea presented 22 year cycle, which is a sub-multiple seen in Durban precipitation. Indian rainfall — all-India southwest monsoon — data analysis was published in 1996 — the homogenized data series was available only in 1995 –. The all-India Southwest Monsoon rainfall presented 60-year cycle — completed two full cycles and started in 1987 the third cycle. This is different in Andhra Pradesh state rainfall that receives rainfall during the southwest and northeast monsoons and cyclonic activity presented 132 year cycle in annual precipitation. The southwest monsoon and northeast monsoon rainfall data presented 56 year cycle but in opposite direction. The cyclonic activity followed the northeast monsoon 56 year cycle pattern. The hurricanes & typhoons followed 60-year cycle of All-India Southwest monsoon but in follow opposite pattern. Global temperature followed the same pattern but similar to typhoons pattern.
In such scenario, average.rainfall pattern provides negative feedback. It is better to look at regional level pattern as they follow general circulation patterns in conjenction with natural in-built cyclic variations.
Dr. S. Jeevananda Reddy
He’s a scientist, and you’re not. You just try to play one on blogs.
And then of course there is Dr. Spencer’s takedown of you as a poseur. because you lack basic scientific education, you imagine that you’ve made real contributions instead of merely reinventing the wheel. With four sides.
http://www.drroyspencer.com/2013/10/citizen-scientist-willis-and-the-cloud-radiative-effect/
Naturally, on the two (?) occasions when you have attempted a real scientific paper, you left out the usual section on previous work along the same lines. Literature search just isn’t your bag.
So you fall back on your old standby defense of asking for just one paper, with which you then proceed to find some phony fault. You’re not interested in reality and can’t handle the truth.
Sad. Maybe if you had studied a STEM discipline at Sonoma State instead of psych, after your Section 8 discharge from the Army, you could have been a contender. But too late to make up for it now.
For “poseur”, please read “pumped-up poseur” who imagines himself a “polymath”, despite all objective evidence to the contrary. A science education would have served you better than a masseur’s license if your goal were to contribute to science.
Careful there Gabro, or you will get pummeled by him when he touts his MAJOR contribution. He had a “pal reviewed” comment published in Nature’s Communications Arising: https://www.nature.com/nature/for-authors/bca
Steve,
I know about his pathetic published comment out of which he tries to build a scientific reputation.
As I said. Sad.
Gabro December 9, 2017 at 1:54 pm Edit
Gabro, if you don’t want to put your theories to a test, there’s no need for all of that faffing about. Just come out and say that you do NOT want people to test your claims. No need to kill electrons needlessly writing all of your pathetic excuses.
Next, as to not accepting facts, I have two posts that clearly show what I actually do when I’m wrong. The first post was called “Wrong Again”, and the second was called “Wrong Again, Again”. So I have publicly demonstrated that when the facts change, I admit that I am wrong and I change my mind.
Can you say the same? Can you point me to where you’ve admitted publicly that you were 100% wrong? Or will this request go the way of my simply asking for your evidence?
Finally, I had a “Brief Communications Arising” in Nature. As you and Steve Heins obviously don’t know, a Brief Communications Arising is NOT a comment. It is a short piece, 500 words and one graphic.
In that piece I said that no, the decline in the fishery at Lake Tanganyika was not due to climate change. And despite taking lots of crap from jerks like you and your pal, guess what?
I was right. My piece has since been cited in two other scientific works that say the same thing.
So I have a piece in Nature that has garnered two citations (among the seventy or so scientific citations that my work has received.
Can you say the same?
So … is the taste of those sour grapes in your mouth worth it?
w.
Gabro December 9, 2017 at 2:19 pm Edit
Let’s start with the facts. I didn’t “deny” anything. That’s just you being a jerkwagon. What I said was:
Here’s a protip—if a man says “I don’t think”, he is not denying a damn thing. I didn’t think it existed. I was wrong. I admitted it, and I analyzed the data.
After your lie that I denied something, you then falsely claim that I “simply asserted without any statistical analysis that the good doctor’s 52-year cycle didn’t exist”. That is more of your ignorance. I reported on my statistical analysis, but I didn’t publish the results. If someone had asked, I’d have posted them … and now, after all this time, you’ve asked.
Well, lucky you. I still have the analysis, so I just ran it again. Here’s the periodogram of the data, a re-run of the analysis that I did at the time:
There simply is no 52-year signal visible in that Fourier-based view of the data. And THAT IS WHAT I REPORTED AT THE TIME.
Now, at that time I didn’t know about CEEMD, which is “Complete Ensemble Empirical Mode Decomposition”. So let me take another look at the Fortaleza data with CEEMD … hang on … OK, here we go. First, the periodogram of the intrinsic modes:
As we saw in the periodogram, there are no cycles that are anywhere near the annual cycle. All of the power is in the 6-month and one-year bands.
However, we can look and see if the tiny cycles have any power in the 52-year range.
Even when we magnify these tiniest of cycles, there is still no power in the 52-year region.
In other words … my claim at the time was correct.
So piss off with your nasty insinuations, my anonymous ankle-biter. I’m not interested in being accused of things I never did by people without the courage to sign their own name to their own words. The ball is in your court now. If you think the 52-year cycle is there, show us your analysis of the data.
And I can understand now why you are so unwilling to provide the strongest piece of evidence for your belief in sunspot cycles and other cycles …
w.
Willis,
You do not have a “piece” in Nature. You have a comment, to which the authors of the paper replied. That’s it.
As I said, you\re a pathetic wannabe, who imagines falsely that you’ve made a contribution. Dr. Spencer has correctly put you in your presumptuous place. But reality isn’t your bag.
As I said, why show you yet more dozens of papers on solar effects on climatic phenomena, when you steadfastly refuse even to read them, let alone analyze them?
The facts speak for themselves. You just can\t handle the truth, and apparently aren’t even interested in it.
Anyone who wants to can read your non-reply and weaseling in response to Dr. Reddy and in every other case. Anybody doing so will plainly see what a pumped up poseur you have the ignominy to be.
Willis says: ” a Brief Communications Arising is NOT a comment.”
…
However, the description posted by the journal Nature says: “Critical comments on recent Nature papers may, after peer review, be published online as Brief Communications Arising, usually alongside a reply from the criticized Nature authors.”
..
So Willis you are wrong.
….
You can read the description here: https://www.nature.com/nature/for-authors/bca
…
That’s where my quote comes from.
..
Note it says: ” Critical COMMENTS on recent……..”
Mario
I am not sure if global RH is decreasing, anyone here have a comment on that?
That would fit into my results showing that, ON AVERAGE, earth has already started cooling, since the start of the new millennium.
Also, in a cooling world one would expect less clouds and rain at the higher latitudes and more at the lower latitudes. I think, generally, just looking at the weather reports, on average, this is happening already.
That brings us of course back to the dust bowl drought 1932-1939 and the one before that happening in 1845 that wiped out a lot of the bison on the plains of north America.\
by my calculations the Gleissberg cycle is 87 years, not 88 years as reported by most, consisting of a sinewave with 43.5 years of warming followed by 43.5 years of cooling.
That means the next decade could bring a disaster to the bread basket of the world.
https://youtu.be/IRsPheErBj8
http://oi63.tinypic.com/2ef6xvo.jpg
Just for interest:
note this graph from Leif:
http://oi63.tinypic.com/2ef6xvo.jpg
Just so you don’t get confused with using the right terminology:
When sunspots are high, the solar polar magnetic field strengths are low.
Note that according to Leif’s latest graph, the solar magnetic field strengths have been increasing, since 2015 (when the cosmic ray measurements also began)
http://www.leif.org/research/Solar-Polar-Fields-1966-now.png
I would assume that there must be a correlation?