From the “another failure of public education” department and the UNIVERSITY OF UTAH:
Interpreting hurricane forecast displays can be difficult for general public
Utah study finds the two commonly used methods are often misunderstood by novice viewers
The 2017 hurricane season has highlighted the critical need to communicate a storm’s impact path and intensity accurately, but new research from the University of Utah shows significant misunderstandings of the two most commonly used storm forecast visualization methods.
The study, published by Cognitive Research: Principles and Implications, looked at summary displays and ensemble displays for communicating information about a hurricane. Summary displays show the possible paths of a hurricane as a cone with hard boundaries, referred to as the “cone of uncertainty.” Ensemble displays show lines indicating many possible paths that a hurricane could take.
There are advantages and disadvantages to each technique, according to study co-authors Lace M. Padilla, Ian T. Ruginski and Sarah H. Creem-Regehr of the Department of Psychology at the University of Utah.
“Even though hurricane forecasts are costly and have a high impact on health and safety, there has been little research demonstrating how to depict forecast uncertainty to the general public effectively,” said Padilla.
In one experiment, the researchers showed participants either a summary display or an ensemble display with hurricane forecast data and asked them to interpret size and intensity of the storm on a hypothetical oil rig that was shown in different locations. Two additional experiments used only ensemble displays, showing oil rigs at different distances from the storm’s center and either on or between forecast lines.
Amazon Deal: 4K HD Wifi Sports Action Camera Ultra Waterproof DV Camcorder 12MP
Although the two types of displays used the same hurricane data, participants interpreted size and intensity differently. The researchers found summary displays were more likely to be misinterpreted than ensemble displays. The cone of uncertainty in a summary display, for example, depicts a hurricane’s possible path, with no information about size, but study participants were likely to interpret the display as showing a storm growing in size and intensity.

Ensemble displays are promising for high-level decisions such as regions to evacuate, but the researchers found that novice viewers’ judgments are biased when their point of interest overlaps with a line in the ensemble. In the ensemble display experiment, participants were more likely to predict greater damage to an oil rig located on an ensemble line compared to one not falling on a line.
This suggests that people may be more likely to evacuate or take precautionary actions if one of the lines in an ensemble overlaps with their own town, but feel relatively safe if not. This type of risk assessment is inaccurate because forecast scientists choose how many lines they want to show — meaning that ensemble forecasts rarely show all the possible paths the hurricane could take.
These findings matter because the visualization technique chosen can change what information people think is most important and affect decision making about mandatory evacuations and allocation of emergency management resources, the researchers said.
“There are pros and cons for each method of showing hurricane forecasts. That is why it is so important for the media to be informed about how the information they show can influence people’s actions,” said Padilla.
The findings also have implications for media reports, since based on the type of images used, more context may be needed to help the public understand what they are seeing and what it means.
###
Oddly, with Hurricane Irma, Florida witnessed what many said was the largest mass evacuation in U.S. history, so maybe people aren’t as dumb as the researchers suggest.
Here is the study: http://cognitiveresearchjournal.springeropen.com/articles/10.1186/s41235-017-0076-1
Effects of ensemble and summary displays on interpretations of geospatial uncertainty data
Lace M. PadillaEmail author, Ian T. Ruginski and Sarah H. Creem-Regehr
Cognitive Research: Principles and Implications20172:40
https://doi.org/10.1186/s41235-017-0076-1
Received: 26 January 2017, Accepted: 30 August 2017 Published: 4 October 2017
Abstract
Ensemble and summary displays are two widely used methods to represent visual-spatial uncertainty; however, there is disagreement about which is the most effective technique to communicate uncertainty to the general public. Visualization scientists create ensemble displays by plotting multiple data points on the same Cartesian coordinate plane. Despite their use in scientific practice, it is more common in public presentations to use visualizations of summary displays, which scientists create by plotting statistical parameters of the ensemble members. While prior work has demonstrated that viewers make different decisions when viewing summary and ensemble displays, it is unclear what components of the displays lead to diverging judgments. This study aims to compare the salience of visual features – or visual elements that attract bottom-up attention – as one possible source of diverging judgments made with ensemble and summary displays in the context of hurricane track forecasts. We report that salient visual features of both ensemble and summary displays influence participant judgment. Specifically, we find that salient features of summary displays of geospatial uncertainty can be misunderstood as displaying size information. Further, salient features of ensemble displays evoke judgments that are indicative of accurate interpretations of the underlying probability distribution of the ensemble data. However, when participants use ensemble displays to make point-based judgments, they may overweight individual ensemble members in their decision-making process. We propose that ensemble displays are a promising alternative to summary displays in a geospatial context but that decisions about visualization methods should be informed by the viewer’s task.
So, did they bother to put an explanation at the bottom of the graph? I could think of multiple explanations of each of those, if there is no legend to explain exactly what it means. Its kind of a meaningless survey if all they did was display a diagram like that above without a legend to explain what it means.
Showing hurricane forecast tracks to participants in Utah is like showing blizzard forecasts to participants in Florida.
Duh!
Rocky… sorry my friend but do a google search. You will get a Stack of Florida blizzards….
But very few Utah hurricanes. My suspicion is a far greater percentage of Floridians have weathered a blizzard than Utahns have been through the eye of a hurricane….
There’s nothing that explicitly states that only Utahans were studied.
I would imagine you would get a different answer if you polled mid-westerners compared to those that live on the East and Gulf coasts.
Here’s a current example of a cone display. Tropical Storm Nate — http://www.nhc.noaa.gov/graphics_at1.shtml?cone#contents Presumably this is similar to what they used although the legend would be kind of cluttered for TV.and I doubt it’d be read by most viewers even if the image were readable and were displayed long enough for them to read it.
It is an issue of the weather forecasters portraying more certainty than they really have. Saying most of the tracks center on South Florida, which they did with Irma, is a lot more accurate a statement than Irma is headed for Miami. The spaghetti track display at least gives the truth that some of the models give quite a spread in what is a low probability outcome.
It is yet another case of how much to trust the audience with messy reality.
it’s going to Miami….no, up the west coast……no up the east coast….no Naples….no up the middle of the state….no off shore east coast……
“It is an issue of the weather forecasters portraying more certainty than they really have.”<bingo
When they have to cone of death from Rio to Maine
What’s it matter? They change it every six hours until it finally says what Weatherbell had said for days.
exactly so. irma was predicted to be up the east coast for several days so the panic stricken populace fled to the west coast. there, it smashed them at landfall. further north it was breezy and rainy – absolutely no big deal except where there was too much rain.
the way to deal with a hurricane warning: ignore everything until the thing is within 100 miles of you and then watch. if you can move at 20 mph and get 50 miles away you can dodge a hurricane. (even in a tesla- or on a horse)
i’m proud to say i was one of the few who was completely prepared for absolutely nothing to happen.
I followed the reporting on Harvey fairly closely, and even a fairly low probability of getting hit does matter. My sister’s house has a bit of a flooding problem in very severe rain (as in more than 10 inches in a day), so knowing the storm could produce heavy rain as far north as Marble Falls (west of Austin) mattered. Sandbagging the vulnerable area was quite cheap, and the storm did go as far north as Austin, just the east, not the west, side. Two counties over there was 18 inches of rain (and counties are small in Texas).
IMHO this is just another survey on the general STEM ignorance of the American public. They rely on graphic images because captions are too wordy.
If one tried to overlay potential wind speed data onto track uncertainties John Q. Public would be completely lost. Why not just dashed lines indicating 2 sigma storm tracks as boundaries and cross hatching between them?
why not do an example as a guest post
Are you volunteering to represent the general public?
Rocket, They DO do wind speed indicators. Just look at most projections.
https://www.wunderground.com/hurricane/atlantic/2017/tropical-storm-nate
It’s simple, you have the cone alongside the Category in colors. It’s quite simple.
I think that’s a nice improvement, Might it also be useful to attempt to depict size of the storm by making larger icons as well? Size would help the color blind distinguish differences as well.
I like the sentence that says people think the graphic displays a storm getting larger as it approaches the shore. That is a misunderstanding that I had not managed on my own.
Perhaps if the forecasts were not accompanied by a multimedia campaign of global-warming-shrieking and disaster-is-upon-all-us-sinners and the narrative about this being nature’s-revenge-for abusing-the-planet’s-resources, and you-had-better-get-used-to-more-of-this-if-you-don’t-give-us-more-money, oh-my-God-look-how-big-it-is-in-this-satellite-photo-of-the-clouds, people would take the time to understand the implications of what they were bring told about the hurricane.
Catastrophism is not helpful when it comes to managing public safety. Misunderstandings, misinterpretations and excessive pessimism, and of course outright misbeliefs, are the consequence of radical cliques continually boasting about their prowess in foretelling the calamities soon to be upon us. The real message is lost in the murk.
Spot on
Cris 100%…all that and coupled with changing their forecast 3-4 times a day….exaggerating and fear mongering
too many of these “professionals” have bought into their own hype
“Catastrophism is not helpful when it comes to managing public safety.”
Along those same lines, how many people will be adversely affected when they ignore the next OMG YOUR ALL GONNA DIE! newscast? After all, the last time the media played this ratings stunt, nothing much happened for many people.
Eventually the wolf will arrive and the townspeople will no longer heed the calls.
Rocketscientist
There is no wolf.
This reminds me of the space junk graph where the minimum dot size on the printer made the junk look like it was impossible to launch another satellite without hitting something.
And that is only for the items we can track (about the size of a cigarette lighter). If you really want to see what space junk can do to orbital systems see this link about LDEF NASA’s materials test experiment:
https://curator.jsc.nasa.gov/mic/ldef/
It was intended to observe vacuum and space environment impacts on different candidate materials, It got delayed in orbit a bit longer than planned. Regardless, when returned to earth it looked worse than a “NO HUNTING” sign on a rural byway.
A bit off topic, but- a very likely strategy in the next world(literally) war would be for a country such as the DPRK to launch a missile with a small bomb warhead surrounded by coarse sand into a retrograde medium height orbit.
The resulting velocities >450 km/s would play havoc with much of the GPS systems and eventually most satellites in lower orbit.
this member of the public understands those doing the forecasting do NOT know the future and are putting out GUESSES that are wrong 33% of the time at minimum, their cone of uncertainty is right 66% of the time ONLY………the state of alabama had a state of emergency and schools closed for 2 days recently for a 25MPH light rain in places……and again is under the same state of emergency NOW…….the “experts” are the ones LYING to the public and many of the public like me are clued IN to what they are doing…….HYPING storms period.
Which begs the question; How stupid do young Psych graduate program students perceive the average adult to be? Perhaps a study on “how individuals who score the lower ranges of intelligence interpret graphic representations of weather event forecasts” would be more beneficial to the field.
“It is better to be safe than sorry!”. Or something.
Looks to me like another study from our arrogant left-wing academia where the conclusions were written first.
From their paper…
Neither the cone nor the ensemble tracks have anything to do with intensity… Are there actually people out there, so stupid, that they think that this image indicates that the storm will intensify from 5 PM Saturday to 2 PM Tuesday?
http://media.springernature.com/lw785/springer-static/image/art%3A10.1186%2Fs41235-017-0076-1/MediaObjects/41235_2017_76_Fig1_HTML.gif
“Think of how stupid the average person is, and realize half of them are stupider than that.” George Carlin
Difficult to argue with anything that George said.
George Carlin…A sage for all time
George should know, he was in the second group most of the time.
Gee Tom,
Are you saying “It takes one to know one”? 😉
The answer to your question is “yes.”
“Nobody ever went broke underestimating the taste or intelligence of the American public.”
-H. L. Mencken
Remember the Edsel? Ford didn’t go broke, but had that been a single line manufacturer they would have.
David Middleton … at 8:36 am
we hypothesized that participants…We predicted that participants…
Thank you for making my point.
Fine.
So SHOW the hurricane storm rainfall instead of a single little bitty “precise” small “circle” with a S, T, H.
Do NOT show the little single eyewall all by itself. Rather, start with the tiny eye (maximum winds), then add the 50% rainfall (storm edges) and the 90% storm edges.
Start with solid lines for the storm circles 24 hours out.
Then use single dashed lines for 36, double dashed lines for 48 hours out.
White dashed lines for 60 hours out. (Greater uncertainity, less precision implied by the lighter colors, less of
a solid line.
The further the date projected, the lighter the image.
Are there actually people out there, so stupid, that they think that this image indicates that the storm will intensify from 5 PM Saturday to 2 PM Tuesday?
Understanding the ways people think is crucial when developing graphics, which really are just condensed version of explanatory text. By long experience people have become habituated to associate larger objects with greater intensity. The the context of hurricanes, these in turn are linked to visual images of massive damage. Using the cone to represent uncertainty — a somewhat intangible quantity — doesn’t follow the same mental track. So people who don’t take the time to study the graphic are misled; they’re not necessarily stupid. They make invalid assumptions based on past experience and carelessness (Kahneman’s System I thinking). Graphic designers shouldn’t make their own invalid assumption that everybody understands things the way they do and take more care in representation. Not always easy or possible, but certainly a goal.
Like this?
Like this?
David M
Well, the money quote is right here:
“we hypothesized that participants viewing the cone of uncertainty would report that the hurricane was larger at a future time point”
That is the expectation of Yogi academics who think they are smarter than the average bear.
Who says they will think that? Did they check? Could it be that fishermen and beach hotel industry workers are well aware of what a storm track means?
This nonsense about ‘intelligence’ begs the question, “What is your weather intelligence quotient? (WIQ)
My suspicion is that those who live in the path of hurricanes would outscore those in the ivory towers.
It’s more of a probability intelligence quotiemt (PIQ) or a statistics intelligence quotient (SIQ). The professors hypothesized that their students were functionally illiterate in the area of probability & statistics.
The general public doesn’t need to understand hurricane forecast tracks. The public in hurricane prone areas are the only people who need to. Did they test people in Utah or Texas and Florida?
You know what would really, really help? Improve the forecasts. Narrow down the uncertainty width from the current roughly 100 miles wide per day.
Because of the weird “geometry of the geography” of Irma’s path and Florida, the uncertainty cone covered the entire peninsula, and there’s simply no good way to evacuate the entire peninsula. Most of the state’s 20 million people live on the peninsula with only two major highways going north out of the state (I-75 merges into “Florida’s Turnpike” still 150 miles from the state line).
Given a choice between sitting in your house or stuck in a car in traffic on some road in the middle of nowhere when CAT 3 or 4 winds are hitting you, you might decide the house is a better option.
This is idiotic… Which oil rig is likely to suffer the most damage? The one that’s closest to the storm’s path or the one that just happens to fall on one of the ensemble lines?
http://media.springernature.com/lw785/springer-static/image/art%3A10.1186%2Fs41235-017-0076-1/MediaObjects/41235_2017_76_Fig8_HTML.gif
The closest rig is most likely to receive the most damage. While most of the students seemed to grasp this concept…
The individual paths are irrelevant. The cone is basically the 95% probability band of the ensemble.
It’s no wonder so many idiots fall for the Gorebal Warming scam.
In both case, the risk of damage is minimal, as the ensemble indicates a storm center about 100 miles away or more. At that distance, the risk is practically the same.
BTW, there are no oil rigs in the Southeast Gulf of Mexico.
I think the average person in the Gulf Coast States knows a lot more about hurricanes and hurricane graphics than the people writing this paper.
Rig ‘b’ in image ‘b’ would probably be near the edge of the cone. If the Eastern Gulf was open to E&P, both rigs ‘a’ & ‘b’ would probably be well-outside of the cone in image ‘a’. Either way, the individual tracks from the ensemble are irrelevant.
“I think the average person in the Gulf Coast States knows a lot more about hurricanes and hurricane graphics than the people writing this paper.”
I saw a weather bobble head actually state that the continental shelf on the west side of Florida is virtually non existent and it’s quite steep just off the coast as opposed to the Eastern Florida coast.
“Even though hurricane forecasts are costly and have a high impact on health and safety, there has been little research demonstrating how to depict forecast uncertainty to the general public effectively,” said Padilla
They write this as if the folks at the National Hurricane Center haven’t ever thought about this before. They have thought and researched this a lot, for many decades, and this academic study adds nothing to the far greater understanding at the NHC!
The article concludes:
“The findings also have implications for media reports, since based on the type of images used, more context may be needed to help the public understand what they are seeing and what it means.”
Again…the academics seem to have no clue as to what happens in the real world. In hurricane prone areas, the local media works well with the NHC to provide all the context in the world. Of course, someone new to a hurricane prone area will need some education, and that is happening continuously at the local level.
Perhaps these researchers from Utah should visit the NHC and then spend a hurricane season in Florida, before they publish a paper that is about 40 years behind reality!
This bit is downright “scary”…
I can’t even begin to fathom why someone would even begin to think that the widening cone of uncertainty indicates increasing intensity or that the dispersion of the ensemble members indicates decreasing intensity. Much less, why “social scientists” would expect people to think this way.
This goes way beyond hurricane forecasting. The relationship between the cone and the model ensemble should be intuitively obvious. It’s basic statistics..
The National Hurricane Center maps include detailed explanations. Their website explains everything in plain English.
The NHC maps are clearly labeled…
Obviously those that do no make Dollars studying Global Warming make the most cents (sense)
The NHC map clearly labels the cone as the “potential track area.”
http://www.nhc.noaa.gov/graphics_at1.shtml?cone
The problem is not with the people preparing the weather maps.
Yes, but ‘layman’ are not familiar with basic statistics. The graphics due take some explanation, but the learning curve is not steep.
The main goal of the NHC is to warn the public of impending danger, with a secondary goal of limiting unnecessary actions that can be very expensive and disruptive. The cone achieves this much better then various ensemble graphics. The message of the cone graphic is simple: If you are in the cone, get ready for the full potential of the storm.
Did anyone else notice that the NHC forecasts for Irma were trash….they changed the track, the travel speed, the intensity….everything more than once a day
…and that Ventusky called Irma correctly from day one
I don’t know how Ventusky works…by maybe the NHC can take lessons from them
I can’t fathom your reaction. If you have only the two pieces to look at with no explanation as to what they mean, it is obvious why you would consider the ensemble to give the impression of weakening. ALL the black is in the center, and the individual tracks spray out, just as if it is dispersing. If the graphic doesn’t well define what the lines mean, that would not be an unreasonable thought process from a visual point of view.
As for the cone, if you are watching the storm come in, it generally seems to be a smaller area in the center of view, and as it gets closer, it spreads further and further to the sides. Doesn’t say it is intensifying, it implies that it is getting larger. Again, we are talking visual interpretation, NOT logical interpretation. They weren’t looking for logical interpretation. If they were, they would have given supporting data for the logical mind. I am also sure that they did not choose interviewees based on logical capabilities.
In regards to the mass evacuations in Florida, I suspect that would not have happened had Harvey not stalled over Texas and dropped all that rain. Had Irma happened first, the evacuations would have been far less because Floridians have been through a wealth of catastrophic forecasts that turned into marshmallows by comparison. Harvey threw the fear of storm into them, thus they bugged out. I still don’t know if that was as necessary as it was made to be by the “fearcasting” that was going on.
If you were given these two images without an explanation, would you assume that the first indicates that climate change is becoming more severe and the second indicates that climate change is becoming less severe?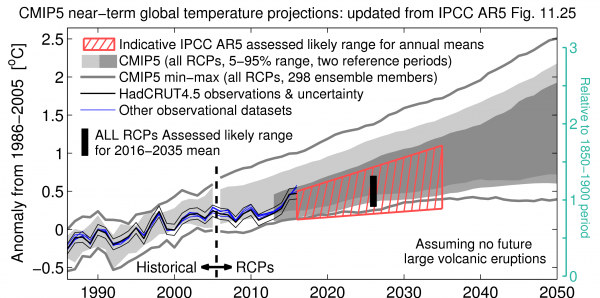

Both the hurricane maps and climate model graphs are depicting probability distributions of model outputs. The hurricane cone and first CMIP5 graph represent the range of 95% of the models. In both cases, the “spaghetti” plots are showing all of the model ensemble members.
Abstract from paper…
http://cognitiveresearchjournal.springeropen.com/articles/10.1186/s41235-017-0076-1
“Harvey threw the fear of storm into them, thus they bugged out”
exactly….the “news” and the NHC were predicting catastrophic storm surges and floods
It’s a police lineup. The one on the right did it because it looks like a wild unkempt mustache.
I think that the spaghetti string graphs are useful when a storm is way off in the Atlantic ocean for probabilities of paths. Once it gets closer to land masses and there is more certianty that’s where the cone of probability should be used. Most of the weather forecasters on TV here in Baltimore are pretty good at explaining that.
Climate scientists of the Team are staying away in droves these days except to smear and report from the imaginary “front” of the climate wars in their minds – a colorful form of dеиуал that the party is over. It’s an interesting dynamic this endgame of the tattered alarmosphere.
The literature has dichotomized with the Team having downgraded from category 5 to a summer-day water spout with psychologists, sociologists, feminine glaciologists, journalists and other corrupted post normal disciplines carrying the sputtering torch. Actual climate science literature is being put out by a new generation that is greatly downplaying the strength of CO2 and warming, and even saying we don’t need to worry too much about the climate to 2100. That keeping us below 1.5C is a piece of cake- we’ve been running 300% too hot with our models.
In an earlier thread I was seeing the once great universities – Oxford, Cambridge, Harvard, the California set… as too decrepitated to fix and that we would have to let them go – maybe leaving them to crawl up to community college status while we simply build entirely new institutions for learned studies after the neoмагхisт 9lоваlisт plague had ended. I wish to revise my list modestly: someone must have taken Oxford by the ear and started to save it before it was too late.
That people in Utah don’t know how to interpret unlabeled hurricane charts is utterly unsurprising. About as newsworthy as I don’t live in China so cannot read Chinese writing.
Try running the same experiment in Florida.
There’s nothing that explicitly states that only Utahans were studied.
While it is well known that males do significantly better at spatial cognition than females, this study did not even attempt to account for that even though the majority of the participants were female.
See http://nautil.us/issue/32/space/men-are-better-at-maps-until-women-take-this-course
The National Hurricane center put an explanation right on their cone of death graphic.
http://www.nhc.noaa.gov/refresh/graphics_at1+shtml/152602.shtml?cone#contents
As for the spaghetti tracks? Why would the average person be interested in them unless they are doing their own analysis and looking at different model ensembles?
Failure to understand the cone map can only be explained by a failure to read or understand map legends.
Part of what I do is to build displays for our SCADA system that can communicate at a glance what is happening and also displays with more detail when further scrutiny/details are needed.
The NHC displays, such as the one you put up, are a great compromise.
Maybe they can be improved. But I can’t think how.
The legend part with the text might loose people, but, overall it communicates.
They do have other displays that show something more along the lines of what you’ve suggested.
http://www.nhc.noaa.gov/refresh/graphics_at1+shtml/152016.shtml?gm_track#contents
That was one of display options here.
http://www.nhc.noaa.gov/
Click on Nate.
Some of the hurricane forecasts gain more traction in the public’s mind because they look pretty.
In communicating with the public æsthetics of the presentation tends to override accuracy when informing the bulk of the non-technical populous.
I have come to this conclusion after many decades of painful research observing the choices and opinions of my immediate family and their friends, none of whom are particularly technical.
… Must go as my sister has just informed me about some kitten videos I simply must watch … 🙂
Even though we still see them on the Weather Channel and you can find them on the internet the NHC did a way showing spaghetti model runs years ago. They claimed that the public was misusing them. I don’t know whether they actually had any research that supported their conclusion. Most people I know that have lived in Florida for a decade or more and faced preparation for a tropical cyclone and are paying attention know pretty well how to read the various charts and model runs. Interestingly after Irma they are pretty certain that the models are far, far from accurate in predicting where a storm is going to make landfall and certainly not its intensity.
..”The 2017 hurricane season has highlighted the critical need to communicate a storm’s impact path and intensity accurately…”
==========
I don’t get it.
They can’t predict “a storm’s impact path and intensity accurately”, so now it is a lack of communication ?
Of what ?, best guesses ?
What’s to understand? The prediction is not an exact, precise science. The prediction is that it’s going somewhere along this route, we think. Check back in a couple of hours and we’ll give you an updated guess. If it looked like it might come into my area, I’d prepare.
“The cone of uncertainty in a summary display, for example, depicts a hurricane’s possible path, with no information about size, but study participants were likely to interpret the display as showing a storm growing in size and intensity.”
Advisories this year state that the cone shows the probable path “but does not show the size of the storm.”
I know, a lot of people are too lazy to see information like this when it’s staring them in the face.
The younger have been told to expect “worse and worse”.
OK ladies and gents here’s our weather advisory for today.
The weather people say there’s a big storm coming, and even their best guess for where it’s going to hit is not very reliable.
So all we can say is —
There’s a big very nasty storm coming here, or nearby, soon.
Get out now if you can.
If you must stay, prepare for the very worse, and hope for the best.
And now a video about kittens…
Mississippi Gulf Coast Media/Links
WLOX TV 13 (ABC) WXXV TV 25 (FOx)
Biloxi Sun Herald paper Gulf Live
Mississippi Power Outage Map
Louisiana Information
Govt/Official Info:
Louisiana Emergency Management
Mississippi Emergency Management
Alabama Emergency Management
Louisiana Dept. of Transportation – Road Closures, Traffic Cams, etc.
Mississippi – Road Closures, Traffic Cams, etc
Alabama Road Conditions and Traffic Cameras
Media Newspapers/TV/Radio:
Nola.com New Orleans Times-Picayune
WWL TV 4 (CBS Affiliate in New Orleans)
ABC 26 TV (ABC Affiliate in New Orleans)
WDSU Channel 6 (NBC Affiliate New Orleans)
Fox 8 (New Orleans)
WTIX 690 News Radio
WWL 870 News Radio
WTOK 11 / Missippii Alabama ABC Affiliate
WKRG 5 in Mobile/Pensacola
WPMI Channel 15 from Mobile
http://flhurricane.com/cyclone/wxstatement.php?t=AFD&m=10&d=06&y=2017&l=LIX
http://flhurricane.com/wiki/General_Hurricane_Info
Wave Monger – 1. n. A
hurricane trackerclimate scientist who pines for storms.It’s reaching the point where a large percentage of people under 30 cannot read maps at all. These will always be meaningless blobs and lines to them.
Precisely, (and yes I did need to look up the correct spelling of that word).
Maybe I’m the only one that sees the spaghetti maps and concludes that we really don’t know how to forecast a hurricane’s future path. Because, if we did, there couldn’t possibly be such wide spreads in the forecasts. They can’t all be right, so why show them?
No wonder it’s hard to convince people to up and leave, incurring hotel and other costs, when the forecasts can be off by a hundred miles or more in just the last three or four days before landfall.
The need is not for more information, it’s for more credibility.
They’re willing to admit ignorance regarding hurricane prediction, but are absolutely convinced that CO2 will barbecue the earth 100 years from now.
We can be thankful the weather folks don’t consult with Al gore because he would have us thinking of toast and brass monkeys.
Well I bet plenty of people along the central gulf coast are having no problem reading this:
http://www.nhc.noaa.gov/storm_graphics/AT16/refresh/AL162017_5day_cone_no_line_and_wind+png/092756_5day_cone_no_line_and_wind.png
Nate is strengthening quickly today. It’s really moving very quickly northward. The only thing that appears that will limit it’s continued strengthening will be the short period it has to develop before landfall. NOAA estimates it has 85 mph sustained winds. In the case of this storm one has to careful of how they take that claim. This storm is asymmetric, not only because of it’s west side brushing along the coast during it’s development but because of the strong SSE winds pushing it along the east quadrant of the storm has much higher winds than any other quadrant and the west side flow is bucking that southern wind.
At least it’s quick movement, which is projected to continue after landfall, will limit the amount of rain fall those under it receive. But the strong winds pushing it along will also increase storm surge, especially along the east side above what would be expected for a storm of it’s size and intensity.
My guess is it comes ashore as a Cat 2, probably a strong one.
Sorry those were winds OUT OF the SSE pushing the storm north and effecting it’s wind field.
Sounds like RAH is a “vet”, but I have been thru storms since I was4-5 years old growing up in New Orleans.
Moved to Panhandle in 1985 and been thru numerous storms up to cat 3, but no water as our county and adjacent one are the two highest counties in Florida. Had a great weather education as a pilot, so I can interpret the maps.
The thing that bugs me about the maps and the news is they always use the eye of the storm. A large storm like Katrina had hurricane strength winds over 100 miles from the eye. I am 180 miles from landfall of that sucker and had 40 – 50 mph winds for hours. So you can expect very strong winds for hours before the “time of arrival” they are talking about. Our cat 3 in 1995 had very strong winds about 4 or 5 hours before the eye hit 25 miles west of us. Trees started coming down, and by landfall most were down in the neighborhood. we got poor TV coverage because they had announced the O.J. verdict the afternoon before, heh heh.
Watching, now, but am at 85.5 W. Will likely get 25 – 30 mph gusts tonight, and maybe 20 – 25 steady state.
Gums sends…
The thing is moving even faster now! Before sunrise it was moving at 21 mph. When I posted the above it was moving at 22 mph. Now it’s moving at 25 mph with 90mph sustained winds estimated. The faster it moves the quicker it makes landfall, the better.
I’m not a “vet” but just have taken interest in trying to figure out these storms by interpreting the data and information available to try and figure out what they are doing or will do and why. I’m no authority on the subject at all and interested to hear what those that know more than I have to say.
Certainly no one in the media seems to understand that the “nastier” the storm, the smaller the wind field. Harvey, for example, went ashore with 125 mph winds — but those winds were confined to an area about 15 miles wide. Hurricane-force winds (64 knots+) extended only 35 miles from the center. A British paper headlined this as “Monster hurricane smashes into US.”
In a sense, the bigger the wind, the smaller its impact. I suspect most people look at the satellite image and think the advertised catastrophic winds comprise the whole red blob that is hundreds of miles in diameter.
The good and the bad…..
A fast mover minimizes the overall “misery index”, but the tidal surge and the max wind on the east side is higher. e.g. basically add the speed of the storm to the wind recorded by the Hurricane Hunter and/or radar.
Once away from the beachfront, our most serious problem is lack of electricity. Last few storms have been relatively easy to deal with, as we don’t have millions of old people and English as a second language ( myself excluded) and we have actually had more storms over the last 40 or so years than south Florida.
.RE: eye position versus wind…….
La and Ms already have first squals coming ashore and wind is picking up. The eye is well over 100 mile away!!!
Gums sends…
A little bit of Darwin and some “evolution in action” for those that cannot read the tracks.
Why not try the summary display but with changes in color as you get further from the center (most likely path)?