

Michael Bastasch
9:16 AM 09/20/2017
A climate model expert told The Washington Post there would be “extra eyes really scrutinizing” a new study claiming climate models predicted more global warming than has been observed this century.
And he was right.
Climate scientists have rushed to criticize a study published in the journal Nature Geoscience, which found that less warming in the early 20th Century suggests it’s slightly easier — though still difficult — to meet to goals of the Paris accord.
One would think climate scientists, especially those alarmed about warming, would see this as positive, but prominent researchers were quick to express their skepticism of results questioning the integrity of climate models.
Penn State University climate scientist Michael Mann told Seeker he was “rather skeptical” of the research. Mann doubted meeting the Paris accord goal of keeping future warming at 1.5 degrees Celsius above pre-industrial times was impossible without “highly speculative negative emissions technology.”
University of Reading climate scientist Ed Hawkins said media headlines “have misinterpreted” the new study that questioned models relied on by the Intergovernmental Panel on Climate Change (IPCC). Hawkins contributed to the IPCC’s major 2013 climate report.
“A recent study by Medhaug et al. analysed the issue of how the models have performed against recent observations at length and largely reconciled the issue,” Hawkins wrote in a blog post.
“An overly simplistic comparison of simulated global temperatures and observations might suggest that the models were warming too much, but this would be wrong for a number of reasons,” Hawkins wrote.
Berkeley Earth climate scientist Zeke Hausfather said the models matched observed global temperatures “quite well.”
A quick reminder that, reports in British tabloids notwithstanding, climate model projections agree quite well with observed temperatures. pic.twitter.com/7NxGUlBkFu
— Zeke Hausfather (@hausfath) September 20, 2017
Study authors, however, contend the models and observations diverged in the past two decades during what’s been called the “hiatus” — a period of roughly 15 years with little to no rise in global average temperature.
“We haven’t seen that rapid acceleration in warming after 2000 that we see in the models. We haven’t seen that in the observations,” study co-author Myles Allen, a geosystem scientist at the University of Oxford, told The Times on Monday.
“The models end up with a warming which is larger than the observed warming for the current emissions. … So, therefore, they derive a budget which is much lower,” study co-author Pierre Friedlingstein of the University of Exeter said, according to The Washington Post.
The study seemed to confirm claims made by scientists skeptical of catastrophic man-made global warming claims that models were showing more warming than actual observations.
For example, Cato Institute scientists Patrick Michaels and Chip Knappenberger have noted the climate models have been over-hyping warming for decades.
Climate scientist John Christy of the University of Alabama-Huntsville has shown climate models show 2.5 times more warming in the bulk atmosphere than has been observed.
Follow Michael on Facebook and Twitter
Content created by The Daily Caller News Foundation is available without charge to any eligible news publisher that can provide a large audience. For licensing opportunities of our original content, please contact licensing@dailycallernewsfoundation.org.
“highly speculative negative emissions technology.”
He must have meant “highly regressive negative emissions technology.” since the only viable negative emissions ‘technology’ is to preempt economic growth and prosperity.
Well, from a guy who uses highly speculative tree rings to fuel highly speculative models, maybe its his conscience leaking through, Freudian-like.
Since Nobel prize was at stake, Michael Mann had too much to lose…
Nice report but since “Climate Scientists” tend to equate Skepticism with Denial, perhaps this portion
Should read more like this
One would think climate scientists, especially those alarmed about warming, would see this as positive, but prominent researchers were quick to express their Denial of results questioning the integrity of climate models.
Penn State University climate scientist Michael Mann told Seeker he was “denying the validity” of the research. Mann doubted meeting the Paris accord goal of keeping future warming at 1.5 degrees Celsius above pre-industrial times was impossible without “highly speculative negative emissions technology.”
Mann et al- the new denialists
Bryan A
The worm turning?
“climate scientist” aka alarmist aka
grant gamer aka climate gamer aka political hack
Please… we have got to stop calling these witch doctors scientists. Sadly, ‘climate witch doctor’ doesn’t roll off the tongue like ‘climate scientist’.
How about Climate Denyentists
He must have meant “highly regressive negative emissions technology.”
Is that “climate science” speak for using the data upside down?
Their paychecks, reputations and egos are at stake if this proves correct- which it will.
ClimateOtter
Hardly mate, they’ll simply jump on the bandwagon of Global Cooling next, indeed, AGC, for their next pay cheque.
Just watch.
Along with the Global Cooling (aka Climate Change) will have to come the assertion that CO2 causes cooling.
David,
The alarmists will claim, and already are, that the work done on renewables has succeeded in halting global warming, despite the best efforts of CO2. It will be promoted as man’s scientific endeavour over nature’s foolish folly.
Seriously mate, watch this space.
M. Mann did not the much hoped for Nobel, but Obama gave him $500,000 for his hockey stick effort…
Per the source article (bold mine):
“Climate scientists have rushed to criticize a study published in the journal Nature Geoscience, which found that less warming in the early 20th Century suggests it’s slightly easier — though still difficult — to meet to goals of the Paris accord.”
Per Zeke Hausfather (bold mine):
Silly Hausfather, Straw Men are for kids!
Slight-of-hand: its not just for magicians.
sleight of mind by an evil hunchbrain
Never did trust Sick Horsefeathers
HausDaddy should compare his Blended Model 1970-2020 Fairy Tale to this, from the Forgotten Grooveyard of Hits – 2009 Style.
http://rankexploits.com/musings/wp-content/plugins/BanNasties/imageDiversion.php?uri=/musings/wp-content/uploads/2009/04/20yeartrends.jpg
They are reporting how well their New Revised Models compare to the New Revised Temperatures.
https://wattsupwiththat.com/2009/04/15/climate-models-vs-climate-reality-diverging-or-just-a-dip/
Heh. Who are the deniers now. 😄
Hopefully this is the beginning of the end, instead of the end of the beginning.
How can they say it’s wrong….when they were wrong?
> insert “not” before the first wrong….LOL
I was hoping they were right, and it will get warmer on Michigan Atlantic beaches…I hate to be called denier.
Climate consensus team is harming science again while denigrating anyone daring to analyze climate consensus findings only to discover that climate consensus advocates buggered results.
That Manniacal quote is amusing. Odds are that many manniacal didn’t read the research. meaning that many manniacal invents fiction climate consensus.
Having looked over Mann’s work I have no doubt that this new paper is orders of magnitude less “speculative” than his fraudulent crap.
Future climate scenarios suffer from a fatal statistics flaw put there by a reliance on correlations between cumulative values of time series data.
https://ssrn.com/abstract=3000932
Dr. Munshi is very good at finding and explaining misuse of statistics.
William Briggs does the same here with his “Arcsine” climate.
http://wmbriggs.com/post/257/
After this post, I downloaded the “R” program, and ran cumulative sums of random coin flips of 50 tosses.
Normally, one should expect the standard deviation to be about sqrt ( NPQ) or sqrt (50*.5*.5) or about 3.5 more heads(or tails) than average, and 3.5 fewer tails( or heads) than average after 50 coinflips. I consistently got figures like:
“Residual standard error: 8.143 on 48 degrees of freedom
Multiple R-squared: 0.6943, Adjusted R-squared: 0.688
F-statistic: 109 on 1 and 48 DF, p-value: 6.028e-14”
which means that such an “extreme” result would happen by “chance” only about 6.028 times in 10^14 tries.
As Munshi said, once I “detrended” the data, I got significance figures like 25% or 58% . really worthless, as one would reasonably expect for a series of random coinflips.
When errors are xtimes bigger than the value, it is called statistic noise, and will produce a hockey stick using Principal Component ‘analysis’ weighing the chosen values 390 fold. That is what M. Mann did.
Just looking at their own figures defeats their message.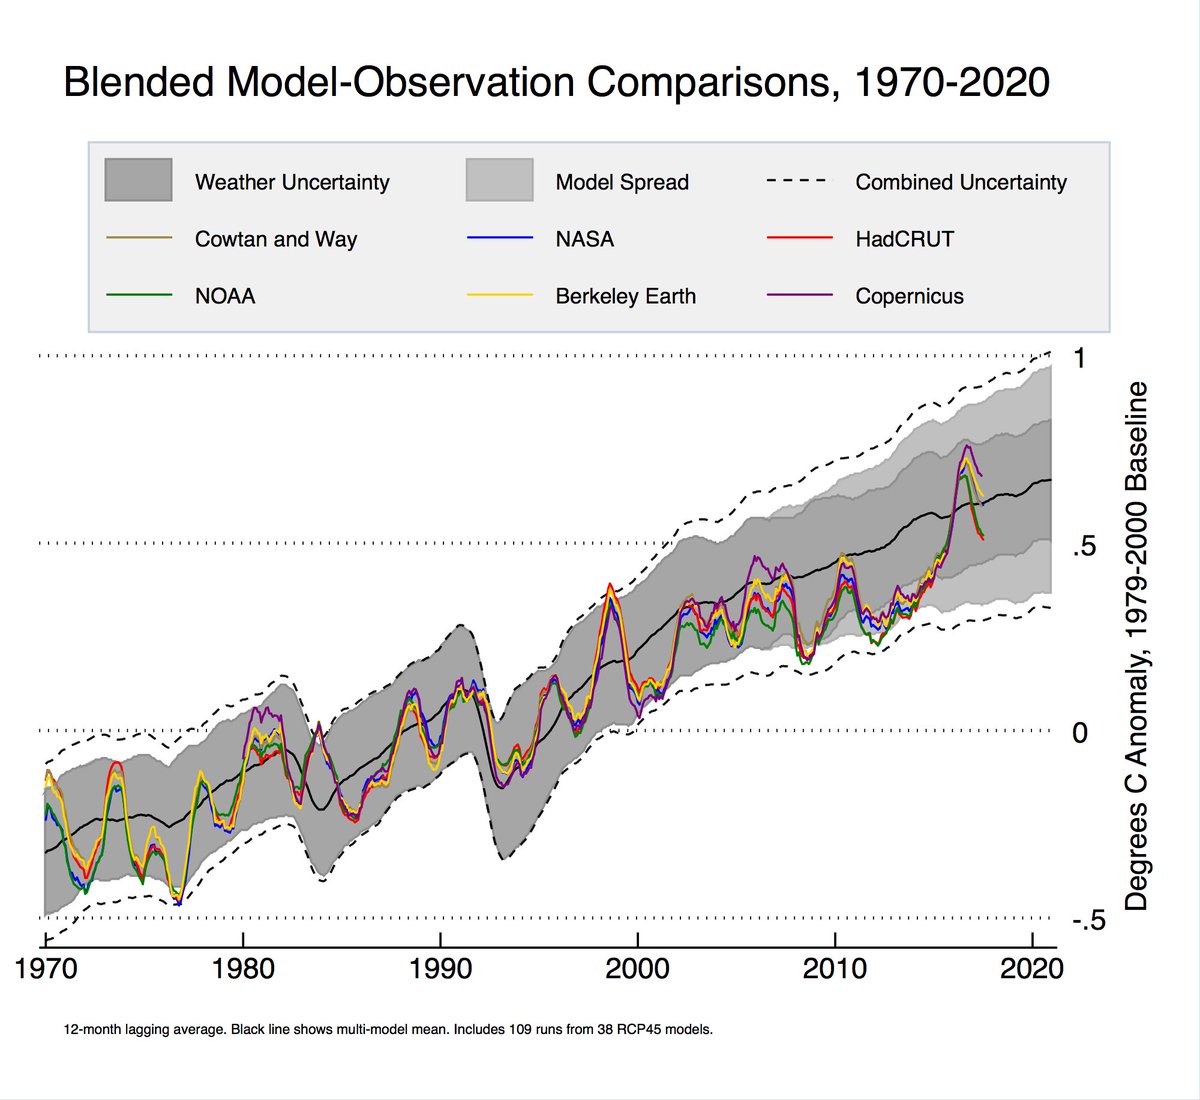
Temperatures should be above the model average between 30-70% of the time. Since 1997 they have been above the model average only at two times, 1998 and 2016.
The model average is equivalent to a permanent very strong El Niño. That’s what Hausfather calls “agreeing quite well.”
What always amazes me about this graph is how the models predict volcanoes so well.
isn’t
sciencefraud wonderful? It answers questions you didn’t even ask.And isn’t it amazing how wonderfully the models agree with each other in the past?
Well that’s because 35 years of this graph is actually hindcast and 2 years are actual projection. The climate cult keeps updating graphs and calling them ‘projections’ when in reality they are all just hindcasts.
https://www.ipcc.ch/ipccreports/far/wg_I/ipcc_far_wg_I_full_report.pdf
Looking back at the first report with some of the early IPCC models, you can clearly see that CO2 emissions are already where they projected them for 2020 and in that scenario they projected the average global temperature to have warmed about 1.6 degrees C already. Only in climate science can you pretend you’ve accurately predicted something by predicting it after the fact.
Bob,
The modelers are attuned to the volcanic seismicity which couples into the atmosphere — or maybe it just reflects how Monday Morning Quarterbacking can explain what happened in the past.
Notice that Hausfather uses RCP4.5. I had no idea we have done so well with emissions. We can cancel alarmism then.
Good point. For those not familiar with latest IPCC CO2 scenarios: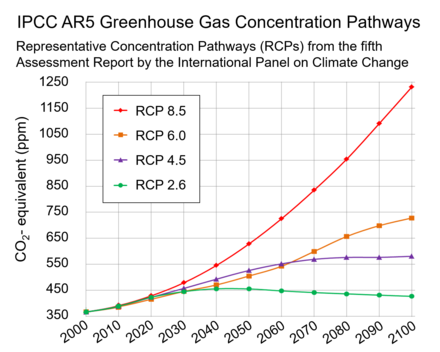
https://en.wikipedia.org/wiki/Representative_Concentration_Pathways
Zeke’s projection ends in 2020. Sixto’s graph from the IPCC shows virtually no difference in the various RCP’s up to 2020. Not sure there’s much traction here on that basis.
For a start this is what skeptics have been saying all along, that RCP 8.5 is not Business as Usual, but an unrealistic scenario set to scare people. The adoption of RCP 4.5 as the most likely pathway to compare with observations is a huge skeptic victory. This scenario stabilizes around +2°C, which means we achieve victory without doing anything.
I knew there as something off about that model spread, but I didn’t know what. Thanks for the heads up on that Javier.
Side note: Anyone else notice how the “Combined Uncertainty” in that graphic gets much larger as time goes on? Its looks double in size from 1990 to 2020.
The models are worse then that. Surface warming is predicated on tropospheric warming…
“Climate scientist John Christy of the University of Alabama-Huntsville has shown climate models show 2.5 times more warming in the bulk atmosphere than has been observed.”
So a large percentage of surface warming CANNOT be CO2 induced.
Just one of the many falsifications of the CACA hypothesis is the fact that under its assumptions, the air should warm before and more than the surface, but just the opposite has happened in the corrupt gatekeepers’ cooked books. Thus their unwarranted adjustments merely show more starkly the models’ failure.
Correct; Egads, the models are worse then we thought!
Well, there is a more simple explanation for this. Look at the satellite data and ground data. You will see they have peaks at the same times. This is good, it means they are in sync. The issue is that the surface temperature data is showing way in excess of the satellite data and then also doesn’t drop down (but drops) as far as the satellite data. The conclusion? You have but two realistic options:
1. Satellite series underestimates temperature.
2. Surface series overestimates temperature.
Now, one is a globally measured thing and the other is heavily reliant on infilling and adjustments to data, by the very people who think it should be showing more warming.
One suspects that there hasn’t been any statistically significant surface warming since 1998, with the exception of 2016.
Therefore, even RCP 4.5, is running way hot, even hotter than shown on the above graphs.
The fit before 2006 is a result of explicit parameter tuning in CMIP5 to best hindcast. The prediction starts at YB 2006. The fit is awful, and will remain awful after LaNina follows the 2015-16 El Nino spike.
If the prediction-projection starts in 2006, why are the scenarios biased below the observations then? Just curious.
Are you sure these runs aren’t from 2014?
And upon the outcomes from these models the UN-IPCC insist that all of the Western Nations must change their industrial and power generation policies.
I don’t know about you but that makes me so angry. Paris Accord be damned!
If the general public, which revels in its innumeracy (“hehehe…I can’t even balance my bank statement :-)” ever understands just how many decimal places warmists have to go to to “prove” a point…
Is this a really stupid question, and forgive me if it is, but isn’t comparing actual measurements against predicted averages rather like comparing apples and pears?
The first thing that strikes me is there are no El Niño/La Ninia events predicted in neither the average nor the uncertainty. It strikes me, as a non scientist, absurd that climate can be homogenised into an almost linear measurement with no extreme events. We know there are extreme events, they know there are extreme events, but none acknowledged other than by averaging.
Their version of climate change is like a bad cash-flow analysis of an ice cream company that goes bust in summer because it hasn’t allowed for the extra capacity needed to buy extra product and employ extra people. Of course, the reverse is also true, the company goes bust in winter because its carrying too much stock and employing too many people, just because average sales say’s the future’s rosy.
Simplistic nonsense. What planet do these scientific arseholes live on?
Looks like fake data, too.
Javier;
I see several locations where the temperatures appear to be above the model mean, starting at the extreme left of the graph. Is there an implied restriction you left out, or do I misinterpret the graph?
Take the average of the datasets, not the highest value at each point.
Since the tuning period back around 1980, the only time world temperatures have been above model “projections” have been during strong El Ninos.
Berkeley Earth climate scientist Zeke Hausfather said the models matched observed global SURFACE temperatures “quite well.”.
This graph supports Mr Hausfather’s assertion. However, have these 38 RCP25 models been adjusted through the use of hindcasting as one poster states here? I was extremely surprised to see this graph although I realise that it is surface and not mid tropsphere as shown in the John Christy graph presented to Congress showing the models running too hot.
Irrespective of the suspect readings of surface temperature stations due to the Urban Heat Island affect this Blended Model Observation Comparison looks suspiciously too neat.
Could someone here please enlighten me.
Thank you.
Zeke’s conveniently starts with global temps warmer than the models in 1970.
A bit late for Michael Mann to become skeptical, and even worse that his skepticism is aimed toward a study determining that the previous studies may be flawed. So, Mann is skeptical about skepticism?
Talk about hubris.
The few times I am wrong are when I questioned whether I might not be correct.
I’m not often wrong, but I’m always right.
🙂
I thought I was wrong once, but I was mistaken.
All their graph shows is that their friends are covering for them. UAH does not agree.
shouldn’t it be 21st century not 20th since we are in the 21st century, the 1900’s was the 20th…
Nothing like a breath of fresh air to improve the morning.
Well, well, well, they are starting to eat their own. The failure of models to replicate temperatures even ‘reasonably’ for 15-20 years is cause enough to have an overhaul of who is getting funded to produce them. Implementing GE’s method of firing the 10% least accurate modelers each year would soon instill some rigour into their works. We only need one good model.
If, after two years of funding your results are not in the top 2/3 in terms of matching the real world, you are out. In fact a first round cut of 2/3 of them would concentrate minds wonderfully.
Please run for election in whatever address you are most often in!
How many of these models have been “adjusted” and rerun with corrections to better approximate the actual measured data, and how many are reporting their past “future predictions” from the model as it was originally constructed? After much tweaking can these models even predict yesterday’s data?
All CMIP5 models were adjusted by parameter tuning from YE 2005 back to 1975 to best hindcast, per the published ‘experimental design, mandatory submission 1.2. None have been rerun; the CMIP5 results are archived permanently and publicly at KNMI. The fail is there for all to see. The best expose is in John Christy’s March 29, 2017 written Congressional testimony, also publicly available.
https://science.house.gov/sites/republicans.science.house.gov/files/documents/HHRG-115-SY-WState-JChristy-20170329.pdf
And then they include all those years in their model “performance.” Great job telling us what the temperature was going to be in years we already knew the temperature, champs.
I have a few questions about Mann and his ilk.
1 – Do they wear expensive cotton shirts?
2 – Do they enjoy having regular meals and/or eating in rather expensive restaurants as well as being warm in winter and cool in summer?
3 – What do they plan to say when winter comes early, stays past normal spring thaw, increases the snow pack thickness and extends its southern or northern** borders, and reduces crop growth periods, raising prices on foods/commodities that most of us take for granted, including heating fuels and electric power, AND this becomes a permanent weather fixture?
Those are just a few. I could come up with more, but I am having difficulty trying to understand people with that mentality.
**Referencing areas in the southern hemisphere subject to snowy winters, e.g., New Zealand and Chile and southern Argentina and even southern Africa. There’s been heavy winter snow in the Arabian peninsula, more than usual, including snow in Kuwait, which has not seen snow in anyone’s living memory, and snow sticking around in the Saharan dunes of Morocco, plus a very high snowpack in Chile (this season).
Sara,
weather I guess. Any other significance attached to it gets in to the realms of climatology voodoo science. Don’t go there.
I think charting the average of all the model outputs is not unlike calculating the average of a bowl of mixed nuts. You get a number that is meaningless. The average of disassociated data is an undefined value.
And then you compare it to suitably adjusted temperature data. The wonder here is: why is there so much divergence? When you can adjust both the models and the data, why are they unable to get a much better fit?
Insufficient attention.
“Close enough for government work.”
There is a limit to how much the crooked gatekeepers can cook the “surface data set” books, since the satellites are watching. Or at least UAH is. RSS has joined the Borg.
And if you lower the models’ outputs to agree with the “observations”, then you can’t get scary results.
Mother Nature shows that climate sensitivity is much lower than the “canonical” WAG of 3.0 degrees C per doubling, hence no worries. It”s probably below the lower bound of IPCC’s range of 1.5 to 4.5 degrees C.
Earth’s average temperature, in so far as it can be measured, has warmed since AD 1850 by far less than the 1.0 degree C claimed by “climate scientists”, ie shameless liars. It was just as warm in the 1930s as now, and the planet is yet again cooling, as it did for 32 years after WWII, despite rising CO2.
The jig is up. “Climate scientists” will have to get real jobs.
DP I agree. When you average the results of all the models, the implication is that each model is correctly predicting the future temperature anomalies, but each model is subject to a random error about this “correct” prediction, so that when averaged, the errors tend to cancel one another out. In other words, the average is more accurate than the individual results. This is pure nonsense, of course, because the models could be (and probably are) all wrong and predicting inaccurate results, since they are all based on the assumption that CO2 drives the Earth’s temperarture anomaly – an unproven and unfalsifiable conjecture. Since the Earth’s climate is a chaotic beast, some random, unexpected event can knock it off course and send it in a different direction. That’s what happens to weather predictions. They’re right until they become wrong, usually in about a week.. You can’t model chaos 100 years out.
“climate scientist Michael Mann”?
Oxymoron or editing error? or sarcasm – no then it wold be “”climate scientist” Michael Mann”.
Warmunists eating their own. Miles Allen writes a Nature paper on the provably obvious and Mann immediately says isn’t so. The models run hot for a simple reason. Computational intractability forces parameterization which drags in attribution via parameter tuning. And the AGW via GHG attribution assumption is simply wrong, yet there is no way to correct it without calling off the whole alarm. See guest post why models run hot for the basic problem ‘proof’. Reaction to this paper is another very visible indication of the wheels coming off the CAGW bandwagon.
Of course, you realise that the ramifications for conceding that the models are not merely incidentally wrong, but INHERENTLY wrong, are enormous. Jobs are on the line here! Under the circumstances, does anyone seriously believe that objective truth is important — or even relevant?
In the absence of sensible (i.e. capable of being sensed) warming, the best possible result for the Warmists is a slow, steady retreat, never admitting to fundamental flaws in their position and keeping the Deniers from achieving respectability. Control is vital.
If there is any warming, for any reason, the Warmists will win. Sure, it isn’t very scientific, but this game has been political from the outset
Zeke Horsefeathers sez; “climate model projections agree quite well with observed temperatures.”
Oh really? On what planet?
Some models agree on some level. The problem is, there are so many models to choose from, and if none agrees, you can invent your own. Observed and adjusted temps agree with some low -end models on the general warming trend. None the models predict in any detail, so belief in them is not based on their performance. The general trend is not much an achievement.
The spread of the climate models is like the side of a barn..
AND THEY STILL MISSED…
I thought they just took whatever correct stuff exists from each model and then pronounced that “the models are accurate”.
Hugs,
Yes, I’m reminded of a wise saying, “When you have many standards, you don’t have any standard.” If one can’t distinguish a good model (let alone the best) from a poor model, then you have nothing to guide you except the flip of a coin. I have maintained for some time that, logically, one can only have a single best model. To average the results of all the poor models with the best model results in a sub-optimal ‘projection’ of little skill.
When Doing precious metals fire assays over a body of ore that’s to be mined. Say 1,000 assays and a disposition of them are 10% very high and very low they’re discarted from the calculations to obtain a Mean value of that section being mined. But they are kept as a record of what to expect when mining that area.
When Doing precious metals fire assays over a body of ore that’s to be mined. Say 1,000 assays and a disposition of them are 10% very high and very low they’re discarted from the calculations to obtain a Mean value of that section being mined. But they are kept as a record of what to expect when mining that area.
Hate auto spell check… Disproportionate not disposition.
“Quite well” is the Monty Python equivalent of the Black Knight’s “flesh wound”.
“Settled” science?
If you figure out who the settlers are it all makes sense.
Fake law. Give a bunch of perpetually hungry class-action lawyers a carcass, and they’ll bûgger it, then rip at it, then howl before the cameras, then gnaw the bones loudly, then eventually give up when the Bear comes along and makes their parasitic existence less toothsome.
GoatGuy
Hopefully, the oil companies deal with it by cutting off all fossil fuel deliveries to these cities.
Yes, but it won’t be difficult or impactful. The lawsuit will fail for two easy reasons, both sayingnit is frivolous and should not have been brought. 1. No ability to prove imminent real harm. No way under US law to get damages to future speculative harm. As the judge in the equvalent Massachusetts lawsuit said in dismissing that suit against Exxon, “If the plaintiffs believe there will be SLR harm to Boston Harbor in 2050, perhaps they can refile in 2045.” 2. The oil companies are responsible for zero CO2 emissions. It is their customers who do the emitting. San Fransico should sue its own voting/driving population.
Maybe they’ll (Exxon, Chevron, BP, etc.) stop selling fuel in California. That’ll go a long to achieving the socialist utopia so many Californians want.
Time for moonbeam to build a wall around California. The warmunists wouldn’t all of us deplorables flocking to the left coast to partake in their budding utopia.
And if moonbeam won’t build the wall, Trump should extend the border wall to include California.
Maybe the citizens can counter sue the city for having used petrol fueled vehicle for decades.
It is possible to model electronic circuits where all the factors are known to within 1%.
To model climate within 1% where all the factors are not known is indeed a miracle. 1% of 300 °K is 3 °.C.
Which is to say. we know nothing. And the error bands get bigger the farther into the future you project.