Guest rant by David Middleton
Science denial not limited to political right
September 19, 2017
In the wake of Hurricanes Harvey and Irma, many claims have been made that science denial, particularly as it relates to climate change, is primarily a problem of the political right.
[…]
That’s like saying in the wake of [insert random words], many claims have been made that science denial, particularly as it relates to climate change, is primarily a problem of the political right.
The article actually gets worse as it goes along. It’s based on a “publication” by a grad student and psych professor. Unsurprisingly, the “paper” cites the following “references”…
Lewandowsky S., Oberauer K. (2016). Motivated rejection of science. Current Directions in Psychological Science, 25, 217–222. Link
Lewandowsky S., Oberauer K., Gignac G. E. (2013). NASA faked the moon landing—Therefore, (climate) science is a hoax: An anatomy of the motivated rejection of science. Psychological Science, 24, 622–633. Link
Mooney C. (2011, 9 30). Newt Gingrich deceives on stem cell research, mocks evolution. Retrieved on March 15, 2015, from http://thinkprogress.org/health/2011/09/30/332730/gingrich-deceives-stem-cell-research
Mooney C. (2012). The Republican brain: The science of why they deny science—And reality. Hoboken, NJ: John Wiley & Sons. Mooney C. (2014, 9 11). Stop pretending that liberals are just as anti-science as conservatives. Mother Jones. Retrieved from http://www.motherjones.com/environment/2014/09/left-science-gmo-vaccines
The “funny thing” about politically oriented skepticism, is that scientifically literate liberals are more likely to buy into the Gorebal Warming scam than scientifically literate conservatives:

Of course, this divergence could simply be due to the nature of the scientific literacy. Geoscientists are nearly three times more likely to think that climate change is natural than government employees are.

Featured Image

Re political persuasion and climate skepticism only in the US – no.
A Populus / PR Week poll in 2014 found only 30% of Conservative MP’s in the UK believe “it has been conclusively proven” that man is the main source of climate change. Meanwhile 73% of Labour and 67% of LibDem MP’s are convinced it has been proven.
30% of conservative MP’s are delusional?
70%
…Hey Sammy….D’OH !
Perhaps also Labor and LibDem majority have been regaining senses since Keith.
If not, it has potential to occupy alarmist minority with something genuinely anthropogenic. Hopefully conservative majority resists the temptation of running their own preferences though the existing hockey stick consensus producing computer models, but I wouldn’t bet on it.
In the minds of believers proof of global warming has been materialized with the advent of recent hurricanes and fires.
These catastrophes are what climate science predicted.(sarc)
20 year olds havent experienced bad weather in their lives.Its obviously due to climate change.
Do those who support the authors thesis — that Science Denial is a problem of both the Left and the Right — consider the rejection of Anthropogenic Climate Change, as represented by the IPCC 5th Assessment, to be an example of right wing science denial?
IPCC is not an academia, but a political round table. So, no.
In addition, the political initiative of IPCC was inspired by right-wing politician, prime minister and chemist Margaret Thatcher in the UN General Assembly on 8 November 1989. https://www.youtube.com/watch?v=VnAzoDtwCBg
So, the answer to your question on that account is also negative. She know what she was doing. While not considering Margaret Thatcher as a stereotype of anything, she may have even predicted her political adversaries painting themselves in the cAGW corner at the end. And that’s where politicians such as Al Gore are now arriving.
Since the IPCC 5th Assessment is 1) a summary of over 10,000 peer-reviewed scientific papers, and 2) is supported by the conclusions of every one of the 80 National Science Academies of the industrialized world, its rejection must be, by definition, an example of science denial.
Rejecting politically motivate lies is not denial of science. What is really sad is the fact these “National Science Academies” have sold their collective soul for a little bit of stolen money. They have no moral authority to dictate anything to anyone.
Sounds to me a bit like the produce of the first Council of Nicea.
“Rejecting politically motivate lies is not denial of science. What is really sad is the fact these “National Science Academies” have sold their collective soul for a little bit of stolen money. They have no moral authority to dictate anything to anyone.”
So your claim is that every national science academy ON THE PLANET, and thousands of researching climate scientists from all over the industrialized world, and 10s of thousands pf peer reviewed papers, ‘have sold their soul”? Who enforces this worldwide conspiracy of fraud?
Presumably an unsupported claim by a non publishing non researcher is to be trusted instead?
“So your claim is that every national science academy ON THE PLANET” Yes. They are all socialists/communists/leftists. They are all enemies of the human race, science and technology. You defend them, that makes you one of them. Case closed.
James Ardmore,
You said, “Who enforces this worldwide conspiracy of fraud?” It is self-enforced. Follow the money.
James, barely a third of the referenced material in the 5th Assessment has crossed the desk of anyone doing peer review. A lot of it is just propaganda from grant-seeking NGO’s. Remember the disappearing Himalayan glaciers from an earlier edition?
@2hotel9
You say in effect ‘all scientists are communists/leftists’.
Presumably you are not a communist. Therefore you don’t consider yourself a scientist. Based on the scientific content (or lack thereof) of your posts, neither do I.
Climate changes, constantly, humans do not cause it and can not stop it. There. Now you can move on and do something useful. My useful deed for the day? Going to pick corn for 8 hours or so, thanks to all that lovely CO2 in the atmosphere.
Same point. You need to explain why we should trust your unsupported claim, vs that of thousands of researching scientists around the world. Data, or your publication, please.
Hahahahahahahahahahaha!!!!!!!!! So, lets us get this straight, reality is an “unsupported claim” to you?!?!?!?! Wow, the stupid is strong in you. Let me clear this up, cupcake, climate changes, humans don’t cause it and can not stop it. Period. Full stop. Believe whatever fantastical religious fantasy floats your boat. Oh, and don’t get your panties in a twist because all us real human beings do not accept your religious fantasy bullshit. You sound an awful lot like a muslim throwing homosexuals off highrise roofs.
Here’s an excellent reason (bold mine):
“In sum, a strategy must recognise what is possible. In climate research and modelling, we should recognise that we are dealing with a coupled non-linear chaotic system, and therefore that the long-term prediction of future climate states is not possible. The most we can expect to achieve is the prediction of the probability distribution of the system’s future possible states by the generation of ensembles of model solutions. This reduces climate change to the discernment of significant differences in the statistics of such ensembles. The generation of such model ensembles will require the dedication of greatly increased computer resources and the application of new methods of model diagnosis. Addressing adequately the statistical nature of climate is computationally intensive, but such statistical information is essential.”
http://ipcc.ch/ipccreports/tar/wg1/505.htm
As I understand the situation, computer models are the sole source of evidence for AGW. If they are not, what evidence is used?
But according to the above:
1) We don’t understand the system we’re trying to model, therefore, prediction of future climate states is impossible
2) Even if we understood the system we don’t have the hardware to run a model that could approximate it.
3) Even if we had 1) and 2), we don’t know how to diagnose the model that we’ve built to ensure its accuracy.
The objectively verifiable, empirical evidence (i.e., the “data”) that all of the above is true is readily available to you with very little research required.
@sy computing
Models are never evidence;. They are merely the mathematical expressions of the physics of the atmosphere and climate. The evidence is in the DATA: rising global temperatures, increasing atmospheric greenhouse gas concentrations, melting global ice packs, rising sea levels, decreasing ph of the oceans, rising temperature of the seas, and so on. For which the only explanation of physics is the increasing atmospheric greenhouse effect caused (primarily) by Man’s burning of fossil fuels.
James:
“Models are never evidence;. They are merely the mathematical expressions of the physics of the atmosphere and climate.”
If the models “are never evidence”, then I submit that you have no evidence. The software model ensembles with their coded assumptions of the effects of CO2 and other GHG’s on the climate are critical to the theory of AGW. Without them AGW proponents have nothing.
Note carefully the following sentence from the IPCC section I quoted above:
“The most we can expect to achieve is the prediction of the probability distribution of the system’s future possible states by the generation of ensembles of model solutions. This reduces climate change to the discernment of significant differences in the statistics of such ensembles.”
Thus, the idea of AGW depends exclusively upon software models and these are coded with largely unproved assumptions regarding the physics of the atmosphere and climate.
” The evidence is in the DATA: rising global temperatures, increasing atmospheric greenhouse gas concentrations, melting global ice packs, rising sea levels, decreasing ph of the oceans, rising temperature of the seas, and so on.”
Here you have offered evidence (with which I agree) that the climate is changing, but that’s all. You’ve not identified why. We already know and can prove that the scenario above has happened before without Man’s intervention.
“For which the only explanation of physics is the increasing atmospheric greenhouse effect caused (primarily) by Man’s burning of fossil fuels.”
I categorically deny this assumption and now challenge you to prove it up to this group.
In so doing, however, since you’ve already agreed that models “are never evidence”, you may not use any atmospheric model, nor a paper utilizing the same to do so.
I think if you do more research you’ll find yourself becoming more and more skeptical of the theory of AGW.
@sy computing
“I categorically deny this assumption and now challenge you to prove it up to this group.” Arrhenius proved the physics of the greenhouse effect, and it’s operation has been confirmed by thousands of Antarctic ice core samples taken at Vostok and other locations. The Effect is the only confirmed physics phenomenon that fits the data. Got another?
What I have is reality. Climate changes constantly. Humans are not causing it and can not stop it. Prove that reality does not exist. Go for it.
Sam:
” Got another?”
I personally do not. But then I don’t really need one either, Sam.
If Arrhenius’ conclusions were conclusive regarding AGW there wouldn’t be any more need for debate. There would be no more studies, no more commissions, no more papers, etc. But there are more studies. There are more commissions. There are a plethora of papers published every day.
The IPCC doesn’t mention Arrhenius at all in it’s assessment of the state of climate science. Rather, it states this (bold mine):
“In sum, a strategy must recognise what is possible. In climate research and modelling, we should recognise that we are dealing with a coupled non-linear chaotic system, and therefore that the long-term prediction of future climate states is not possible.”
Regardless of Arrhenius, the long term prediction of future climate states is impossible.
And this:
“The most we can expect to achieve is the prediction of the probability distribution of the system’s future possible states by the generation of ensembles of model solutions.”
Which culminates in this most important conclusion:
“This reduces climate change to the discernment of significant differences in the statistics of such ensembles.”
The sum total description of the theory of AGW is reduced to a prediction of a future climate state based upon an as yet undeveloped software model of a system we don’t understand.
By “as yet undeveloped”, I mean because it is impossible to develop an accurate model of a system one cannot describe.
Thus, the solutions proposed by those in the AGW camp to “cure” climate change are akin to bloodletting as a cure for cancer.
So far Sam,you have not said anything useful for the rest of us.
Sam says, “Arrhenius proved the physics of the greenhouse effect.”
But, NASA says, “As Arrhenius predicted, both carbon dioxide levels and temperatures increased from 1900–1999. However, carbon dioxide in the atmosphere has increased much more quickly than he expected, but the Earth hasn’t warmed as much as he thought it would.”
Thus, Arrhenius hypothesis was incomplete at best, certainly not “proved.”
Sam goes on to say, “The Effect is the only confirmed physics phenomenon that fits the data. Got another?”
That is science back-a$$ward. First, one hypothesizes that Arrhenius’ work describes some phenomena in nature, then you collect data and, then (this is the hard part), it is the scientists job to prove that the only plausible explanation is that Arrhenius was correct; that no other plausible explanation could result in the same data (e.g., that it could not be natural variability, or some confounding additional condition creating correlation without causation).
In reply to James Ardmore .The theory of global warming depends on a tropical hot spot and this has never been located..The worlds climate was warmer in the 1930’s and 1940’s than it is now but the warm temperatures in the past have been tampered with. to make the present temperatures to be abnormal . there are many historical temperature records on individual sites around the world that show no warming or very little in the last 100 years . Why do we Question the science? Here in New Zealand we see the greatest advocates for global warming James Renwick and Jim Salinger write that the medieval warm period and the global optimum are inconvenient and they would like to erase them from the climate record .The IPCC is not a scientific body but it is a politically l driven activist ridden organization. There are many examples of this but one that comes to mind is that Ben Santer was a lead author and the scientists that were submitting papers for the 4th assessment stated that they could not find any human fingerprint of riing temperatures but Santer ignored this and wrote that the human signal was identified and that it would cause dangerous warming .And then we have Mikey Mans hockey stick which has been dbusted .I could go on for a week but the deeper you dig the more it smells .
The validity of the AGW theory does not require the observation of a ‘hot spot’.
The vaiidity of the AGW hypothesis requires that they nail down a climate sensitivity value and produce climate models that demonstrate predictive skill.
@David Middleton
“The vaiidity of the AGW hypothesis requires that they nail down a climate sensitivity value and produce climate models that demonstrate predictive skill.”
No it does not. All science is about error bars, and climate sensitivity estimates have a range of values, as all such parameters must have. And models are never evidence. The evidence for AGW is in the DATA.
Yes. All science has error bars. For the AGW hypothesis to be valid, the observations would track near the middle of the error range over a climate-relevant period of time, not near the bottom of the range over both climate-relevant time periods…
http://www.drroyspencer.com/wp-content/uploads/CMIP5-90-models-global-Tsfc-vs-obs-thru-2013-1024×921.png
AGW fails even on weather-relevant time periods…
If the CMIP5 model ensemble had predictive skill, the observations should track around P50, half the runs should predict more warming and half less than is actually observed. During the predictive run of the model, HadCRUT4.5 has not *tracked* anywhere near P50.
Note that during the 1998-99 El Niño, the observations spiked above P05 (less than 5% of the models predicted this). During the 2015-16 El Niño, HadCRUT only spiked to P55. El Niño events are not P50 conditions. Strong El Niño and La Niña events should spike toward the P05 and P95 boundaries.
The temperature observations are clearly tracking much closer to strong mitigation scenarios rather than RCP 8.5, the bogus “business as usual” scenario.
The red hachured trapezoid indicates that HadCRUT4.5 will continue to track between less than P100 and P50. This is indicative of a miserable failure of the models and a pretty good clue that the models need be adjusted downward.
In any other field of science CAGW would be a long-discarded falsified hypothesis.
AGW fails because the models yield a climate sensitivity that is about three times as large as the observations do.
If they produced a model ensemble that faithfully yielded a real-world climate sensitivity, they would confirm the AGW hypothesis and demonstrate that “business as usual” would stay just below the 1.5 C “limit.”
https://wattsupwiththat.com/2017/04/17/the-good-the-bad-and-the-null-hypothesis/
“The validity of the AGW theory does not require the observation of a ‘hot spot’.” CORRECT!!!!!!! It requires people to believe in a fake religious dogma. You are proof that simple minded “people” will believe any simple minded shiite that comes toddling along.
“The evidence for AGW is in the DATA” The data you “people” keep getting caught falsifying? That data?
James, the “hot spot” is one of the specific predictions made based on the AGW conjecture. But that doesn’t matter anyway since they have always been wrong on their PER DECADE warming predictions.
It takes only one failed prediction to render the conjecture into the dustbin.
NOT A WHOLE LOTTA GLOBAL WARMING GOIN’ ON!
Unlike the deeply flawed computer climate models cited by the IPCC, Bill Illis has created a temperature model that actually works in the short-term (multi-decades). It shows global temperatures correlate primarily with NIno3.4 area temperatures – an area of the Pacific Ocean that is about 1% of global surface area. There are only four input parameters, with Nino3.4 being the most influential. CO2 has almost no influence. So what drives the Nino3.4 temperatures? Short term, the ENSO. Longer term, probably the integral of solar activity – see Dan Pangburn’s work.
Bill’s post is here.
https://wattsupwiththat.com/2016/09/23/lewandowsky-and-cook-deniers-cannot-provide-a-coherent-alternate-worldview/comment-page-1/#comment-2306066
Bill’s equation is:
Tropics Troposphere Temp = 0.288 * Nino 3.4 Index (of 3 months previous) + 0.499 * AMO Index + -3.22 * Aerosol Optical Depth volcano Index + 0.07 Constant + 0.4395*Ln(CO2) – 2.59 CO2 constant
Bill’s graph is here – since 1958, not a whole lotta global warming goin’ on!
My simpler equation using only the Nino3.4 Index Anomaly is:
UAHLTcalc Global (Anom. in degC, ~four months later) = 0.20*Nino3.4IndexAnom + 0.15
Data: Nino3.4IndexAnom is at: http://www.cpc.ncep.noaa.gov/data/indices/sstoi.indices
It shows that much or all of the apparent warming since ~1982 is a natural recovery from the cooling impact of two major volcanoes – El Chichon and Pinatubo.
Here is the plot of my equation:
https://www.facebook.com/photo.php?fbid=1106756229401938&set=a.1012901982120697.1073741826.100002027142240&type=3&theater
I added the Sato Global Mean Optical Depth Index (h/t Bill Illis) to compensate for the cooling impact of major volcanoes, so the equation changes to:
UAHLTcalc Global (Anom. in degC, ~four months later) = 0.20*Nino3.4IndexAnom + 0.15 – 8*SatoGlobalMeanOpticalDepthIndex
The “Sato Index” is factored by about -8 and here is the result – the Orange calculated global temperature line follows the Red actual UAH global LT temperature line reasonably well, with one brief deviation at the time of the Pinatubo eruption.
Here is the plot of my new equation, with the “Sato” index:
https://www.facebook.com/photo.php?fbid=1443923555685202&set=a.1012901982120697.1073741826.100002027142240&type=3&theater
I agree with Bill’s conclusion that
THE IMPACT OF INCREASING ATMOSPHERIC CO2 ON GLOBAL TEMPERATURE IS SO CLOSE TO ZERO AS TO BE MATERIALLY INSIGNIFICANT.
Regards, Allan
The only problem with your thesis is that it is wrong– as shown by scientists since Arrhenius in 1896, and confirmed by the Vostok ice core samples going back 400,000 years, and other Antarctic ice cores from 800,000 to 400,000 years before present.
So, all you have is your “feelings”, much the same as Jim Jones did at Jonestown. How many people you willing to see dead to justify your “feelings”?
James Ardmore – you are utterly ignorant on this subject.
You clearly fail to grasp the key elements of the scientific method and are merely repeating sound bytes from those as ignorant as yourself.
@Allan Macrae
Do you find personal attack your only tool when you have no science based response?
James, Arrhenius updated with a new paper in 1906,greatly reducing the postulated CO2 warm forcing effect. He also wasn’t worried out it either.
What was confirmed by Ice cores?
You are so vague.
“Sam Best
September 21, 2017 at 6:47 pm Edit
@Allan Macrae
Do you find personal attack your only tool when you have no science based response?”
James made NO such science based reply.
Meanwhile Allan made a long post using real data and charts to make case. That was NEVER addressed at all, by Jimmy.
You have anything better to offer?
@sunsettommy
‘You are so vague’.
If you don’t understand the Vostok ice core core data, that Would explain why you don’t understand the connection between atmospheric CO2 and climate. Back to first year physics, sunsettommy..
James Ardmore Griffy and other believers ,.extend your knowledge and read very carefully a more recent post on WUWT . A presentation by Dr W C Rusty Riese to the Houston Geological Society in May 2014.This is essential reading for all that have been hoodwinked into believing that CO 2 controls the climate
The fact that atmospheric CO2 controls the climate has been known since Arrhenius discovered the atmospheric Greenhouse Effect in 1896.
The atmosphere is not air in a bottle.
@David Middleton
“The atmosphere is not air in a bottle.”. No kidding. That’s supposed to disprove the work of hundreds of scientists since Arrhenius?
It just demonsteates the irrelevance of Arhenius. The failure to model the climate with predictive skill falsifies the AGW hypothesis.
Once again, Ignorant Jimmy fails to know that Arrhenius changed his position with his 1906 science paper,that greatly dialed back the CO2 effect.
Meanwhile you have yet to notice a massive AGW based failure from 1990 on wards.
David Middleton September 21, 2017 at 4:52 pm
The atmosphere is not air in a bottle.
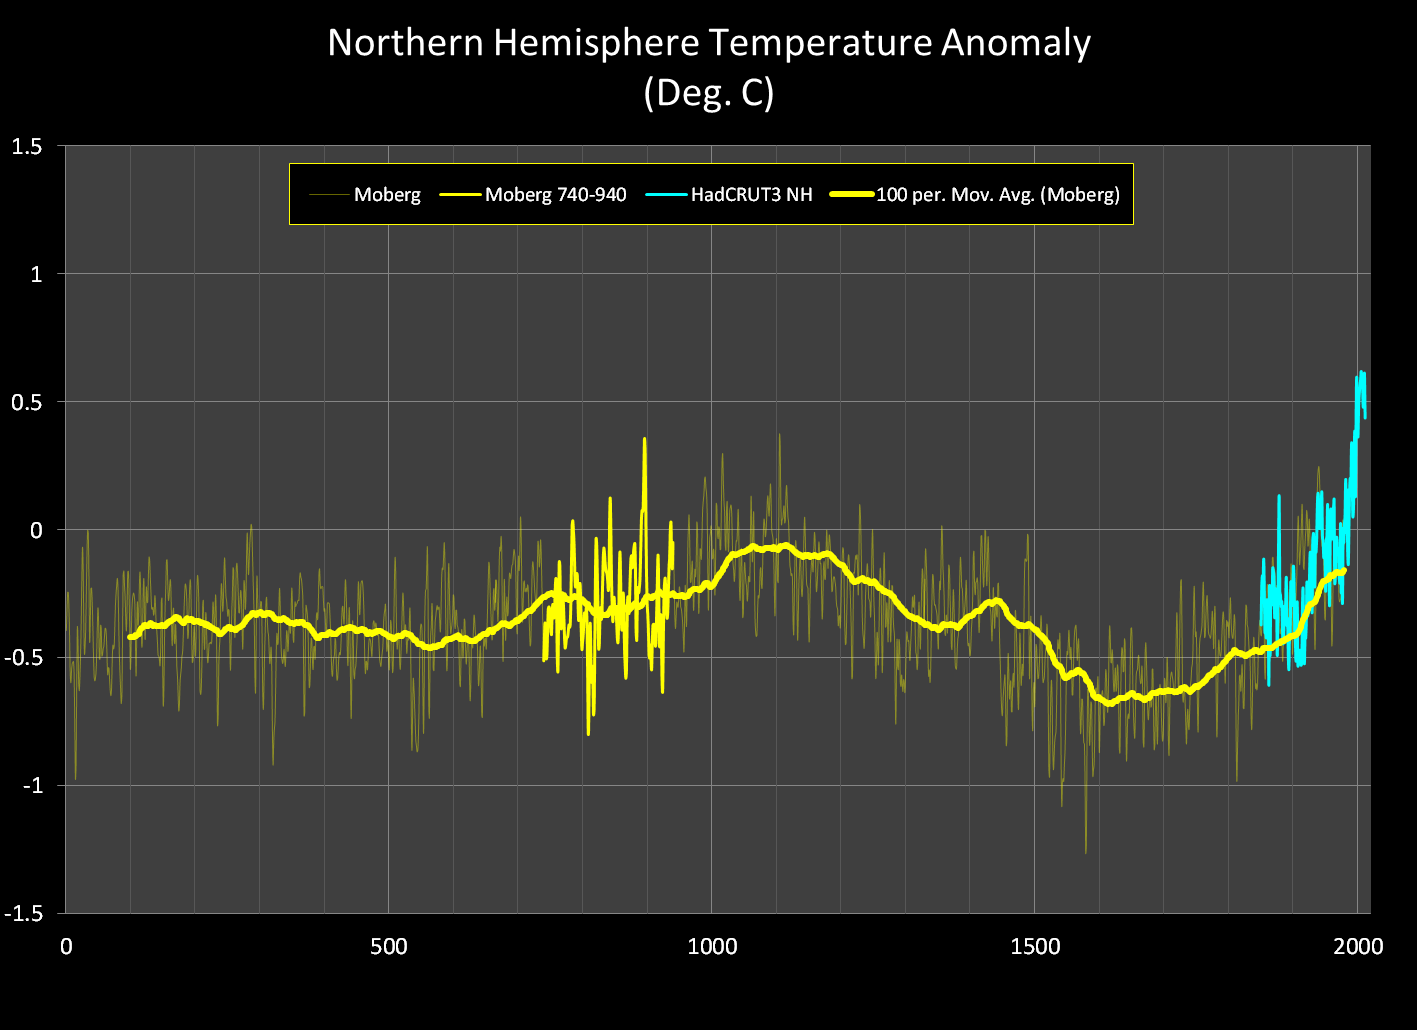
And that’s not the Law Dome CO2 either. Perhaps you’ve used ‘Mike’s trick’, although unlike him you’ve not indicated that you spliced data or said where the data you’ve spliced came from?
You are correct. MLO is spliced onto the end of the graph. I just happened to grab that one because it clearly and simply demonstrated the lack of pre-industrial correlation between CO2 and temperature.
Here is a more clearly and accuratly annotated graph…
And… Mann 2008 did not clearly indicate that the instrumental data were spliced in. You had to dig through the SI to figure that out… Which was an improvement over MBH 98/99.
David Middleton September 22, 2017 at 6:35 am
You are correct. MLO is spliced onto the end of the graph. I just happened to grab that one because it clearly and simply demonstrated the lack of pre-industrial correlation between CO2 and temperature.
I’m sure you’re aware that the expectation is that T would correlate with log(CO2) but since that’s inconvenient for your narrative you plot [CO2], if you were honest about it you would at least plot vs log([CO2]).
For future reference perhaps you could use a graph which clearly indicates the source of the data:
http://blogs.egu.eu/divisions/cr/files/2016/12/Fig5.jpg
and include the legend:
Figure 5: 1000 years of atmospheric CO2 concentrations from various Antarctic ice cores (DML, South Pole, Law Dome and Siple Dome) and the direct measurements in Mauna Loa Observatory [Credit: Ashleigh Massam, compiled from open access data sources]
And… Mann 2008 did not clearly indicate that the instrumental data were spliced in. You had to dig through the SI to figure that out… Which was an improvement over MBH 98/99.
Only if you can’t read! You can’t get much clearer than a label on the graph (MBH 98) which says; “Actual Data (1902-1995)” and a legend which says: “Time reconstructions (solid lines) along with raw data (dashed lines)”. Similarly in MBH99: “Instrumental Data (1902-1998).
In the 2008 paper the reconstruction was plotted against “decadally smoothed CRU NH land mean series (thick black curve)” which was clearly indicated in the figure legend and in the figure title “NH EIV vs CRU series”. There was certainly no need to “dig through the SI” as you incorrectly assert.
In the pre-DE08 Law Dome cores, which covers the Medieval Warm Period, there is no correlation. In the higher resolution DE08 core (since 1833), there is a fair correlation…

If you download any of the Mann 2008 reconstructions, you get a tine series that does not differentiate the proxy from the instrumental data.


To see an example of “Mike’s Nature Trick,” go here… Proxy-based reconstructions of hemispheric and global surface temperature variations over the past two millennia
Click this… EIV Temperature Reconstructions
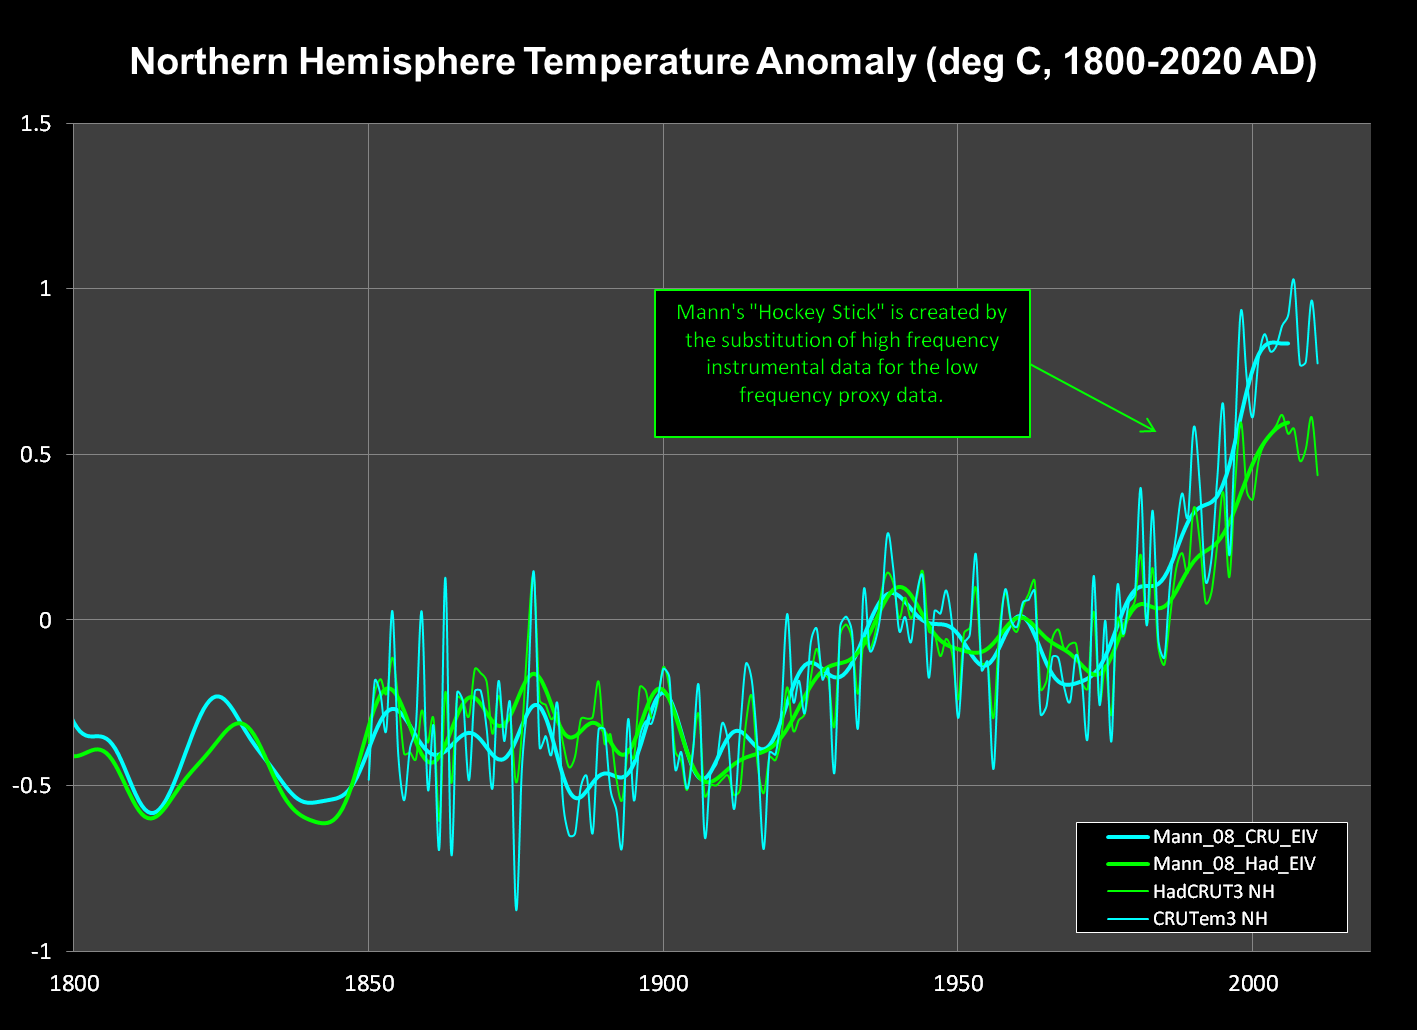
Open up any of the **cru_eiv_composite.csv or **had_eiv_composite.csv files. All of them splice the high frequency instrumental data into the low frequency proxy data. To Mann’s credit, unlike his previous “tricks,” he at least documents this one enough to sort it out in the SI.
This statement from their PNAS paper is totally unsupported by proxy reconstructions… “Recent warmth appears anomalous for at least the past 1,300 years whether or not tree-ring data are used. If tree-ring data are used, the conclusion can be extended to at least the past 1,700 years.”
The anomalous nature of the “recent warmth” is entirely dependent on the “tricky” use of the instrumental data. He didn’t use any proxy data post-1855.
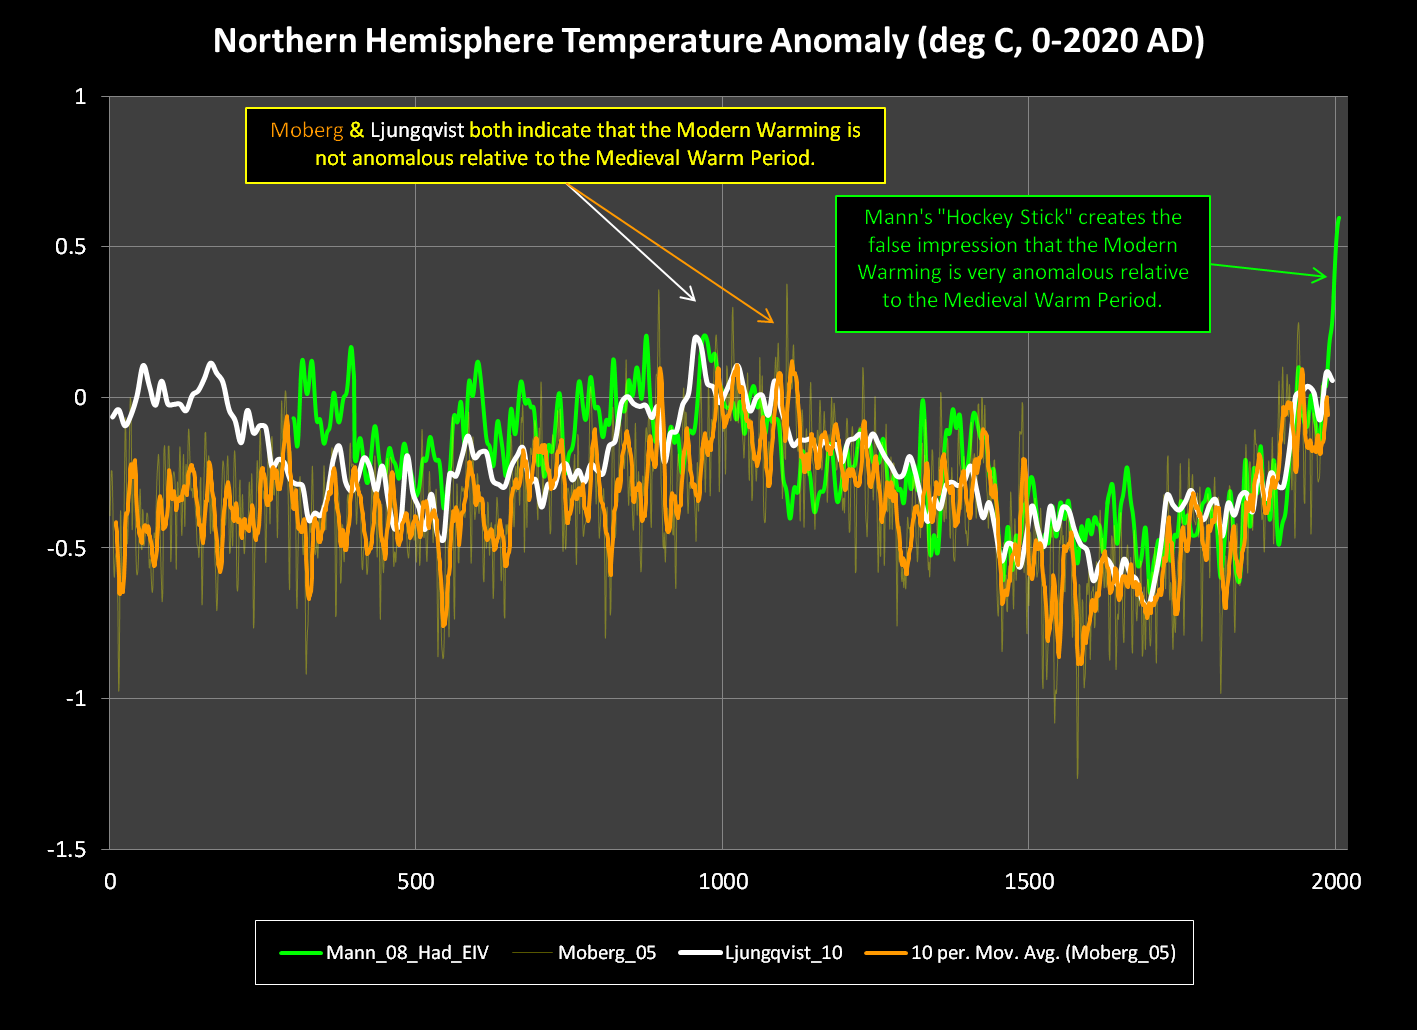
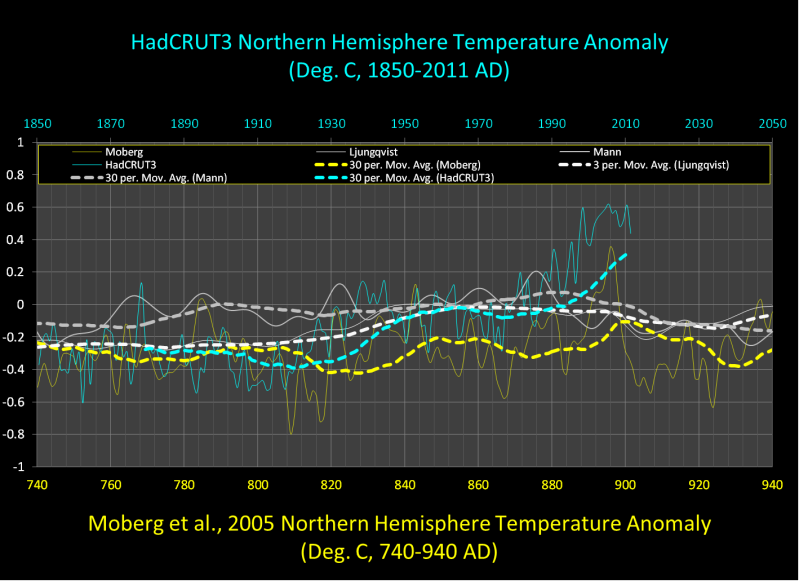
This image from Mann’s 2008 paper falsely implies that all of the reconstructions are in general agreement regarding the claim that the “recent warmth appears anomalous for at least the past 1,300 years”…
By cluttering up the image with many reconstructions and plastering the instrumental record onto end of the graph, it’s impossible to see any details.
Here are Mann (Had_EIV), Moberg and Ljungqvist without the clutter…
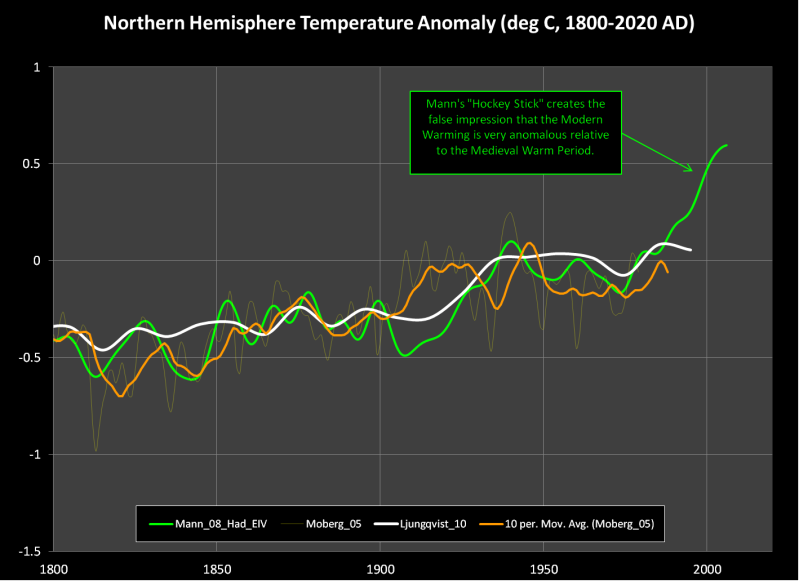
Zoomed in on post-1800…
And Mike’s Nature Trick…
The Modern Warming appears anomalous because of the higher resolution of the instrumental record, it’s position at the tail-end of the time series and the negative deflection of the Little Ice Age trough (ca 1600 AD)…
If the Modern Warming is directly compared to the Medieval Warm Period, it appears to be far less anomalous, despite ithe better resolution of the instrumental record…
Particularly if you clutter the image with multiple reconstructions…
The Modern Warming might be 0.2-0.4°C warmer than the Medieval Warm Period. This would be consistent with a climate sensitivity of 0.5-1.0°C per doubling of the pre-industrial atmospheric CO2 level (as opposed to ~3.5°C). Although the difference between the modern warming and MWP is well within the margins of error of the proxy and instrumental reconstructions and could easily be explained by the higher resolution of the instrumental record.
David Middleton September 22, 2017 at 9:24 am
If you download any of the Mann 2008 reconstructions, you get a tine series that does not differentiate the proxy from the instrumental data.
Whereas if you actually read the papers rather than downloading improperly annotated graphs you’d see that your statement is incorrect!
For example from the PNAS2008 paper the legend for Fig 2 says: “NH reconstructions (colored curves; 95% confidence intervals shown by lightly shaded regions of similar color) with decadally smoothed CRU NH land mean series (thick black curve)”
Open up any of the **cru_eiv_composite.csv or **had_eiv_composite.csv files. All of them splice the high frequency instrumental data into the low frequency proxy data. To Mann’s credit, unlike his previous “tricks,” he at least documents this one enough to sort it out in the SI.
As pointed out previously and above this is not true, perhaps you should try reading the papers!
This statement from their PNAS paper is totally unsupported by proxy reconstructions… “Recent warmth appears anomalous for at least the past 1,300 years whether or not tree-ring data are used. If tree-ring data are used, the conclusion can be extended to at least the past 1,700 years.”
The anomalous nature of the “recent warmth” is entirely dependent on the “tricky” use of the instrumental data. He didn’t use any proxy data post-1855.
Again read the ‘damned paper’, you clearly misunderstand the proxy data, he used plenty of proxy data post-1855, you failed to understand that the date 1855 refers to the starting years for the proxy data set.
This image from Mann’s 2008 paper falsely implies that all of the reconstructions are in general agreement regarding the claim that the “recent warmth appears anomalous for at least the past 1,300 years”…
If you had read the paper instead of just the abstract you’d find this in the discussion of those results:
“Although the EIV and CPS reconstructions essentially agree within uncertainties back to A.D. 1000 (Fig. 3B), there are nonetheless some significant systematic differences in the implied long- term temperature histories over that time frame. The EIV reconstructions suggest that temperatures were relatively warm (comparable with the mean over the 1961–1990 reference period but below the levels of the past decade) from A.D. 1000 through the early 15th century, then fell abruptly. By contrast, the CPS reconstructions indicate more uniformly colder conditions, with peak Medieval warmth that does not breach the mean warmth of modern reference period (1961–1990), and a long-term, more steady decline in temperatures before 20th century warming.”
“Before A.D. 1000, there is somewhat less agreement between the various reconstructions. In particular, reconstructions based on variants of the CPS method tend to be significantly cooler than (and outside the uncertainties of) the EIV reconstruction. Investigating the sources of these differences, we first established that the removal of the seven proxy series in our database identified a priori as having potentially spurious features, has no significant impact on the CPS (or EIV) reconstructions (SI Text and Fig. S8). However, we observed that the pronounced cooling between approximately A.D. 750 and A.D. 1000 in the current CPS reconstruction is based on prominent excursions in a relatively small number (see Fig. S9) of the 15 NH proxy series available in the screened network back through the 9th century and that the amplitude of the cooling is somewhat sensitive to the removal of individual proxy records”
“Conclusions are less definitive for the SH and globe, which we attribute to larger uncertainties arising from the sparser available proxy data in the SH. Given the uncertainties, the SH and global reconstructions are compatible with the possibility of warmth similar to the most recent decade during brief intervals of the past 1,500 years.”
Thank you gwan – Dr. Reise has a provided good 43 minute presentation here.
https://wattsupwiththat.com/2017/09/20/from-the-the-stupid-it-burns-department-science-denial-not-limited-to-political-right/comment-page-1/#comment-2616789
However, neither Mr. Ardmore or Mr. Best have demonstrated the intellect to absorb a 43 minute lecture that actually contains real data.
James,make clear he is a profound science illiterate:
“The atmosphere is not air in a bottle.”. No kidding. That’s supposed to disprove the work of hundreds of scientists since Arrhenius?”
The fallacies and ignorance is obvious here on Jimmy,who has never caught up with that 1906 paper.
James Ardmore,
still has not realized that even the IPCC doesn’t agree with the 1896 Arrhenius paper either. His 1906 paper showed that he reduced the CO2 warm forcing effect by more than 50%.
You are poor at this.
You seem unable to rationalize the findings of thousands of climate scientists (i.e., AGW) with the non published critiques of a few amateurs who have no consistent physics- based explanation for industrial age planetary warming.
In short, you publish nothing in peer reviewed journals, you have no chance consistent hypothesis, and your explanations for this situation vary from fraud to conspiracy to critiques that change from day to day, yet gain zero traction among real scientists.
This is no contribution to science. Or to humanity.
[In the event you wish to change people’s minds to suit your own view on here your time would be better spent using arguments rather than just appealing to authority. There are a lot of smart, published, folk who contribute and comment on WUWT. Tell them why they are wrong . . . mod]
@mod
Have you really read the personal attacks (‘ignorant’ is typical) and snide comments about ‘true believers’ and ‘alarmists’ lodged against me and others who argue in favor or peer reviewed science? How about a more even handed approach to moderating?
@mod’.
‘Appeal to authority? “Appeal to authority ‘ as you are using it means appealing to those IN AUTHORITY — which I do not do. I appeal to the opinion of experts — those doing the research. Expert opinion is exactly what is needed on this forum.
JA, you do not seem to understand what “appeal to authority” is. Stating that something is settled because Doctor Doofus says so, without actually using Doofus’ evidence or arguments.
Flatly stating that the IPCC has a direct line to Truth is only slightly parodying your fallacy, and you are acting like a Jehovah’ Witness or a Marxist in your style.
James:
“Have you really read the personal attacks (‘ignorant’ is typical)…”
Bah. Mr. Macrae offered you evidence from his own work. He did it. Notice his name in one of the graphs. That took his time and expertise and was done for your edification as well others who read here.
And what do you do???
Your response was the intellectual equivalent of saying, “That’s just bullsh*t”.
Therefore, he rightly reproved you for being ignorant. The term is not a “personal attack”, the term denotes a state of being. If he’d said something like, “You idiotic, stupid, pathetic, MORON…” well that would have been an ad hominem attack.
Rather, he spared you the mockery that you certainly deserved and rather called you out for what you are: Ignorant of the subject matter about which you’re trying to speak.
Why are you here, dude? You seem to have made up your mind already. You don’t ask questions. You make ignorant claims you can’t substantiate. You ignore contrary arguments.
What benefits you in coming here and getting your clock cleaned?
Would you not be better served by trying to learn something?
This is an amazing profile of a typical climate sceptic who is determined to deny the science underpinning climate change. The journalist has got it absolutely spot on:
‘Climate deniers want to protect the status quo that made them rich’
https://www.theguardian.com/environment/2017/sep/22/climate-deniers-protect-status-quo-that-made-them-rich
Mr. Best,
you are vague too since you never explained why you bring up the ice cores,quoting James:
“The only problem with your thesis is that it is wrong– as shown by scientists since Arrhenius in 1896, and confirmed by the Vostok ice core samples going back 400,000 years, and other Antarctic ice cores from 800,000 to 400,000 years before present.”
I asked the question which NEITHER you or James have answered,
“What was confirmed by Ice cores?”
LOL
Read the context. The connection between atmospheric CO2 ppmv and temperature was confirmed. Did you not know this?
James, there are a number of published science papers showing CO2 lags temperature. Not only that most skeptics accept the basic CO2/temperature relationship. The connection hasn’t been disputed for a long time now,thus your statement is either out of date or just plain wrong.
Timing of Atmospheric CO2 and Antarctic Temperature Changes Across Termination III
“Abstract
The analysis of air bubbles from ice cores has yielded a precise record of atmospheric greenhouse gas concentrations, but the timing of changes in these gases with respect to temperature is not accurately known because of uncertainty in the gas age–ice age difference. We have measured the isotopic composition of argon in air bubbles in the Vostok core during Termination III (∼240,000 years before the present). This record most likely reflects the temperature and accumulation change, although the mechanism remains unclear. The sequence of events during Termination III suggests that the CO2 increase lagged Antarctic deglacial warming by 800 ± 200 years and preceded the Northern Hemisphere deglaciation.”
http://science.sciencemag.org/content/299/5613/1728.full
I have known about this paper since 2006.
James, this is an appeal to consensus and Authority when you make blanket statements like this:
“The only problem with your thesis is that it is wrong– as shown by scientists since Arrhenius in 1896,…”
and,
“The fact that atmospheric CO2 controls the climate has been known since Arrhenius discovered the atmospheric Greenhouse Effect in 1896.”
and,
” No kidding. That’s supposed to disprove the work of hundreds of scientists since Arrhenius?”
You said NOTHING of scientific value in your silly fallacious statements.
You’re the one saying nothing of value. My appeal is to the EXPERTs, not to anyone in ‘authority’, about which you seem to have your shorts in a knot. You are not an expert, nor do you accept the decades of peer reviewed research by the experts. That’s not just ignorance, it’s purposeful no-nothingism
Sam does it again, ignores this statement I made to James,
“still has not realized that even the IPCC doesn’t agree with the 1896 Arrhenius paper either. His 1906 paper showed that he reduced the CO2 warm forcing effect by more than 50%.”
Never gives a detailed reply to Allan or David either. Just fallacies and he STILL employs a fallacy,
“….My appeal is to the EXPERTs, not to anyone in ‘authority’, about which you seem to have your shorts in a knot. You are not an expert, nor do you accept the decades of peer reviewed research by the experts….”
You are sinking deep into Troll land. You are stupid as hell since you STILL offer no debate at all,still do not answer science based statements and charts either.
By the way Sam, you have been asked by a Moderator to drop your Fallacies,provide an argument instead.
“[In the event you wish to change people’s minds to suit your own view on here your time would be better spent using arguments rather than just appealing to authority. There are a lot of smart, published, folk who contribute and comment on WUWT. Tell them why they are wrong . . . mod]”
When are you going to DEBATE?
An appeal to “experts” is an appeal to authority. It’s not an appeal to those in power. Argumentum ad verecundiam is an appeal to a person who is an authority in a subject. Citing a peer reviewed paper is not an appeal to authority. Citing an otherwise upsupported quote from the author is an appeal to authority.
Thank you Sunsettommy for taking the time to dissect the latest nonsense from the tag team of Ardmore and Best.
I was reluctant to respond further to either of them on grounds of principle – “I decline to engage in an intellectual duel with a unarmed man”. 🙂
I wrote in 2015 how I think the alleged global warming crisis will end – with global cooling – which I (we) originally predicted in a 2002 article to commence by 2020-2030. I now think mild global cooling will start by about 2020 or sooner, although this timing is very difficult to predict with accuracy.
I hope to be wrong about this prediction, because society is unprepared for a global cooling cycle, and energy systems have been compromised by global warming alarmist nonsense and dysfunctional green energy schemes.
Regards, Allan
https://wattsupwiththat.com/2015/01/30/what-are-your-fears-about-global-warming-and-climate-change/#comment-1847733
Hypothesis:
1. The next act of this farce will be characterized by global cooling starting by about 2020 or sooner, cooling that may be mild or severe. Global cooling will demonstrate that climate sensitivity to increasing atmospheric CO2 is so small as to be insignificant. The scientific credibility of the warmist gang will be shattered and some may face lawsuits and/or go to jail.
2. The scientific community will gradually accept the fact that CO2 lags temperature at all measured time scales, and that temperature (among other factors) drives atmospheric CO2 much more than CO2 drives temperature.
3. The foolish green energy schemes to “stop global warming” will be shelved and dismantled, but not before they contribute to a significant increase in Excess Winter Mortality, especially in Europe and to a lesser extent in North America, where energy costs are much lower (thanks to shale fracking).
4. The warmist thugs will still be bleating about a warmer world, wilder weather, etc., all caused by the sins of mankind, but nobody will listen.
Regards to all, Allan
Your ‘prediction’ of global cooling has no supporting science or evidence. Worthless.
James Hansen seems to believe it does:
“Who else is speculating about abrupt cooling? One name which might surprise you is former NASA GISS director James Hansen. From Ice melt, sea level rise and superstorms: evidence from paleoclimate data, climate modeling, and modern observations that 2 ◦C global warming could be dangerous p3774;”
https://wattsupwiththat.com/2016/07/02/are-scientists-preparing-for-a-flipflop-back-to-global-cooling-predictions/
@sy computing
Hansen…who was never and is not now an advocate of global cooling…in the passage you quote, writes about REGIONAL cooling in the oceans, due to mixing effects. In the same paragraphs, he refers to heat imbalance …the excess of energy inflow over outflow from the earths system….which drives global temperature RISE.
Ardmore wrote: “Your ‘prediction’ of global cooling has no supporting science or evidence. Worthless.”
Kindly search “global cooling” on this (wattsupwiththat) website and you will find plenty of evidence.
The notable thing about my (our) 2002 prediction is it was one of the earliest, and hence one of the most controversial. Since then, solar activity has crashed in SC24 and SC25 is also looking weak.
Time will tell, and I hope to be wrong on this prediction.
James:
Well you wouldn’t expect him to do a complete about-face right off the bat would you? That would be embarrassing.
But compare the conditions he admits will occur with the paper listed in the article:
First the paper (bold mine):
And then from Hansen (bold mine):
I might be misreading things but it appears that according to the Henry, et al., paper, a slowdown of the Atlantic Meridional Overturning Circulation indicates a cooler global climate. Hansen seems more than willing to admit at least the entirety of Europe is going to cool because of the same. Furthermore, he’s also suspiciously squishy regarding how his assessment differs “fundamentally from existing climate change assessments”, presumably because according to AGW the world is supposed to catch on fire soon.
Sounds to me like Mr. Hansen could be prepping for a CYA moment should he need it.
@sy computing
You’re still hunting for confirmation in the writings of Jim Hansen..that he predicts world COOLING, not warming. Well, you haven’t found it in his writings, including the one you quoted, and never will. He refers to REGIONAL cooling, not Global.youve missed the entire point, again….that the earths thermal energy inflows exceed energy outflows, driving a net global avg temperature RISE.
‘Worthless’ remains an apt description of global cooling predictions.
It also seems you’ve attempted an appeal to authority, not realizing that the authority contradicts your very proposition.
“It also seems you’ve attempted an appeal to authority, not realizing that the authority contradicts your very proposition.”
Oh dear. My mistake.
@Allan Macrae
‘Since then solar activity has crashed’
You should compare the magnitude of greenhouse climate forcing with solar. Solar irradiance changes are insignificant.
Ardmore, your last comment is contradicted by the above post on this page, among other evidence.
https://wattsupwiththat.com/2017/09/20/from-the-the-stupid-it-burns-department-science-denial-not-limited-to-political-right/comment-page-1/#comment-2615837
Your comments are nonsense – sound bites from the warmist dictionary, unsupported by evidence.
The warmist argument is based on an ASSUMED high value of climate sensitivity to increasing atmospheric CO2 (“ECS”), which is THE key falsehood in the warmist scam. The overwhelming evidence is that ECS is low, about 1C/{2xCO2) and probably less, and increasing atmospheric CO2 will NOT cause dangerous global warming. Other warmist falsehoods such as wilder weather, etc. are also unsupported by the evidence.
The fact that NONE of the warmists’ scary predictions have materialized in the 30+ years of this debate is further evidence that they have negative scientific credibility, and nobody should believe anything they say.
Global warming alarmism is a multi-trillion dollar scam that has caused enormous harm to humanity and the environment.
Global warming alarmism has driven up energy costs and reduced grid reliability in the developed world, and denied access to cheap reliable energy in the developing world. This scam has increased excess winter mortality worldwide and has also increased illness and death due to energy poverty in the developing world.
It is the obligation of responsible, competent professionals to blow-the-whistle on this scam, and to encourage the availability of cheap, reliable, abundant energy systems for humanity. This is especially true for the elderly and the poor, and for the struggling peoples of the developing world.
Once again,Sam exposes his lack of understanding on what Science research really is,
“You seem unable to rationalize the findings of thousands of climate scientists (i.e., AGW) with the non published critiques of a few amateurs who have no consistent physics- based explanation for industrial age planetary warming.”
Appeal to consensus and Authority. Two Fallacies,oh my……
Congratulations!
By the way there are THOUSANDS of published science papers that doesn’t agree with the AGW conjecture:
1350+ Peer-Reviewed Papers Supporting Skeptic Arguments Against ACC/AGW Alarmism
http://www.populartechnology.net/2009/10/peer-reviewed-papers-supporting.html
It is NOT settled science!
Sam goes on,
“In short, you publish nothing in peer reviewed journals, you have no chance consistent hypothesis, and your explanations for this situation vary from fraud to conspiracy to critiques that change from day to day, yet gain zero traction among real scientists.”
Another worthless statement,since you have yet to answer a simple question I asked James. Not only that you and Jimmy have yet to answer to the charts and science behind it,posted by Allan and David or anyone else who post something of science.
Snicker…..
More silly Sam,
“This is no contribution to science. Or to humanity.”
You and James have yet to address anything others have posted here,including Allan and Davids charts presentation. You have contributed NOTHING of value here……
So far you are in Troll land, as you have avoided a real debate,just fallacies and whining to the Mods.
You need to dig in with something of real science stuff.
Neither has Sam or James responded to my statements about the Arrhenius papers at all.
I posted several different times these comments,that they avoid so far:
“James, Arrhenius updated with a new paper in 1906,greatly reducing the postulated CO2 warm forcing effect. He also wasn’t worried out it either.”
and,
“Once again, Ignorant Jimmy fails to know that Arrhenius changed his position with his 1906 science paper,that greatly dialed back the CO2 effect.”
and,
“The fallacies and ignorance is obvious here on Jimmy,who has never caught up with that 1906 paper.”
and,
“still has not realized that even the IPCC doesn’t agree with the 1896 Arrhenius paper either. His 1906 paper showed that he reduced the CO2 warm forcing effect by more than 50%.”
after all these comment about Arrhenius, James chose to ignore them completely. He whines about me instead,
“@mod
Have you really read the personal attacks (‘ignorant’ is typical) and snide comments about ‘true believers’ and ‘alarmists’ lodged against me and others who argue in favor or peer reviewed science? How about a more even handed approach to moderating?”
YOU show profound ignorance on how good science research works. You make fallacious statements with ZERO science details,avoid simple questions and statements that indicate that you have NOTHING beyond fallacies to offer.
Several people here made clear statements that could be addressed in detail,but you chose not too,just write fallacies which are WORTHLESS!
When are you going to actually debate something?
Science is about standing on the shoulders of previous researchers and adding your own research, pushing the frontiers forward. You dismiss the peer reviewed science, and claim your simple posts trump the work of actively researching climate scientists. Ignorance is not a sin. Purposeful ignoring of peer reviewed research is.
My gosh, James doesn’t know when to stop avoiding the debate. Just another stupid statement is all you can drag up,avoiding my inviting you to debate what Arrhenius said in 1896 and 1906. You avoid it completely, because you have no idea what he wrote.
Most warmists don’t even know he updated his research,published it in 1906.They always talk about the 1896 paper,as if that was his only paper on the subject. This is a typical example of warmist ignorance.
I made a specific statement about the CHANGE in his later 1906 paper that showed he UPDATED his research by reducing the postulated warm forcing of CO2 by over 50%. He had responded to several scientists of the day,which means he was receptive to constructive criticism,which is why his 1906 was an UPDATE over his older one.
I wrote,
““still has not realized that even the IPCC doesn’t agree with the 1896 Arrhenius paper either. His 1906 paper showed that he reduced the CO2 warm forcing effect by more than 50%.”
Have you ever seen his 1906 paper,Jimmy? Do you know what the IPCC now say about warm forcing?
You are so IGNORANT,that you can’t even realize that you made clear you have no freaking idea what Dr. Arrhenius ever said in the first place! Your latest statement is so dumb,that I am wondering if this is the best you can come up with,since you keep avoiding discussing actual science details.
I have seen the papers,have you Jimmy?
Do you know what his warm forcing number were in 1896 and the change to a different number in 1906?
Do you know what Arrhenius said about the small CO2 warm forcing effect?
Can you answer the simple questions,Jimmy?
“James Ardmore
September 22, 2017 at 9:30 am Edit
Your ‘prediction’ of global cooling has no supporting science or evidence. Worthless.”
Your statement is worthless since you didn’t provide anything called a counterpoint to his presentation. You didn’t address anything he wrote in detail either
James,wrote this howler:
“You dismiss the peer reviewed science…”
Somehow this non science,troll completely missed my comment of a list of 1350+ number of peer reviewed science papers. I wrote just a 4 hours ago and only a few comments above this one.
“By the way there are THOUSANDS of published science papers that doesn’t agree with the AGW conjecture:
1350+ Peer-Reviewed Papers Supporting Skeptic Arguments Against ACC/AGW Alarmism
http://www.populartechnology.net/2009/10/peer-reviewed-papers-supporting.html
It is NOT settled science!”
https://wattsupwiththat.com/2017/09/20/from-the-the-stupid-it-burns-department-science-denial-not-limited-to-political-right/comment-page-1/#comment-2617184
This is a troll posting from the Twilight Zone.
@sunsettommy
There are no peer reviewed papers disputing AGW: https://skepticalscience.com/naomi-oreskes-consensus-on-global-warming.htm
James, do you realize how stupid you are?
The papers are PUBLISHED in science journals,which means they do exist. There are at least 1350 papers published,that doesn’t support the AGW conjecture.
12 years ago Oreskes was exposed for that stupid,dishonest paper since she ADMITTED she made a mistake in her search parameters. She left out 11,000 published papers in the process.
Naomi Oreskes & her study: errata
“Oreskes claims to have analysed 928 abstracts she found listed on the ISI database using the keywords “climate change”. However, a search on the ISI database using the keywords “climate change” for the years 1993 – 2003 reveals that almost 12,000 papers were published during the decade in question (2). What happened to the countless research papers that show that global temperatures were similar or even higher during the Holocene Climate Optimum and the Medieval Warm Period when atmospheric CO2 levels were much lower than today; that solar variability is a key driver of recent climate change, and that climate modeling is highly uncertain?
These objections were put to Oreskes by science writer David Appell. On 15 December 2004, she admitted that there was indeed a serious mistake in her Science essay. According to Oreskes, her study was not based on the keywords “climate change,” but on “global climate change” (3).:
https://motls.blogspot.com/2005/05/oreskes-study-errata.html
The was TWELVE years ago!
You and other warmists are so out of date,it is funny.
@sunsettommy
So you Don’t know the difference between published papers..which can and often do include comic books…and peer reviewed journal papers…..
Uh huh…I tawt I taw a Brad Keyes-ian
@sy computing
Do you now acknowledge your error in claiming Jim Hansen was postulating global cooling in his paper (where he discussed regional cooling effects)?
No.
I do, however, acknowledge my error in trying help you learn how to think critically.
@Tom Halla
You assert CO2 tracks temperature in neither the instrumental nor proxy record.
It’s one thing to argue about minor details. It’s another to argue against basic facts. The Vostok ice core data shows CO2 ppmv rising after an initial warming due to the beginning of a Milankovitch warming cycle. Then there is a much larger warming upsurge caused by the increased greenhouse effect from increased CO2 ppmv. Twisting the facts to deny the greenhouse effect may work in your echo chamber, but not in the world of science. Not even the lukewarmers buy what your selling.
@sy computing
Jim Hansen would be amused to learn you cite him as an advocate of global cooling,but would not be surprised to find out you don’t understand the difference between regional and global temperature change.
I’m thinking you’re having a lot more amusement than Jim Hansen would…
🙂
What a fun thread! Lets us sum it up. All these science deniers advocating the false religion of Man Caused Globall Warmining are on the left of the political spectrum(side note, to a man they want to use the armed force of government to punish any who refuse to submit to their false religion) and they steadfastly refuse to accept reality, to wit, climate changes constantly, humans are not causing it and can not stop it.
It appears that James Ardmore will not address my questions about Arrhenius papers at all,despite that he was the one who kept bringing him up in his comments.
Here is what I posted,that he is avoiding:
“Have you ever seen his 1906 paper,Jimmy? Do you know what the IPCC now say about warm forcing?
You are so IGNORANT,that you can’t even realize that you made clear you have no freaking idea what Dr. Arrhenius ever said in the first place! Your latest statement is so dumb,that I am wondering if this is the best you can come up with,since you keep avoiding discussing actual science details.
I have seen the papers,have you Jimmy?
Do you know what his warm forcing number were in 1896 and the change to a different number in 1906?
Do you know what Arrhenius said about the small CO2 warm forcing effect?
Can you answer the simple questions,Jimmy?”
He earlier said,
“James Ardmore
September 21, 2017 at 5:36 pm
The only problem with your thesis is that it is wrong– as shown by scientists since Arrhenius in 1896, and confirmed by the Vostok ice core samples going back 400,000 years, and other Antarctic ice cores from 800,000 to 400,000 years before present.”
and,
” James Ardmore
September 21, 2017 at 4:45 pm
The fact that atmospheric CO2 controls the climate has been known since Arrhenius discovered the atmospheric Greenhouse Effect in 1896.”
This is a classic dodge on your part James, since it is clear you have no idea what Arrhenius said in the two papers.
Arrhenius discovered the effect in 1896, and its scientific understanding was refined during the 20th and 21st century and is well understood by the science community, but not by junk science advocates who are devoted to its dismissal and still believe they can achieve scientific competence without educational attainment or reading of the peer reviewed literature
James, it is now clear you have no idea what Dr. Arrhenius stated in his two papers. His second paper warm forcing effect statement is actually much lower than his original estimate ,but you don’t know since you NEVER read it!
Your IGNORANCE is well displayed here,you have destroyed your credibility with YOUR ignorance of what Dr. Svante Arrhenius actually stated about the CO2 warm forcing effect,in his two papers.
You are just another miserable warmist troll,who is clearly illiterate on science issues. You run on Consensus run on Fallacies,ignore the many predictive AGW failures,reply on non validated far into the future climate models and so on……. You are incoherent as well.
Only a small minority of posters on this site who consider themselves skeptics claim there is no GHG effect, with the much more common conclusion that the effect is much less of an effect on current temperatures than the IPCC and similar modelers insist. You are tending towards a false dichotomy.
GHG’s act on a curve, with fairly small amounts saturating the absorption bands. Remember the controversy is stated in the sensitivity of doubling the amount of CO2. The IPCC has not improved its WAG of 1.5 to 4.5 degrees C since 1990 in any real way, while the evidence cited by posters on this site conclude it is from less than 1 to about a maximum of 1.5.
@Tom Halls
The consensus of peer reviewed research has a CS center point of 3C and an upper bound of 6C. Fringe estimates of a 1.5C center point have no standing in the peer reviewed research
JA, which is why the IPCC approved models run too hot. Try to pay attention, bubba.
James A. apparently doesn’t notice that the PER DECADE warming trend prediction have been waaay too high.
The IPCC stated in 1990 that it would warm about .30C per decade, but Satellite data show LESS than half that rate:
http://www.woodfortrees.org/graph/rss/from:1990/mean:12/plot/rss/from:1990/trend/plot/uah6/from:1990/mean:12/plot/uah6/from:1990/trend
Not even close!
Wrong
CS is 3C per CO2 doubling, it’s not a measure of warming per decade.
The models don’t run hot at all
Try to keep up
The doubling is to 560 ppm,which is around 60 years into the FUTURE.
You are dumb as hell,since you can’t know for sure it doesn’t run hot far into the future. What is running hot model wise is from 1990 to 2017,which I just showed you with satellite data.
That is what Tom and many others are talking about.
And JA does not care that temperature tracks CO2 levels in neither the instrumental or proxy record. While CO2 probably has some effect, at current or historic levels, other factors are so much larger it gets lost in the “noise”.
@sunsettommy
You did not show any such thing, since rss v4 shows a warming rate of 0.2 per decade, right at the lower end of the IPCC range. Time for you to give it up.
@Tom Halla
You say ‘CO2 tracks temperature in neither the instrumental nor proxy record.’
It’s one thing to argue about minor details. It’s another to argue against basic facts. The Vostok ice core data shows CO2 ppmv rising after an initial warming due to the beginning of a Milankovitch warming cycle. Then there is a much larger warming upsurge caused by the increased greenhouse effect from increased CO2 ppmv. Twisting the facts to deny the greenhouse effect may work in your echo chamber, but not in the world of science. Not even the lukewarmers buy what your selling.
The only “fact” is that the CO2 rise lags behind the temperature rise. The degree to which the CO2 amplifies the warming is 100% interpretation.

The CO2 decline into glacial stages also lags behind the fall in temperature.
If CO2 was a primary driver of climate change, the current interglacial stage would be consireably warmer than Late Pleistocene glacial stages…
Mr Ardmore, you are probably both using “adjusted” temperatures and cut-off graphs in your claim. If one uses pre-2000 records for temperature, there were rises, plateaus, and declines in temperature since 1850 with steadily rising CO2 levels. Similarly, in the paleo proxies, there is little correspondence between CO2 levels and temperature. There is a relationship since the start of the ice ages, but not in older proxies.
JA, as you evidently conclude essentially all the “adjustments” made by people like Mann, Gavin Schmitt and Phil Jones were entirely justified, you should post why you think those alterations to raw data were correct, and not a case of pious deception in a noble cause.
@David Middleton
The fact that rising atmospheric CO2 drives global temperature rise is not ‘interpretation’, as you contend, but documented in the proxy data by Shakun, and others: https://www.skepticalscience.com/co2-lags-temperature-intermediate.htm
(You should improve your quoting here with “quotation marks”,otherwise you can be accused of lying. You did poorly with Tom too) MOD
Quote my comment, rather than lying about what I posted.
Nothing in your SkepSci link substantially disagrees with my comnent.
Oh my!
I wrote PER DECADE,based on the 1990 IPCC warming prediction,you come back with something else entirely,which means you are a terrible reader!
Here is what the 1990 IPCC report says:
“Based on current model results, we predict:
• under the IPCC Business-as-Usual (Scenario A) emissions of greenhouse gases, a rate of increase of global mean temperature during the next century of about 0 3°C per decade (with an uncertainty range of 0 2°C to 0 5°C per decade), this is greater than that seen over the past 10,000 years This will result in a likely increase in global mean temperature of about 1°C above the present value by 2025….”
http://www.ipcc.ch/ipccreports/far/wg_I/ipcc_far_wg_I_spm.pdf
Once again I caught you as being IGNORANT!
(Snipped for Trolling) MOD
@sunsettommy
The rate per decade doesn’t mean 0.3C EACH decade, a common error among the skeptics . As near as I can tell, the year is 2017, and 2025 is still in the future, as is the end of the century. When the future arrives, you can look back and comment.
@Sunsettommy
Based on RSS v4, the rate of warming since 1990 is 0.2C per decade, right at the lower end of the IPCC range. Looks like I caught you.
You didn’t count very well,since the total increase in 27 years is .40C which mean the rate is well below .20C per decade.
True the .30C per decade is the AVERAGE as mentioned in the Report,but you have no idea how bad it really is since the 1990 Emission Scenario was less at the time than now,yet the temperature increase didn’t speed up at all.
The table and the graph show annual mean carbon dioxide growth rates for Mauna Loa.
1990 1.16
Here is the 2001 IPCC report showing an updated Business as usual scenario with increased emissions behind it. They more specifically state a MINIMUM.30C per decade,no more averaging this time around. It is .30C per decade or more now.
“For the next two decades, a warming of about 0.2°C per decade is projected for a range of SRES emission scenarios. Even if the concentrations of all greenhouse gases and aerosols had been kept constant at year 2000 levels, a further warming of about 0.1°C per decade would be expected.”
https://www.ipcc.ch/publications_and_data/ar4/wg1/en/spmsspm-projections-of.html
“Even if the concentrations of all greenhouse gases and aerosols had been kept constant at year 2000 levels”
But the emission rate at 2000 is much less than it is at 2015:
The table and the graph show annual mean carbon dioxide growth rates for Mauna Loa.
2000 1.61
2015 3.03
https://www.esrl.noaa.gov/gmd/ccgg/trends/gr.html
This means .30C per decade is now too low,it is more like .40C per decade to account for the increased CO2 emission flow into the atmosphere.
2001 to now:
http://www.woodfortrees.org/graph/rss/from:2001/mean:12/plot/rss/from:2001/trend
.15C increase total in 15+ years. That is .10C per Decade rate.
You have no case here, Jimmy.
What I don’t get is the fixation on CO2, whose effect is probably saturated.
If you want to consider human factors contributing to climate, what about changes in land use? Lowering the albedo by, for example, plowing a field will definitely convert extra sunlight into surface heat. Ever flown over a plowed field in a light aircraft on a sunny day? You will definitely experience a strong updraft.
Tbey can’t see what they don’t see..
@David Barnett, P.H.D.
It’s a logarithmic relationship, fully accounted for in the models. Other human factors, such as the ones you cite, indeed do have an impact, but climate forcing from the increasing greenhouse effect is dominant.
If it was dominant, this wouldn’t happen…
http://www.remss.com/research/climate.html
“Not warmed quite as fast” is a massive understatement…
http://images.remss.com/figures/climate/RSS_Model_TS_compare_globev4.png
The models miss high 95% of the time because climate sensitivity has been consistently overestimated.
https://landshape.wordpress.com/2015/06/20/6921/
http://joannenova.com.au/2015/06/shrinking-climate-sensitivity-estimates/
https://judithcurry.com/2016/04/25/updated-climate-sensitivity-estimates/
The IPCC refuses to use observation-dervied climate sensitivities…
https://www.ipcc.ch/publications_and_data/ar4/wg1/en/ch9s9-6.html
Relying instead on models.
David, Kenneth Richards from NTZ adds FORTY more published science papers also showing much reduced sensitivity estimates:
http://joannenova.com.au/2015/06/shrinking-climate-sensitivity-estimates/#comment-1721705
@sunsettommy
All your posting and hugging and puffing is for naught. Comparison of forcings is basic science, showing that nothing else approaches the magnitude of climate forcing from an increasing greenhouse effect. This issue is an outstanding example of how the skeptics get it wrong, in spades: https://www.skepticalscience.com/empirical-evidence-for-co2-enhanced-greenhouse-effect-advanced.htm
David Barnett, you see the problem clearly. They try hard to make CO2 the god of climate driver,despite it being a trace gas with a tiny absorption range.
What I am surprised is how FEW skeptics know that the outgoing energy flow into space increase is ALWAYS greater than any additional warm forcing effect of CO2 can create.
John Kehr brings this up:
“A 0.5 °C temperature difference between these two years resulted in an additional 2.5 W/m2 increase in the measured amount of energy lost to space. That increase in energy loss is not theoretical, it is a measured difference. It is also what is predicted by the Stefan-Boltmann Law.
If the Earth were to warm by 1.1 °C, the amount of energy lost would be almost 4 W/m2 greater than what it lost in 1984. If the Earth were to warm by 3.0 °C which is what is predicted by a doubling of CO2, then the amount of energy lost would be > 10 W/m2 the energy loss that existed in 1984.
The science of this is very clear. The rate at which the Earth loses energy will increase at more than twice the rate that the theoretical CO2 forcing is capable of causing warming to take place. The amount of CO2 in the atmosphere cannot stop the Earth from losing more energy if it warms up. The reasons behind this are the wavelengths of energy that are transmitted by the Earth, but it can simply be shown by looking at the energy loss increase that has taken place over the past 25 years.”
http://theinconvenientskeptic.com/2012/05/the-science-of-why-the-theory-of-global-warming-is-incorrect/
CO2 effect was set in around a BILLION years ago,there has been very little to add ever since. That is why the entire warm forcing effect paradigm in modern times is absurd.
Here is a simple Logarithmic chart of CO2 from 20 ppm upward:
http://joannenova.com.au/globalwarming/graphs/log-co2/log-graph-lindzen-choi-web.gif
As you can see at the 280 ppm level, 95% of all warm forcing of CO2 has already occurred,there is so little left to add on.
David Middletons chart,shows that many other factors can explain the increased warming and outflow of energy from the planet.
CO2 by itself doesn’t promote enough warming to the system to increase the “temperature”,that is why their unverified Positive Feedback argument is so critical to the few silly warmist scientists,such as Stefan Rahmstorf,David Mann,Ken Trenberth, and other like them.
They KNOW CO2 by itself will never drive the catastrophic warming trend, they cry so much over.
This link,shows a number of links to published papers all saying there is a significant lag of CO2 FOLLOWING temperature change:
The 800 year lag in CO2 after temperature – graphed
“In the 1990′s the classic Vostok ice core graph showed temperature and carbon in lock step moving at the same time. It made sense to worry that carbon dioxide did influence temperature. But by 2003 new data came in and it was clear that carbon lagged behind temperature. The link was back to front. Temperatures appear to control carbon, and while it’s possible that carbon also influences temperature these ice cores don’t show much evidence of that. After temperatures rise, on average it takes 800 years before carbon starts to move. The extraordinary thing is that the lag is well accepted by climatologists, yet virtually unknown outside these circles. The fact that temperature leads is not controversial. It’s relevance is debated.
It’s impossible to see a lag of centuries on a graph that covers half a million years so I have regraphed the data from the original sources, here and here, and scaled the graphs out so that the lag is visible to the naked eye. What follows is the complete set from 420,000 years to 5,000 years before the present.”
http://joannenova.com.au/global-warming-2/ice-core-graph/
Her replies to warmist illiterate comments is a treat!
@sunsettommy
Wrong on the lag only baloney: http://www.nature.com/nature/journal/v484/n7392/full/nature10915.html?foxtrotcallback=true
Bwahahahahahahahaha,
That paper has been torn apart by Willis using the same exact data Shakun used,but Willis use ALL the rest of the CO2 data for the time period,while Shakun stopped it at 6,000 BC.
Shakun Redux: Master tricksed us! I told you he was tricksy!
“When I left off in that post of mine, I had investigated each of the 80 proxies used in Shakun2012. I plotted them all, and I compared them to the CO2 record used in their paper. I showed there was no way that the proxies could support the title of the paper. Figure 1 recaps that result, showing the difficulty of establishing whether CO2 leads or lags the warming.”
“Dang, I didn’t expect that rise in CO2 that started about 6,000 BC. I do love climate science, it always surprises me … but the big surprise was not what the ice core records showed. It was what the Shakun2012 authors didn’t show.
I’m sure you can see just what those bad-boy scientists have done. Look how they have cut the modern end of the ice core CO2 record short, right at the time when CO2 started to rise again …”
https://wattsupwiththat.com/2012/04/07/shakun-redux-master-tricksed-us-i-told-you-he-was-tricksy/#more-60932/
Shakun,was caught red handed because he stopped the CO2 data right when it was about to go up a lot,while temperature was going down slowly. Willis added the rest of the CO2 data that Shakun omitted.
His paper was refuted long ago.
While Shakun’s paper was quickly exposed as statistical trickery, these papers I gave you link too are still regarded as good science:
REFERENCES
Petit et all 1999 — analysed 420,000 years of Vostok, and found that as the world cools into an ice age, the delay before carbon falls is several thousand years.
Fischer et al 1999 — described a lag of 600 plus or minus 400 years as the world warms up from an ice age.
Monnin et al 2001 – looked at Dome Concordia (also in Antarctica) – and found a delay on the recent rise out of the last major ice age to be 800 ± 600
Mudelsee (2001) – Over the full 420,000 year Vostok history Co2 variations lag temperature by 1,300 years ± 1000.
Caillon et al 2003 analysed the Vostok data and found a lag (where CO2 rises after temperature) of 800 ± 200 years.
http://joannenova.com.au/global-warming-2/ice-core-graph/
You never did show that….. “Carbon dioxide follows temperature in the Vostok Ice Cores
In the 1990′s the classic Vostok ice core graph showed temperature and carbon in lock step moving at the same time. It made sense to worry that carbon dioxide did influence temperature. But by 2003 new data came in and it was clear that carbon lagged behind temperature. The link was back to front. Temperatures appear to control carbon, and while it’s possible that carbon also influences temperature these ice cores don’t show much evidence of that. After temperatures rise, on average it takes 800 years before carbon starts to move. The extraordinary thing is that the lag is well accepted by climatologists, yet virtually unknown outside these circles. The fact that temperature leads is not controversial. It’s relevance is debated.”
is wrong since you never addressed it at all,just run to a bad paper that was destroyed 5 years ago. You also ignored a number of papers listed here completely,despite that they are accepted science today,while Shakun is not.
Do you know what a debate is Jimmy?
James,getting desperate tries a link to a site that doesn’t address the Sensitivity topic well and waaaay out of date as it is 8 years old!:
“@sunsettommy
All your posting and hugging and puffing is for naught. Comparison of forcings is basic science, showing that nothing else approaches the magnitude of climate forcing from an increasing greenhouse effect. This issue is an outstanding example of how the skeptics get it wrong, in spades: https://www.skepticalscience.com/empirical-evidence-for-co2-enhanced-greenhouse-effect-advanced.htm”
This is an EIGHT year old post,that doesn’t have the updated CO2 sensitivity estimates,which even the latest IPCC admits to be going down.
David posted THIS link to Climate Audit discussing Sensitivity,it is clear you didn’t read it since you continue on to post Cooks way out of date crap:
Pitfalls in climate sensitivity estimation: Part 2
https://climateaudit.org/2015/04/13/pitfalls-in-climate-sensitivity-estimation-part-2/
Me and David posted to you many dozens of lowering CO2 Sensitivity papers,which are backed the Satellite data showing NO increase in the Per Decade warming trend. This means CO2 isn’t the climate driver you idiotically think it is.
No increase in Hurricanes,Tornadoes,Droughts,warming trend and more either.
HOW CAN YOU IGNORE THIS OBVIOUS REALITY?
You keep ignoring reality around you. You have been shown the following from official data,
The Per decade warming rate since 2001 is well over 50% LOWER than the IPCC prediction. The IPCC says .30C Per decade,we are getting .10C per decade instead and appears to be about to go down with the looming La Nina.
Since 2001 there is a DECREASE in the Per decade warming trend by the official satellite data. You have been SHOWN this,it can’t be dismissed!
http://www.woodfortrees.org/graph/rss/from:2001/mean:12/plot/rss/from:2001/trend
That CO2 warm forcing is way down the list from calculated forcings is ignored by you,John Cook and many other dishonest warmists.
The following is based on the Keven Trenberth models,
“Evaporation: 80.0 W/m^2
Water vapor (GHG): 18.1 W/m^2
Convection: 17.0 W/m^2
CO2 (GHG): 3.3 W/m^2
Ozone (GHG): 1.0 W/m^2
Other (GHG): 0.7 W/m^2”
translates to,
“Evaporation: 22.0 °C
Water vapor (GHG): 5.0 °C
Convection: 4.7 °C
CO2 (GHG): 0.9 °C
Ozone (GHG): 0.3 °C
Other (GHG): 0.2 °C
If CO2 were removed, the change in energy transfer would be 3.3 W/m^2 which is 2.75% of the total. That change corresponds to a total change to the GHE of 0.9 °C which I will consider 1 °C as the ozone transfer really takes place in the stratosphere.”
http://theinconvenientskeptic.com/2012/08/what-would-the-temperature-of-the-earth-be-without-co2-in-the-atmosphere/
CO2 is waaay down the list of warm forcing and with the the known Logarithmic effect has little more warm forcing left to work with. You have been shown this repeatedly,but you ignore it over and over because you are so idiotically wedded to a trace gas is going to kill us mania.
Your ignorance was once again shown when you used that link to Cooks laughable site. Even John admits that CO2 by itself will not promote a catastrophic warming trend,most warmist scientists knows this.
I have left something out all this time that you seem completely unaware of,that will prove once for all that you are an ignorant warmist troll parroting an idiotic belief. Something that warmist scientists hope shows up since the failure of it will doom everything they have babbled about for many years. They know it since they KNOW CO2 by itself doesn’t do what idiots like you think it will do.
I keep waiting for it from you,have not seen it yet,David I am sure understand what I am talking about here.
@sunsettommy
‘Willis’ added data that changed the conclusions? You mean the ‘Great’ Willis Eschenbach? Scam artist of the junk science blogs. Non peer reviewed. Shakun’s work confirmed operation of the greenhouse effect in proxy data and has only been debunked in your dreams, because his conclusions are An anathema to those who can’t countenance the universal findings of modern science.
Mr Ardmore, the mannerly procedure would be to explain why you conclude Shakun is still valid, despite the critique. Instead, you just reaffirm Shakun, with no reason given other than you agree with the conclusions.
LOL.
Once again you prove to be a troll,since you just employed the personal attack fallacy on Willis,who went to great length to post his research. He told you how he created that chart too.
Personal attacks on the author is always a sign that the attacker (You) knows he can’t address Willis’s conclusions about Shakun’s flawed paper.
It is clear you have NOTHING here since you didn’t explain why you think Willis is wrong. Shakun has been exposed wrong by other people too,but chose Willis because his presentation is very easy to follow,who honestly used the same data Shakun used,with more to get from 6,000 BC to now.
You failed once again.
Tom,
Jimmy is unaware of OTHER problems with the paper. Shakun NEVER even plotted out ALL of the 80 proxies in his paper,which would have showed him why his conclusions are not valid:
“Now, there’s plenty of things of interest in there. It’s clear that there is warming since the last ice age. The median value for the warming is 4.3°C, although the range is quite wide.
But if you want to make the claim that CO2 precedes the warming?
I fear that this set of proxies is perfectly useless for that. How on earth could you claim anything about the timing of the warming from this group of proxies? It’s all over the map.
Final Conclusion
The reviewers should have taken the time to plot the proxies … but then, the authors should have taken the time to plot the proxies.”
And then there is this problem too:
“Note the difference in the underlying shapes of the different types of proxies, and the differences in their timing with respect to the rise of CO2.
Next, note that the CO2 record they are using is from Antarctica. That is the reason for the good fit with the single “ice core ∂18O and dD” proxy (left graph, second row) and the “ice core dD” (center graph, second row). Both of those are Antarctic records as well.
Also, as you can see, even within each proxy type there is no unanimity regarding the timing of either the onset or the end of the warming from the last ice age.
CO2 is the blue line … so was the warming before or after the blue line?”
https://wattsupwiththat.com/2012/04/06/a-reply-shakun-et-al-dr-munchausen-explains-science-by-proxy/
Jimmy, can you figure out what Shakun’s big mistake was?
@If Eschenbach had a modicum of integrity, he would publish his so called debunking in a peer reviewed journal. Shakun’s work remains a ground breaker, while Eschenbach remains unknown, (except in junk science circles)
Here is some thoughts for the closeminded troll:
Willis in a comment states,
” Willis Eschenbach
April 6, 2012 at 11:03 am Edit
Oakwood says:
April 6, 2012 at 9:42 am
I submit another vote to overlay the CO2 data on the final plot. Please.
I didn’t overlay it for several reasons.
One is that they have released their temperature data, but not their CO2 data, so I was unwilling to mix apples and oranges.
The second is that, no matter where you put the CO2 in that pile of nonsense, it won’t make a difference.
The third is that, as near as I can tell, they’ve looked at eighty temperature records and are comparing them to a single CO2 record. This is an ice core record from the EPICA ice core, which they say has “recently been placed on a more accurate timescale.” That seemed curious, they are averaging 80 proxies for historical temperature, but they’ve taken a single proxy for CO2.
In any case, I’ll do the overlay when I get a few moments. I’ll have to digitize the CO2 data they used, so it may be a day or so.
w.”
https://wattsupwiththat.com/2012/04/06/a-reply-shakun-et-al-dr-munchausen-explains-science-by-proxy/#comment-947433
You get it yet,Jimmy?
@Sunsettommy
Willis Eschenbach has a California Massage Certificate, and a BA in Psychology!! And you rely on him to debunk peer reviewed scientific journal papers. Unbelievable. .
Here is the chart about declining CO2 sensitivity numbers over the years:
https://landshape.files.wordpress.com/2015/06/climate_sensitivity.pdf
Here is the link that talks about it:
Published measurements of climate sensitivity declining
“Scientists made numerous estimates of climate sensitivity over the last few decades and have yet to determine the correct value. The figure shows the change in published climate sensitivity measurements over the past 15 years (from here). The ECS and TCR estimates have both declined in the last 15 years, with the ECS declining from 6C to less than 2C. While one cannot extrapolate from past results, it is likely that the true figure is below 2C, and may continue to decline. Based on this historic pattern we should reject the studies that falsely exaggerated the climate sensitivity in the past and remember that global warming is not the most serious issue facing the world today.”
https://landshape.wordpress.com/2015/06/20/6921/