I see there’s a new study, unfortunately paywalled, which starts out by saying:
Observations show that all recent large tropical volcanic eruptions (1850-present) were followed by surface winter warming in the first Northern Hemisphere (NH) winter after the eruption. Recent studies show that climate models produce a surface winter warming response in the first winter after the largest eruptions, but require a large ensemble of simulations to see significant changes.
OK, so far that’s interesting … but they continue:
It is also generally required that the eruption be very large, and only two such eruptions occurred in the historical period: Krakatau in 1883 and Pinatubo in 1991.
So, when they say “all recent large tropical volcanic eruptions”, they actually mean “only two of all recent large tropical volcanic eruptions”.
It’s enough to make a man wish that there was the equivalent in science of the “Truth In Advertising” laws. These guys actually think that they can make large-scale generalizations from two, count’em two, measly examples.
In any case, I thought I’d take a look at the winters (December-January-February, DJF) following the two large volcano years. Here’s that result.

Figure 1. Northern Hemisphere land-only temperature anomalies for individual years (including January and February of the following year), plus the overall average (mean) and the two volcano years. Fourteen months are shown to include the winter following the year of the eruptions.
As you can see, neither of the large eruption years (1991 and 1883) is unusual.
Now, they claim that the winter following large eruptions shows “warming” … but warming compared to what? To me, the logical measure would be to compare it to the preceding fall (September-October November, SON)—if the fall is warmer than average I’d think that the winter would be warmer than average. Figure 2 shows the comparison of winter and fall temperatures:

Figure 2. Histogram of winter (DJF) minus fall (SON) Northern Hemisphere land-only temperatures. Dotted lines show one standard deviation from the mean.
As you can see, while in both volcano years the winter is slightly warmer than the fall, in neither case is the difference statistically significant. In particular, Krakatau, largest eruption in recent history, shows almost no effect on the winter. It’s just about average.
In short, their claim that “Observations show that all recent large tropical volcanic eruptions (1850-present) were followed by surface winter warming in the first Northern Hemisphere (NH) winter after the eruption” is not supported by the evidence. And evidently, according to them, the other volcanoes are not large enough to lead to warmer winters …
Now if they actually were serious scientists, they would have noted that large volcanic eruptions are NOT followed by statistically significantly warmer winters, and they would have looked at something else. But these are not serious scientists, they are climate model believers. So instead they reached for a climate model, one of the models which are known to exaggerate the effects of volcanoes.
However, results from individual models are mixed, so they grabbed a whole bunch of models, averaged them, and PRESTO! Their unsupported allegation about the large eruptions causing warmer winters is now claimed as fact.
Man … this use of untested, unverified, and un-validated climate models gets old.
Finally, we’ve been told for years that volcanic eruptions cause COOLING … although what cooling is visible in the historical record is generally local, small, and short-lasting. But now, they say eruptions cause Northern Hemisphere winter warming? What’s up with that?
w.
PS—When you comment, please QUOTE THE EXACT WORDS YOU ARE DISCUSSING, so we can all be clear about your subject.
Doesn’t even pass the sniff test. N of 2? In 167 years?
And only 1, Pinatubo, is positive. Krakatau actually appears to have lowered (negative anomaly) northern hemispheric winter temperatures
El Chicon was just a important as Mt P, the peak was lesser but the extent was broader and longer in time.
Thanks, Greg. Indeed, the Mauna Loa record shows that El Chichon caused about the same size reduction in downwelling radiation as did Pinatubo. Sadly, this kind of cherry picking of volcanoes is far too common in the climate literature.
w.
several years ago I looked at all major eruptions stacked together. Here the HadSST3 ‘anomalies’ for extra-tropical NH are summed, with calendar months aligned for the year of eruption. eg jan 1982 and jan 1991 are summed
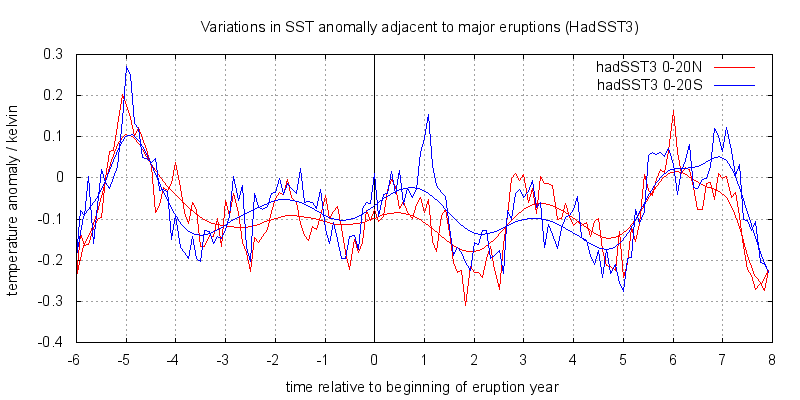
There is a clear dip in NH which peaks at about 2y and quickly recovers. This implies a negative climate feedback or other secondary impact of volcanoes which causes subsequent WARMING in the years which follow. If volcanoes just caused cooling then temps would remain low.
The usual excuse if that it is AGW which causes warming to counter the volcanic effect but only 2 of the six eruptions were in the period supposedly “dominated” by AGW.
What is seem is that the residual annual cycle is noticeably smaller in the years following but this is anomaly data so that just means the annual cycle is closer to that of the arbitrary base period chosen by Met Office. ie there is a difference in the annual cycle compared to surrounding years but a deeper look is needed to check whether this is really a lesser annual cycle.
Here is a similar graph for the tropics, which do not have a 12mo cycle. Much more stable.
Look at the cumulated sum off temperature over time we get a clearer idea of any deficit or gain in “degree days”.
The striking thing is that the tropics seem to take it totally in their stride and actually compensate to ensure constant degree.days. Extra tropical regions take a hit. but it quickly levels off meaning temps have quickly recovered to pre-eruption mean.
For full explanation of the processing of the graph see the following URL. Click through the links for similar graphs of NH, SH etc.
https://climategrog.wordpress.com/hadcrut4_stack_cdf_sh_zeroed/
“Paywalled”?
Who cares about paywalled any more.
You just find the doi #, which is: 10.1002/2017JD026728, for this article.
Then you log in to http://www.sci-hub, link: http://www.sci-hub.bz/
and paste in the doi number.
Bob’s your Uncle, and you can download the scientific article for free….!
Try it out – NOW!
Martin, I don’t know why but despite many attempts I’ve never been able to get through to the sci-hub site … I tried last night after you reminded me, no go. Same thing this morning. The message says:
I’ve tried it (and the sister sites) over and over with no joy.
Regards,
w.
Willis, you say that you cannot see this site.
Well, it has to do where you live. You live in the wrong country. In the USA, they (I don’t know whom) must have efficiently managed to filter out this site, so that it is not available. In Norway, where we don’t have such filters on the Internet, we call this Censorship. I guess you may have thousands of such sites that are not available. I have no problems accessing the site, via my Chrome reader. However, as the site is registered in .bz, I guess it is a ‘previous communist’ country, and therefore off limits for you, in the USA.
Sci-hub’s parole is: “Knowledge to all: no copyright: open access
We fight inequality in knowledge access across the world. The scientific knowledge should be available for every person regardless of their income, social status, geographical location and etc.
Our mission is to remove any barrier which impeding the widest possible distribution of knowledge in human society!”
Please try again, and try to find out why it does not work. If you send me an e-mail to: Mthovland@gmail.com,
I will send you the PDF.
Bit of a non-sequitur here …
What portion of the increase in CO2 over the past century is not blamed on (evil) man?
-50%?
Is it possible that adjustments to past data have inadvertently obscured the relationship of global temperatures following a volcanic event? Was the data set you used in this analysis an adjusted data set?
Steve, anything is possible and all datasets are “adjusted”. I used the HadCRUT4 dataset.
w.
I agree with you Willis – the conclusion in this paper is not supported by the evidence.
Furthermore, it is clear that major volcanoes produce about 0.5C of global COOLING, which takes about 5 years to dissipate – see some of the evidence below from El Chichon in 1982 and Mt. Pinatubo in 1991..
https://wattsupwiththat.com/2016/11/16/october-2016-global-surface-landocean-and-lower-troposphere-temperature-anomaly-update/comment-page-1/#comment-2342825
NOT A WHOLE LOTTA GLOBAL WARMING GOIN’ ON!
[excerpt}
Bill Illis has created a temperature model that actually works in the short-term (multi-decades). It shows global temperatures correlate primarily with NIno3.4 area temperatures – an area of the Pacific Ocean that is about 1% of global surface area. There are only four input parameters, with Nino3.4 being the most influential. CO2 has almost no influence. So what drives the Nino3.4 temperatures? Short term, the ENSO. Longer term, probably the integral of solar activity – see Dan Pangburn’s work.
Bill’s post is here.
https://wattsupwiththat.com/2016/09/23/lewandowsky-and-cook-deniers-cannot-provide-a-coherent-alternate-worldview/comment-page-1/#comment-2306066
Bill’s equation is:
Tropics Troposphere Temp = 0.288 * Nino 3.4 Index (of 3 months previous) + 0.499 * AMO Index + -3.22 * Aerosol Optical Depth volcano Index + 0.07 Constant + 0.4395*Ln(CO2) – 2.59 CO2 constant
Bill’s graph is here – since 1958, not a whole lotta global warming goin’ on!
My simpler equation using only the Nino3.4 Index Anomaly is:
UAHLTcalc Global (Anom. in degC, ~four months later) = 0.20*Nino3.4IndexAnom + 0.15
Data: Nino3.4IndexAnom is at: http://www.cpc.ncep.noaa.gov/data/indices/sstoi.indices
It shows that much or all of the apparent warming since ~1982 is a natural recovery from the cooling impact of two major volcanoes – El Chichon and Pinatubo.
Here is the plot of my equation:
https://www.facebook.com/photo.php?fbid=1106756229401938&set=a.1012901982120697.1073741826.100002027142240&type=3&theater
I agree with Bill’s conclusion that
THE IMPACT OF INCREASING ATMOSPHERIC CO2 ON GLOBAL TEMPERATURE IS SO CLOSE TO ZERO AS TO BE MATERIALLY INSIGNIFICANT.
Regards, Allan
Allan : ” about 0.5C of global COOLING, which takes about 5 years to dissipate ”
Cooling does not “dissipate” . That means there is a subsequent warming process, this requires energy from somewhere. This could be deep ocean OHC or from a change in the TOA energy budget.
Since the tropics are very insensitive to the notable change in volcanic forcing , this tends to suggest strong climate feedbacks affect incoming solar, in a similar auto-regulation to what Willis has been suggesting for several years.
Greg, let me rephrase.
The cooling is caused by airborne aerosols ejected from the volcanos that took about five years to fully dissipate, that is, settle out from the atmosphere. See my graph above, notably the two periods starting in 1982 and 1991 when the red line (actual global temperature) temporarily falls below the blue line.(global temperature predicted from Nino3,4).
The aerosols reduce the amount of sunlight that reaches the surface of the Earth, including its oceans. I suggest this is the simplest and most probable explanation.
The airborne aerosols can be measured using the Aerosol Optical Depth, as used by Bill Illis in his formula.
I cannot comment on the majority of your post because I do not understand your points.
”
Thanks Allan, it is interesting how closely that follows Nino3.4 , it would be informative to plot the residual so we can infer what may the effect of volcanoes, trying to subtract by eye is tricky.
”
The key word here is temporarily, and why is that so. If volcanism causes a temporary reduction in incoming solar and hence a temp drop. That does not mean it will automatically rebound once the aerosols dissipate. All else being equal it would remain cooler. This means that either there is a counter effect ( a climate negative feedback ) acting to restore the previous equilibrium or a separate forcing causing warming. GCMs use exaggerated AGW to bring things back up but then they overshoot post 2000 because there is not more big volcanoes.
That feedback option is certainly part of it and this feedback will also counter AGW. What we need to know is whether the feedback is stronger than just the plank feedback.
If we are to assume that the difference of your graphs shows the effect of volcanoes, we are implicitly assuming that Nino3.4 is unaffected by the notable reduction in incoming solar due to aerosols. I’m more inclined to think that it is LESS affected.
Similarly if you are to conclude that “THE IMPACT OF INCREASING ATMOSPHERIC CO2 ON GLOBAL TEMPERATURE IS SO CLOSE TO ZERO AS TO BE MATERIALLY INSIGNIFICANT.” then you are similarly assuming that Nino3.4 index is totally unaffected to start with.I would suggest that is unwarranted and probably a logical error.
/strong>
If “global warming” is global, then it would also affect Nino3.4 and may account for some or all of the long term rise in that data: thus this does not represent an argument that AGW is undetectable, it may simply be that you are including it implicitly by using Nino3.4 SST.
When I pull out the ENSO, AMO and the ln(CO2) warming influence in my model, and then zeroing out the Volcano influence leaving a “residual” which is the model’s estimate of the volcanoes influence, I have to say it actually works pretty well (and I am not playing around with the numbers here, this is what comes out).
Remember, the El Chichon Eruptions in March, April 1982 occured just as the 1982-83 Super El Nino was starting up. The eruptions cut-off the Super El Nino’s impact in the overall temperature numbers but the impact was still there. The Super El Nino also masks the impact of the eruptions.
And I don’t see any winter-time impact in the residuals. Temperatures started falling within a month or two of the volcanoes which happened in the spring and summers. (Maybe I’ll re-run with NH temps only but it is probably a waste of time).
Hi Bill,
I just saw your post at 5:35 after I made mine at 5:55 this morning.
I like your model – it actually seems to work. This is a rare event in climate modelling. 🙂
Can you kindly provide the data sources for your data inputs, especially the AOD.
Best, Allan
I using Sato AOD from GISS here.
https://data.giss.nasa.gov/modelforce/strataer/
Thank you Bill.
Note that Pinatubo was not that huge in historic terms – only ~25% of the ejecta volume from the eruption of Tambora in 1815, and ~15% of Laki in 1783. Based on one analysis (above), Pinatubo caused ~0.5C of global cooling that dissipated over ~5 years.
For estimates of ejecta volumes, see Table 4-1 from https://rucore.libraries.rutgers.edu/rutgers-lib/24551/
One estimate suggests summer cooling from the Tambora eruption was ~1C (0.8 to 1.3C) – this is perhaps a bit low based on the modern observations from El Chichon and Pinatubo; alternatively the relationship between ejecta volume and cooling is not linear.
http://www.nature.com/ngeo/journal/v8/n10/full/ngeo2526.html
Imbecilic politicians and their advisors are obsessing about global warming, when they should be worried about global cooling, both:
1. Moderate global cooling that is probably imminent, based on the reduced solar activity of SC24 and projections of another weak SC25. Ironically, the warmists have compromised our energy systems just in time for global cooling.
2. Longer term, the expectation of another major Ice Age, since we are about 10,000 years into the current interglacial, which is typically followed by ~100,000 years of Ice Age, with continental glaciers advancing over the continents. Dusting the ice sheets with carbon black to change their albedo may actually help avert this catastrophe – no irony there for the demonizers of “carbon”.
Regards, Allan
Bill , there is a problem with your use of AOD scaling giving a result in degrees, ie temperature. A forcing is a radiative flux. This will have a time delayed response in the temperature, which is energy, or the integral of a forcing.
If you scale directly to temperature you assuming instantaneous re-equilibration. This is the error that Santer makes in his 2014 paper and he ( to his credit ) finds that there is a residual volcanic signal when he does this. Part of that residual is the warming. In your graph you will see that temps come back up quicker than AOD . This is climate feedback at work.
I present a fully worked discussion of this in this article:
https://climategrog.wordpress.com/2015/01/17/on-determination-of-tropical-feedbacks/
Feedbacks and their strength is crux of the whole question, not a pedantic detail. It is what determines climate sensitivity.
ADDENDUM TO MY ABOVE POST (point 3 added):
Imbecilic politicians and their advisors are obsessing about global warming, when they should be worried about global cooling, both:
1. Moderate global cooling that is probably imminent, based on the reduced solar activity of SC24 and projections of another weak SC25. Ironically, the warmists have compromised our energy systems just in time for global cooling.
2. Longer term, the expectation of another major Ice Age, since we are about 10,000 years into the current interglacial, which is typically followed by ~100,000 years of Ice Age, with continental glaciers advancing over the continents. Dusting the ice sheets with carbon black to change their albedo may actually help avert this catastrophe – no irony there for the demonizers of “carbon”.
3. The recurrence of another major volcano like Tambora in 1815, or Laki in 1783 that would cause significant global cooling and widespread crop losses. Do we have any huge stores of grain that could feed the growing population of Earth in such a crisis? I do not think so. Maybe we could divert the huge USA corn ethanol crop to food production, but that would not be enough.
A major global cooling crisis such as items 2 or 3 could fulfil the objectives of the radical greens to depopulate the Earth of most of humanity – one assumes that they have plans in place such that they will survive.
Regards, Allan
Greg wrote:
“The key word here is temporarily, and why is that so. If volcanism causes a temporary reduction in incoming solar and hence a temp drop. That does not mean it will automatically rebound once the aerosols dissipate. All else being equal it would remain cooler. This means that either there is a counter effect ( a climate negative feedback ) acting to restore the previous equilibrium or a separate forcing causing warming. GCMs use exaggerated AGW to bring things back up but then they overshoot post 2000 because there is not more big volcanoes.”
An interesting point Greg, and one I have not studied. So off the top of my head, one possible solution is this:
The oceans contain vastly more energy (heat) than the atmosphere, and perhaps the simplest/best answer is that heat from the oceans cause the atmospheric temperatures to recover, as they clearly do.
Over longer periods, shallow ocean temperature is probably controlled by the integral of solar activity (see the work of Dan Pangburn and others). There could also be a longer-term impact from the upwelling of deep ocean currents.
Regards, Allan
I thought it was the summers after the eruption that was of interest, cooler than normal summers resulted in warmer winters? What am I missing?
Don’t know what you’re missing, but the authors are missing evidence …
w.
Another LPU *, another module of cheap/free content to the lazy MSM, another $instalment of funding and you play the hokey pokey and that’s what its all about!
* Least Publishable Unit
A lot depends on how big the volcanic eruption is, and if it’s near the equator. An interesting 2-part documentary on Youtube about an eruption in 535 AD that affected climate worldwide, and changed the course of history worldwide. It was way more significant than 1815 (1816 “Year Without A Summer”)
Part 1 is about tracking down the volcano. It might be a bit boring to some…
Part 2 is for history buffs. It’s about how it affected history, caused the fall of empires, etc, all over the planet in the ensuing decades…
Thanks.
Interesting but usual trip of finding one thing and twisting it to fit a conclusion.
around 49m reports of a “loud bang ” in China from the SW. The map then shows an arrow which goes south then turns a little to be more south-westy to point to Indonesia when in fact south would be the direct line.
Los Alamos lab says it would be infra sound and very low rumbling at long range, losing the “sharp reports” of the explosion, so inconsistent with “a loud bang” which implies sharp high frequency content. They conclude that this contrary evidence “fits”.
Only vague poorly evidence of a volcanic event in an antarctic ice core gets turned around “proof” from both poles.
Carbon dating of traces in Krakatoa from 6,600 BC and 1215 AD ‘suggesting the major eruption ‘may have been’ from the first millennium are reported as “overwhelming evidence of an eruptions around 535 AD”.
Conclusions about as convincing as AGW.
I noticed the weak points you mentioned. Perhaps the volcano was a different one. (Or perhaps the somewhat ill-fitting evidence actually fits Krakatoa if charitably interpreted.) The main point of interest to me was the second part—the historical impact of whatever volcano it was.
Consider the likely possibility that “sharp reports” and “a loud bang” are simply the way the translator translated the Old Chinese document. Translating ancient languages is, at best, difficult, and translations always reflect the limitations of translators.
I think the main problem they are having is translating what the Los Alamos researcher actually told them into to something makes fits their TV script.
Mount Tamboura – Year Without a Summer – a cooling effect.
As others have observed, Krakatoa is conventionally believed to have had a cooling effect.
One of my big complaints about climate scientists is their miserable level of general education especially with regard to history. You shouldn’t be able to write a paper that contradicts written history without referring to the history that you are contradicting.
There is plenty of historical evidence (ie. written records) that supports the existence of the Medieval Warm Period in Europe, America (at least the part the Vikings explored), and China. The case is similar for the Little Ice Age. The moment I knew that climate science was bunk was the moment I first saw Dr. Michael Mann’s Hockey Stick.
The stories coming out of the House of Global Warming these days are so convoluted, desperate and random that it is becoming very hard to even do so much as to ascertain what their position is on most matters, apart, of course, from destroying Western civilisation, .
43 pages
http://onlinelibrary.wiley.com.sci-hub.bz/doi/10.1002/2017JD026728
Willis: Good thread, but the word “winter” should be included in:
“But now, they say eruptions cause Northern Hemisphere [winter] warming? What’s up with that?”
Thanks, Roger. Fixed.
w.
I have other ideas regarding long term loading of the background Junge layer from Carbonyl sulfide, but for direct injection of SO2 past the tropopause directly into the stratosphere, it takes about 2 months for the SO2 to convert to Sulfate. After it peaks, the sulfate spike takes about 48 to 50 months to return to pre-eruption levels.
This is based off of the e-fold rates listed in Bluth et al (1997) and my plot assumes a generic one metric tonne release just for ease of scaling to any sized eruption. Remember, this does not take into account multiple eruptive columns or background sulfate levels. Either way, it’s still just a model and prone to being flat out wrong.
http://www.volcanocafe.org/wp-content/uploads/2015/11/so2-h2so4-e-folding-bluthjg.png
Interesting. I used similar rate equation arguments for these processes and found “optical density ” data following Mt Pinatubo could be fitted very closely with a step change ( the eruptions ejection of matter ) changing as you describe.
https://climategrog.wordpress.com/impulse_exp3_exp9/
The “e-folding” times which I found fitted best were 3mo for the SO2 change and 9mo for the dissipation.
PS the light blue line is something ( climate response )
Many people have tried to fit the decay as an exponential but it works only approximately . The two exponential fit is physically meaningful and fits shape of the data much better.
There’s a different interpretation to the ambiguous writing in the abstract.
The latitude of Krakatau which erupted in 1883, is situate at – 6.1021° S, at longitude 105.4230° E.
The latitude of Pinatubo which erupted in 1991, is situate at – 15.1429° N, at longitude 120.3496° E.
It appears from the above facts that those two (2) volcanoes are situated on either side of the Equator at a distance of 21.245 degrees difference in latitude.
So, iffen one is situated at 15 degrees North of the Equator and the other one is situated at 6 degrees South of the Equator, …….. just what effect does the circulation of the earth’s surface winds (as depicted below) have on the Northern Hemisphere/Southern Hemisphere distribution of the gasses and particulate matter of the two aforesaid “erupting volcanoes”?
http://mavdisk.mnsu.edu/larsop2/geog101/GenCirculation/fastcirc.gif
The winter warming observered is not over the full northern hemisphere, but rather restricted to Eurasia
and PARTS of north america. Significant cooling is observed in the mideast. This is the warming they are looking for. NOT the full NH.
Basically, we have two large volcanos since 1850. the observations (Robock and Mao, 1992; Perlwitz and Graf, 1995 ) show some winter warming in eurasia and parts of north america.
Further, they acknowledge that GCMs suck with volcanoes so they study a bunch of GCMS from 850-1850
when there are 10 large eruptions, to try to pick out which GCMs do the best job of showing warming over eurasia and parts of north America. (not the full NH)
“The perceived
inability of climate models to produce this dynamical response in past studies has been
attributed to several weaknesses in the models, including a simplified treatment of volcanic
aerosols and deficiencies in model implementation of the Brewer-Dobson circulation ”
This is in advance of a large volcano intercomparioson study coming up
the method for looking at the winter warming is to average the 5 previous winters.
Again, you dont do this on the full NH. basically take a spatial map of the NH and average
grid cells for the 5 previous winters.
Thanks for an atypically explicit comment, Mosh’. ?w=843
The trouble is, if you need to do post hoc regional sample selection you run the risk of just picking the limited areas which fit you proposed hypothesis.
If there is detectable effect of volcanic forcing I would first be looking for evidence of it using the ocean as a the calorimeter or TOA flux anomaly.
https://judithcurry.com/2015/02/06/on-determination-of-tropical-feedbacks/
Those who wish to confirm the accuracy of Mosher’s comment can look at Supplement Figure S3 online, which is not behind a paywall. This doesn’t excuse the authors and peer reviewers of the paper for letting a misleading abstract be published, or WIllis from bothering to check out the paper itself.
http://onlinelibrary.wiley.com/store/10.1002/2017JD026728/asset/supinfo/jgrd54008-sup-0001-2017JD026728_SI.pdf?v=1&s=c1f524d61f2f3eb6657b93747060fbed55eb6f14
The true absurdity of this paper can be seen by comparing the eight models and confidence intervals in Figure S3. BCC-CSM1-1 shows an average warming of 2K in Alaska the winter after large volcanic eruptions and MIROC-ESM shows 2K of cooling even though large areas of the globe show much smaller changes in temperature with GREAT THAN 95% CONFIDENCE. This is a classic example of GIGO. Climate scientists know that AOGCMs are parameterized differently and therefore produce change in regional climate that disagree seriously with each other. Since no one knows which parameter set – if any, most likely none – describes weather after volcanic eruptions, this output has not meaning. If all eight maps were statistically combined to see what changes are predicted by a consensus of models, the result with probably be a map with no statistically significant changes except cooling.
The NH region that shows the biggest changes are on the edge of the polar vortex. The models that predict a weakening of the polar vortex probably allow cold Arctic air to move south (a pattern we have experience recently), leaving parts of the Arctic much warmer than usual. We currently can’t predict what will happen in winter six months from now! Why would any journal was space publishing this dubious output? Saying this is the best AOGCMs can do is a ridiculous answer. As Judith Curry points out, climate scientists need better models, not more analysis from inadequate models.
Mosh, thanks for your detailed reply. However, as many folks do, you’ve obviously told me what you think is wrong but you haven’t actually tried it. Here’s Pinatubo done by your method:


So … what’s not to like? Well, here’s the same calculation for two years before Pinatubo, with no eruptions in sight.
I’m sure you can see the problem. This is why I say to people like 1sky1 and you that you need to SHOW US how to do right, rather than TELLING US how to do it right. I’m tired of folks that are all hat and no cattle …
w.
Thanks Willis, that confirms my comment to Mosh, that post hoc selection of specific regions where it works is a great way of fooling yourself ( and anyone else prepared to print whatever comes along ).
I would suggest you read the full article before writing about it. They analyse 10 eruptions between 850 and
1850 AD. The claim that the effect is only visible for large eruptions refers as far as I can see refers to the
climate models not the temperature records. Furthermore the statement that northern hemispheres are warmer is not their claim but they refer to multiple other papers that make that statement. This paper looks at what is happening in the climate models and how they can be used to explain the NH winter warming.
Germonio August 6, 2017 at 12:01 am Edit
Thanks, Germonio, but I fear you’re wrong on both counts. First, they don’t “analyse 10 eruptions between 850 and 1850 AD”. They analyze COMPUTER SIMULATIONS of the ten eruptions … just as I said in the heat post.
Next, the claim that the “the effect is only visible for large eruptions … refers to the climate models” is clearly contradicted by the section that I quoted, viz:
Regards,
w.
Willis,
You need to read the paper and the references. The analysis showing that warmer NH winters follow large
volcanic eruptions was published in 1992 (the paper is linked to in another comment). The statement about the eruptions needing to very large refers to the models as others (e.g. Charles the Moderator ) have also
suggested. The abstract is badly worded which is why you need to read the full paper.
And if you are interested the claim that NH winters are warmer immediately after a volcanic eruption can
be found at
http://climate.envsci.rutgers.edu/pdf/RobockMaoWinterWarming92GL02627.pdf
Thanks, Germonio, They don’t claim what you say that they claim. They find studies with all kinds of different results, viz:
and
and
and
and
Say what? North America is warming and the US is cooling? The US is both warming and cooling? Middle East is both significant and insignificant.
In addition, the fact that they have not adjusted for either the Bonferroni Correction or for autocorrelation means that their claimed “significance” is meaningless.
Color me unconvinced … I’ve seen too many bogus studies claiming volcanic effects.
w.
“North America is warming and the US is cooling? The US is both warming and cooling? ”
You are incorrectly reading N. Am and US as being the same thing. N.Am is a continent , not a country.
Willis
I think we have agreed on this subject before.
In trying to extend CET from its current limit of 1659 I have looked at hundreds of records in England back to 1086. Cooling, if it occurs, as was traditionally thought, is fleeting, lasting at most one or two seasons. Warming is also fleeting lasting at most one or two seasons. So it can cause either cooling….or warming, depending on the time of year of the VERY large eruption concerned.
Which could be another word for very little effect at all, as warming or cooling sounds very much like natural variability.
I looked in some detail at Dr Mann’s 1258 super volcano eruption which initially as you know, did not show up in tree rings, but must have had a dramatic effect on cooling for several years because……Hmmm.
Well the only problems with that is that the cold and often very unsettled period occurred some 7 or 8 years PRIOR to the eruption, so the 1258 event was merely a continuation of trends not the start of a new one, although 1258 itself did have a couple of exceptional seasons weather subsequently quickly returned to ‘normal’ whatever ‘normal’ means.
So warming or cooling, take your pick. There’s very little evidence for anything more than a fleeting effect and that only when a very large eruption occurs, although of course in the medieval period a disastrous spring, when planting occurs, would have a devastating effect on harvest even if by then the weather had turned better..
tonyb
Yes, much of the cooling usually attributed to Mt P and which modellers try to match by fiddling with their fudge factors, was already happening from about 1989, already.
Hi T.B.:
Krakatoa is an interesting subject, which needs a detailed analysis. Here is an excerpt from a workout in 1992 at: http://www.whatisclimate.com/conditions-for-the-protection-of-the-global-climate.html#_aa12 see Section B-II
“2. Krakatoa – A Climatic Once-in-a-Century Event? a. State of Affairs
In the year following the three volcanic eruptions in 1883, including Krakatoa in August 1883, the circulation in the atmosphere was above normal and then sank to a powerfully developed minimum in 1888, wrote Artur Wagner in his discussion of climatic change in 1940[37]. At the most, a reduction in solar energy could be caused only by fine dust at high altitudes. Other authors also refer to Krakatoa only from the standpoints of blockage of sunlight and as a cause of ice ages[38]. Even today, the discussion of large-scale volcanic eruptions is limited to the determination that it can become colder for a short period of time[39]. Little is left of Neumayer’s euphoria of January 1884 and – as it appears – there have hardly been any advances for science. Did Krakatoa really leave behind so few traces, or were they simply not recognized?
—several paragraphs later-
It would seem that a reduction of solar radiation of such proportions would necessarily have a long-lasting effect on atmospheric dynamics. But supposedly the average temperatures fell only slightly[43] and the atmospheric circulation in 1884 was above normal and did not sink to a strongly developed minimum until 1888[44]. While the equilibrium of the world of statistics may not have been disturbed by Krakatoa, events were rather different in the world of nature. Without the stabilizing effects of the ocean, the effect of Krakatoa would have been catastrophic. A person sitting in warm bath water does not experience any discomfort when the heating is turned off – at least, not right away. But what can possibly happen to the higher latitudes of the earth if the warm water from the tro¬pics is already on the way? A cooling-off effect will only become noticeable after the passage of some time and continued blockage of solar radiation. The influence of the oceans was shown clearly by the fact that coastal areas had above-average temperatures in 1884, whereas continental land masses such as Russia, Siberia, India, China, Canada, and the USA (inland areas far from the Atlantic) recorded very cold winters in the years up to 1888[45]………………….
The fact that the air circulation did not reach its minimum until 1888 is not surprising. From the middle of the 1880s on, a “weakening” of the oceans in the higher latitudes must have become noticeable. The less heat energy the ocean feeds into the atmosphere, the weaker become the dynamics in the atmosphere. This also becomes clear when it is seen that three years after Krakatoa the temperatures above land rose more sharply than above the oceans[46]. ”
The entire article of about 40 pages is here: http://www.whatisclimate.com/conditions-for-the-protection-of-the-global-climate.html
Just wondering , they must be running out of stuff to blame Co2 on by now surely?
CO2 causes verrucas… & the evidence is clear –
over the last 70 yrs I’ve never had a verruca;
but since CO2 topped 406ppm I’ve had a verruca… proof positive.
So, I’ve copy & pasted my ‘Noballs prize’ certificate & put it on the wall.
See, that’s how climate science is done…easy-peasy.
“As you can see, while in both volcano years the winter is slightly warmer than the fall, in neither case is the difference statistically significant.”
I am not a statistician, but I once was told by someone who is that in most cases, you need a sample size of at least four to even begin to think about drawing statistically meaningful conclusions.
As Krakatau is south of the equator, why does it affect Northern Hemisphere temperatures. Shouldn’t there be the same or bigger effect south
Mt P was conveniently quite symmetric in it’s spread. El Chichon was somewhat south and took longer to spread to NH. The probably explains the long, broader but lower impact on TOA flux. A large enough eruption will end up spreading globally.
DONT ask questions !!! Just Believe !!!
or burn in hellfire…or was it drown…or was it starve…
Well, anyway it was something nasty.
For the porpoise (because it sounds fishy) of this paper… the equator was moved south of Krakatau, isn’t climate seance a wonderful thing.
want are ranting on about, I’ve pointed out that there is not an iron curtain between N adn S and there will be mixing as detected clearly in the spreading after El Chichon.
Wll what about this then
https://en.wikipedia.org/wiki/Year_Without_a_Summer
Seriously genuinely puzzled.
Tamboras is widely held to have created a ‘nuclear winter’ scenario…
The idea is a ‘nuclear winter’ when you would expect a summer or several summers.
The Mt Tambora eruption in 1815 took place in the middle of a string of six or seven VERY cold years. e.g. the last Frost Fair on the frozen Thames took place in 1814 — the year before the eruption. FWIW, even today, mid-summer temps in Northern New England in places where folks were trying to farm in the 1810s can and do drop to near freezing.
If they can’t explain the mechanism, how the eruption changed the weather, then it didn’t happen. Is the explanation in the paywalled stuff?
My hypothesis is that you need to sacrifice many more virgins to stop the big, scary eruption from changing the weather.
The data, to me, appear to perfectly support the hypothesis of ‘no effect at all’.
From the historic record, super volcanic eruptions seem to have caused cold winters and crop failures a few years afterwards. As a fairly widespread effect but maybe not as a fully worldwide phenomenon.
“The Hatepe eruption, named for the Hatepe Plinian pumice tephra layer,[1] sometimes referred to as the Taupo eruptionand dated to around 180 AD, was Lake Taupo’s most recent major eruption. It is considered New Zealand’s largest eruption during the last 20,000 years. The eruption ejected some 120 km3 (29 cu mi), a VEI 7 eruption,[2] of which 30 km3 (7.2 cu mi) was ejected in the space of a few minutes. This makes it one of the most violent eruptions in the last 5000 years, comparable to the Minoan eruption in the 2nd millennium BC, the Tianchi eruption of Baekdu around 1000 AD and the 1815 eruption of Tambora. The resulting ash turned the sky red over Rome and China.[3]”
https://en.wikipedia.org/wiki/946_eruption_of_Paektu_Mountain
https://en.wikipedia.org/wiki/Hatepe_eruption
https://en.wikipedia.org/wiki/Minoan_eruption
https://en.wikipedia.org/wiki/Mount_Tambora
correlation is not causation … ever …
Post hoc, ergo propter hoc.
Yes, to assume causation is wrong when all you have is correlation. But it’s not true that correlation cannot imply causation. It’s usually at least worth a look.
If I suddenly put 120 km3 of ‘stuff’ in the atmosphere it’s probably going to do something.
VB_Bitter. The null is that is has no effect not that it will ‘probably do something’.
The paper, Willis and most commenters don’t seem to distinguish between effusive and explosive eruptions, and perhaps all interested should look at Peter Langdon Ward’s work, his book “What Really Causes Global Warming?” and WhyClimateChanges.com. After a long USGS career studying volcanoes and independent research Ward convincingly concludes that there is a much better correlation between episodes of effusive (basaltic) eruptions, which cause ozone depletion and periods of warming, than there is due to greenhouse effects.
In summary, effusive eruptions emit chlorine and bromine which deplete the ozone layer and cause warming. His studies covering over 100,000 years of eruptions in Iceland show a remarkable correlation with colder and warmer periods during the last ice age, such eruptions being followed by warming. More recently when ozone has been able to be measured directly depletion was recorded, for example following the Iceland eruptions of 2010 and 2014. Explosive eruptions such as Pinatubo 1991 also emit chlorine and bromine which deplete the ozone layer but additionally sulfur dioxide forming aerosols in the upper atmosphere which scatter and reflect sunlight and cause cooling to an extent that overwhelms the warming effect of ozone depletion.
Interesting, thanks.
Willie, I hate to use Wikipedia for anything, but since I’ve lived in Chicago and/or the Chicago area since 1976, continuiously, I am VERY aware of the weather.
Mt. Pinatubo erupted in June 1991. There was a noticeable drop in summer temperatures as the ash cloud dispersed and sat in the upper atmosphere. That led into a severe winter in the Midwest overall, including a blizzard in some parts.
https://en.wikipedia.org/wiki/1991_Halloween_blizzard
and this one: https://www.weather.gov/dlh/1991halloweenblizzard
Chicago didn’t get hit as hard by that as cities north of us, but we did get some snow, and quite crappy weather. In fact, the snowfall total for Chicago 1991-1992 was 28.4 inches. In fact, in the spring of 1992, the last killing frost was in May
Latest Date: May 25, 1992 (32) (NWS records)
So since this “study” was done for the purpose of getting attention and maybe some cash, too, is there any way to make these people look more ridiculous than they do already?